

Inflation Picks Up and Growth Cools Keeping Fed Uncertain and Patient - Midday Macro – 2/16/2024
Inflation Picks Up and Growth Cools Keeping Fed Uncertain and Patient - Midday Macro – 2/16/2024
Color on Markets, Economy, Policy, and Geopolitics

Inflation Picks Up and Growth Cools Keeping Fed Uncertain and Patient
Midday Macro – 2/16/2024
Market’s Weekly Narrative:
It was another interesting week in markets, with small-caps outperforming their larger brethren despite inflation coming in broadly hotter than expected. Value also outperformed growth from a pure factor perspective, with yield enhancement objectives driving flows despite Treasuries selling off. Energy was the best performing sector, followed by materials, while technology was the worst. Today’s OPEX will likely allow trading ranges to widen next week, reducing some of the call-heavy positioning/skew, with next week’s NVDA earnings call dictating where indexes go next. Unlike equities, which were repeatedly bought on dips, Treasuries did not recover their post-CPI losses, and yields broke above recent ranges across the curve, with technicals signaling more pain to come. There was a lot of economic data this week, but as we teased, the CPI report took center stage, with core services remaining sticky, all but eliminating any hopes of a March rate cut in market pricing. Import/Export prices and PPI also firmed up, especially on the service side for the latter, indicating that the strong growth enjoyed over the last few months may endure a lost disinflationary progress cost. Elsewhere, retail sales were weaker than expected, as was industrial production. However, both had the weight of cold weather upon them, increasing the uncertainty over whether the economy had really cooled in January or just frozen for a week or two. The NFIB Small Business survey weakened on weaker expectations for sales and earnings while hiring intentions also fell. Regional manufacturing PMIs in NY and Philly rebounded to more neutral readings. Housing starts were weaker, likely also due to cold weather, while homebuilder sentiment was broadly higher as expectations of lower rates and still tight supply supported confidence. There were a number of Fed speakers this week, and we cover them in our policy section in more detail, but in general, the hawkish stance that came forth after the stronger January jobs report continued, with post-CPI speakers even more uncertain and willing to be patient.

Oil was higher on the week with renewed geopolitical concerns due to Israel walking away from an unrealistic ceasefire agreement and despite U.S. inventories jumping, although gas and distillates stocks fell as refinery maintenance and January colder season hangover production there. Supply out of Russia is also looking less certain, while the U.S. drill count looks to be peaking. Additional announcements of stimulus out of China, this time more focused on fixed asset investment, supported copper, which had fallen to an overly bearish positioning picture. Core aggs still have seen no relief, with corn, beans, and wheat all trending lower. Cocoa reversed recent parabolic gains. Cattle and hogs were also higher on the week, with cattle now near recent highs again. The dollar ended the week little changed, with the $DXY giving back post-CPI gains and ending the week near 104.25. The only major cross that was meaningfully weaker against it was the Yen due to weaker Q4 GDP growth than expected.

Headlines:

Deeper Dive:
We have long believed that disinflationary progress would likely stall out in the first half of this year due to stronger-than-expected growth and still historically tight labor markets (something we have written about). Supply-side impairments have largely healed despite the recent Red Sea and Panama Canal turmoil, and as a result, the “final mile” requires a diminished demand-pull pulse versus the already normalized cost-push progress we have seen. This week’s inflation data has somewhat vindicated that view, although one month's worth of data does not make a trend. It does, however, cause more significant uncertainty for policymakers, something we have increasingly heard over the last two weeks following the stronger January jobs report, which showed stickier wage pressures. Of course, as apparent in the data this week, January’s cold weather and still volatile seasonal adjustments have made the quality of this week’s inflation, retail sales, manufacturing, and housing data less reliable. That hasn’t stopped core PCE forecasts from rising, now over 0.4% for the January reading. To be clear, we don’t expect a great reacceleration of inflation akin to what was seen in the 70s and, to a lesser extent, the 90s. Instead, we have a setup where Fed policy needs to be patient due to high levels of uncertainty and a balanced “totality” of the data. Further, the reduced rate sensitivity of the economy to date is causing policymakers to question whether there has been a structural change in r* right as the causes for the resilient economy may begin to fade increasingly. Said differently, we have a timing mismatch between the unique situations brought on by the pandemic and the increased uncertainty over the effects of policy. The Fed is turning more hawkish just as sentiment and activity may be peaking.

*Even with shelter getting credit for much of January’s CPI gains, core CPI ex-shelter has picked up in the last few months

*Although still elevated, supply chain issues continue to be less discussed on earnings calls, indicating supply-side disinflationary gains are running out

*Whether basing LEIs, looser FCIs, or surging consumer confidence, things have notably improved quickly. Is this sustainable, or will there be payback?
We view the resilient growth story as driven by historically healthy household and business balance sheets, hoarding of labor, and a positive fiscal pulse. Well, balance sheets are normalizing, and the weaker areas, such as commercial real estate and lower-income cohorts, are increasingly showing cracks as valuations fall for CRE and delinquencies rise for consumers. At the same time, despite the official data, layoffs are increasing while hiring has been more concentrated. The continual barrage of negative labor market headlines and reduced turnover will slow real disposable income gains moving forward. Finally, D.C. is not functioning, and although still positive due to past spending measures such as the IRA and infrastructure bill, this fiscal multiplier is waning. The party isn’t over, but we are entering the later hours, where things get more messy. Of course, this doesn’t mean the economy is in imminent danger of a recession, but instead, the pace of growth exhibited in the second half of last year is unsustainable, and the economy needs to sleep it off, have a hangover for a little while now, and enter a below trend period of growth. As we highlighted in past writing, higher productivity, which has been a big part of the “no/soft landing” but still disinflationary narrative, does not necessarily go hand in hand with increased hiring, as the textbooks would have us believe. Much of the business investment done post-pandemic was to limit the need for labor, given how hard it was to secure qualified workers. As a result, although we are sympathetic to views that last year's increases in productivity will reduce pressure on margins, we see those cost-saving gains coming from the variable cost side, aka labor. If labor markets cool, so will consumer spending. Further, margin gains from increased productivity may be offset by increasing input costs and reduced pricing power, weighing on any positive earnings forecasts. Even as the end consumer experiences stickier inflation, falling demand and inflation fatigue mean firms bear most of the input cost increases.

*The excess savings story has run its course

*Hiring and turnover have increasingly been cooling…

*…while layoffs look to be picking up

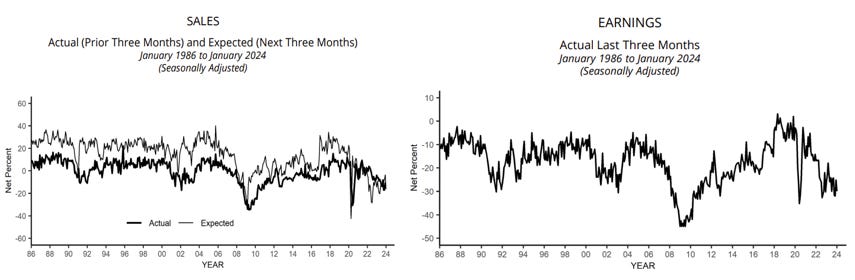
*Despite stickier core-service inflation, business surveys are showing reduced pricing power
Speaking specifically to equities, we are still clearly in a “buy the dip” driven rally mode, with momentum remaining positive both purely from a technical perspective and also from positioning, especially in options, as “AI” plays are driving indexes higher. Still, small caps are also keeping pace, as their post-CPI recovery has demonstrated. With the S&P’s forward P/E ratio now above 20, according to Factset, the index is not cheap, even if the increase in P/E has primarily been driven by the mega-caps. Breadth has been deteriorating, indicating that cheaper parts of the markets continue to underperform, and this is truly a momentum-driven story. With positioning highly concentrated, institutional holdings are highly correlated to index returns. Overall, indexes seem priced for perfection, and Nvidia’s earnings release will be the next major catalyst. We don’t have an edge in predicting the results there. Instead, we see seasonals increasingly negative for the next few weeks, even for an election year, and stickier inflation causing the Fed to lean further into a hawkish patient stance, keeping policy restrictive longer, raising real rates further, and reducing tailwinds for looser financial conditions. As a result, despite the earnings season coming in better than expected, we continue to hold a skeptical view on whether risk sentiment can become more supportive from here based on any fundamental developments. Instead, it seems we are in a positive feedback loop due to positive optionality and concentrated positioning. This in itself can drive markets higher for a while longer but does not compel us to chase. Regarding Treasuries, this week's hotter-than-expected inflation readings moved yields above their recent range. With our view that growth will slow and inflation will remain sticky but not meaningfully accelerate enough to derail rate cuts this summer, we continue to view the long-end as close to fairly valued.

*Leadership has been concentrated in the mega-caps, and breadth has been worsening

*Forward P/E ratio continues to tick higher despite a better-than-expected (outside financials) Q4 earnings season

*Positioning is historically long, as reflected in a wide variety of data

*Inflation as the biggest tail risk moved higher in the BofA GFMS
In summary, we believe growth will gradually slow in the first half of the year while disinflationary progress stalls. With full disclosure, this was our view entering into the fourth quarter, and we were wrong. However, we see increasing signs that U.S. growth has been running at an unsustainable pace, and there will be a normalization period as the drivers of growth discussed above weaken. Although this slowdown may take time and the economy's resilience continues (seen recently in NFP, ISM Man/Service), markets price forward, and equities, credit, and Treasuries will front-run. To be clear, it's unlikely there will be a sudden slowdown without a major exogenous shock, keeping the “immaculate disinflation” soft-landing narrative persistent. The recent surge in productivity growth in isolation reduces pressure on corporate margins, reducing corporations' need to shed costs and/or raise prices. However, the current increase in productivity is above the longer-term trend and may reverse, and falling demand may leave firms with too much capacity. Fiscal policy has been a dominant growth driver but is unlikely to remain as supportive. Finally, the consumer is facing a reduced level of savings, especially for lower-income cohorts, who now have rising delinquencies and reduced access to credit, all while facing a labor market moving into better balance and increasing layoffs. On top of that, although inflation has been cooling, we are still far from where prices once were, and recent increases at the pump, insurance, utilities, and less pass-through to lower food costs (vs. commodity markets) will make further gains on positive sentiment harder.

Despite recent slowdowns in price increases, Americans still perceive inflation as high, attributed to the elevated costs of highly visible and frequently purchased items

*The Fed is happy with where policy is given the uncertainty and to keep policy at the current level of restrictiveness needs to cut the amount they are forecasting, 75bps
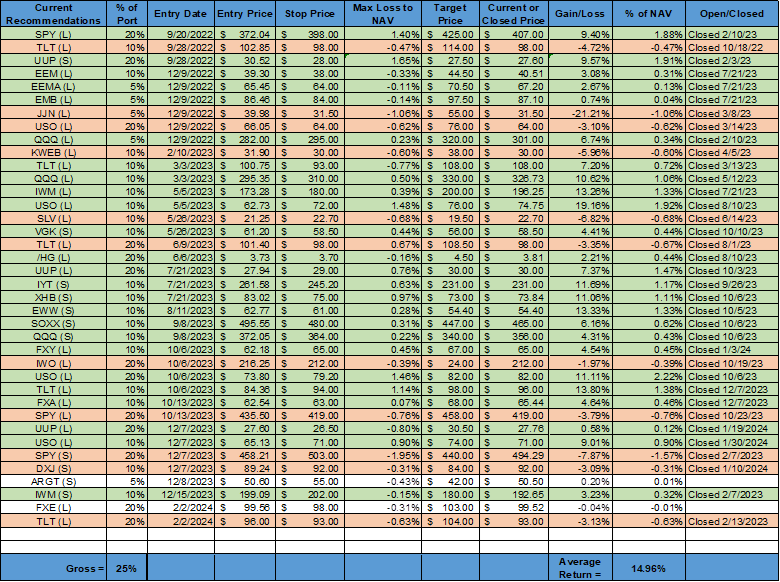
*We closed our short S&P and Russell positions last week, not liking what we saw with the overall momentum in equities. In the past, we didn’t give our October longs in $SPY and $IWO enough room to ride and decided not to repeat that mistake with our December $SPY short. Errors beget errors, and we took too large a loss there. We were also stopped out of our long-end Treasury long ($TLT) due to the hotter CPI print and want to respect our stop there, given technicals indicate yields could still rise higher, even though we believe that will be temporary. The book is now at a low gross level due to our lack of conviction.
As always, thank you for reading, and please share our newsletter if you like it and know others who may enjoy it. Please feel free to reach out with any questions or comments. – Michael Ball, CFA, FRM
Policy Talk:
There has been a significant number of Fed speakers over the last two weeks, and while officials keep waving off the prospect of a March cut, it's worth noting that even the more hawkish members are still discussing cuts more broadly. It just won't be anytime soon, and there won't be as many as markets expected. As a reminder, Treasury yields rose too fast and far last summer, and financial stability risks grew, catching the Fed off guard and forcing a dovish pivot in messaging. Luckily, disinflation progress picked up in the second half of the year due to supply-side improvements, and the Fed could increasingly confirm rates were at their terminal rate for the cycle. Currently, the Fed is not looking at yields nearly as high or financial condition tightening, reducing financial stability concerns, and allowing the now more hawkishly patient message that has emerged following stronger Q4 data and more sticky core service inflation (as well as a pick up in PMI price readings). The idea that the neutral rate is now higher due to businesses and households being less leveraged and more termed out, reducing interest rate sensitivity, is also gaining traction. As a result, pricing of when and how much the Fed will cut this year has notably shifted, with July now being the most probable month it starts. This more patient posturing will likely also mean that reducing balance sheet runoff could take longer than expected. We are a long way from a normal reserve regime, with around $4 trillion (ON RRP + Excess Reserves) in excess liquidity currently on the Fed’s balance sheet versus a pre-pandemic average closer to $1.5 trillion. Fed policymakers continue telling us policy is appropriately restrictive level, given the focus is still on price stability and a view that labor markets are entering a more healthy balance (and not near contracting), with the collective of Fed officials generally looking well aligned in their outlooks despite a dispersion in SEP forecasts further out. As it stands, any forecasted cuts this year are seen as keeping policy where it is opposed to any desire to ease it.

As always, we will highlight some recent Fed speakers, keeping it high-level today. Chicago Fed President Goolsbee spoke a number of times over the last few weeks, most recently at the Council of Foreign Relations after the stronger-than-expected CPI report, noting that "even if inflation comes in a bit higher for a few months...it would still be consistent with our path back to target." Goolsbee cited that CPI shelter prices were at odds with market data on rents and new leases, and as a result, he was confident the disinflationary trend would continue. "Rate cuts should be tied to confidence in being on a path toward the target," Goolsbee said, "I think it's worth acknowledging that if we stay this restrictive for too long, we will start having to worry about the employment side of the Fed's mandate." Atlanta Fed President Bostic reiterated that he is in no rush to cut rates with growth as strong as it is and labor markets healthy. “The evidence from data, our surveys, and our outreach says that victory is not clearly in hand, and leaves me not yet comfortable that inflation is inexorably declining to our 2% objective,” Bostic said in a speech at an NYU Money Marketeers event. He noted that employment growth has outpaced its performance in previous tightening cycles, with average tightening cycles eliciting a 1.5 percentage point increase in the unemployment rate. He highlighted that average hourly earnings picked up over the past three months. Bostic’s regional business contacts continued to express optimism about the future, leading him to worry that a burst of new demand may be coming, undermining the progress made in rebalancing supply and demand to a non-inflationary level, especially for goods. He concluded by saying that history is not repeating itself, causing him to have greater uncertainty in a post-pandemic world where the U.S. economy is less rate-sensitive. This reduced rate sensitivity, which he noted had already been occurring, means the appropriate level of policy may have structurally changed. In conclusion, he expects disinflationary progress to continue, but at a rate less than markets expect, and as a result, the Fed will need to be more patient.

Richmond Fed President Barkin gave prepared remarks titled “Inflation: Handle With Care,” in which he covered the strength of the economy and progress made on inflation. Still, he noted that the error in predicting this was also making him uncertain about declaring victory on inflation. He cited lessons from the past and his general nature as giving him caution. He sees the labor and housing market as structurally changed, with both potentially increasing inflationary pressures moving forward. Finally, he highlighted the deglobalization trend occurring, suggesting higher costs due to supply chains prioritizing resiliency over efficiency and costs. “I think there’s a real risk that there will be continued inflationary pressure,” he said, adding, “Declaring victory at this point seems pretty bold.” Governor Kugler gave her first prepared remarks with the original title of “The Outlook for the Economy and Monetary Policy” at an event at the Brookings Institution. She highlighted her labor market focus due to her background. Kugler reviewed the progress made against inflation, noting reduced progress on the service side compared to goods but expecting further progress due to wage growth moderation as labor markets moved into better balance. She also sees inflation expectations as well anchored, reducing wage-spiral developments. She concluded her remarks by noting the strong level of consumption and geopolitical uncertainty, keeping her focused on the inflation side of the dual mandate.

Governor Bowman said she expects inflation to fall further with interest rates held at their current level but saw the economy as not there yet and “a number of important upside inflation risks remain.” She cited geopolitical conditions that could tie up supply chains, continued easing in financial conditions that could boost demand, and tight labor markets that could keep high service prices sticky. Cleveland Fed President Mester noted she believed policy was in a good place and still supported cutting rates three times this year, with “no feeling now that we have to rush.” She did not see January’s strong labor market report as changing her view, believing further wage moderation would occur. “At this point, I suspect we will see further moderation of wage growth, with a gradual slowing in job growth and an uptick in the unemployment rate over the year from its very low level,” she said. Minneapolis President Kashkari published an essay titled “Policy Has Tightened a Lot. How Tight Is It?” which he followed up on prior writing. He noted that inflation had more progress than expected while growth continued to show “remarkable strength.” He attributes this development to normalizing supply-side factors as supply chains have “healed” while there was a strong boost to the supply of labor. He does believe that the Fed’s tightening actions kept inflation expectations well anchored but views the tightness of policy as not as restrictive as others, choosing to use the ten-year real yield instead of the real Fed funds rate, which has risen by much more than the ten-year. He went on to attribute the strong levels of activity to more interest rate-sensitive parts of the economy like housing as well as general consumption and delinquencies, none of which led him to think the current stance of policy is overly restrictive, and in fact, the neutral level of rates may have structurally risen. There were a number of other Fed speakers, including Waller, Collins, Harker, and Daly, while many of the above-mentioned policymakers spoke multiple times across various subjects.

The New York’s January Survey of Consumer Expectations showed inflation expectations were little changed while labor markets and household finance views were mixed.
Inflation Expectations: Inflation expectations remained unchanged at the one- and five-year ahead horizons in January, at 3.0% and 2.5%, respectively, while expectations at the three-year ahead horizon declined to 2.4% from 2.6%. Inflation uncertainty increased slightly at all three horizons. Home price expectations were unchanged (3%), while food (4.9%), gas (4.2%), and rent (6.4%) declined.

Labor Markets: Earnings growth expectations increased to 2.8%, driven higher by older respondents and non-college educated. Unemployment expectations increased marginally to 37.2% but still below the 12-month trailing average. The perceived probability of losing one’s job decreased to 11.8% (from 13.4%), while leaving one’s job voluntarily also declined to 17.7% (from 20.4%). The perceived probability of finding a job decreased to 54.2% (from 55.9%), its lowest reading since June 2021.

Household Finance: Expected growth in household income increased slightly to 3.1%, while spending growth was unchanged at 5%, well above its pre-pandemic level. Credit access was seen as notably easier, as did expectations of future access. The expectation of missing a debt payment decreased to 12.1%. Respondents expect a lower interest rate on their savings rate in a year. Finally, perceptions about households’ current financial situations improved in January. The percentage of respondents expecting to be financially the same or better off 12 months from now is 76.5%, its highest level since September 2021.

The January Senior Loan Officer Survey showed that a net positive amount of banks reported having tightened lending standards further for most loan categories in the fourth quarter, although a smaller net share of banks reported tightening lending standards than in the third quarter.
Residential Mortgages: “Over the fourth quarter, banks reported tightening lending standards for all categories of RRE loans and HELOCs, except government residential mortgages and GSE-eligible residential mortgages, for which standards remained unchanged. Moderate net shares of banks reported tightening standards for qualified mortgages, non-QM jumbo, HELOCs, and subprime residential mortgages.
Other Consumer Credit: “…significant net shares of banks reported tightening lending standards for credit card and other consumer loans, while a modest net share of banks reported tighter standards for auto loans … Specifically, moderate net shares of banks reported tightening credit limits, higher minimum required credit scores, wider interest rate spreads over the cost of funds, and tightening the extent to which loans are granted to some customers that do not meet credit-scoring thresholds.”
CRE: “ …significant net shares of banks reported tightening standards for all types of CRE loans. Such tightening was more widely reported by other banks than by large banks. Major net shares of banks reported weaker demand for loans secured by nonfarm nonresidential and multifamily residential properties, and a significant net share of banks reported weaker demand for construction and land development loans.”
C&I Loans: “…moderate net shares of banks reported having tightened standards on C&I loans to firms of all sizes. The tightening was most widely reported for premiums charged on riskier loans, spreads of loan rates over the cost of funds, costs of credit lines, and collateralization requirements.”

*The net percentage of banks tightening lending standards fell further

*The decline in the percentage of banks tightening standards fell across all major consumer loan categories

*Mortgage lending standards also continue to trend lower, but a net positive percent are tightening still
The New York Fed released its fourth quarter Quarterly Report on Household Debt and Credit, showing total household debt rose by $212 billion to reach $17.5 trillion. Delinquency transition rates increased for all debt types except for student loans. About 114K consumers had a bankruptcy notation added to their credit reports in Q4, slightly less than in the previous quarter. Approximately 4.7% of consumers have a 3rd party collection account on their credit report.
Credit card balances increased by $50 (4.6%) billion to $1.13 trillion over the quarter.
Mortgage balances rose by $112 billion to $12.25 trillion. Balances on HELOCs increased by $11 billion to $360 billion. About 40K individuals had new foreclosure notations on their credit reports, mostly unchanged from the previous quarter. New foreclosures have stayed very low since the CARES Act moratorium was lifted.
Auto loan balances rose by $12 billion to $1.61 trillion.
Student loan balances increased by $2 billion to $1.6 trillion.

*Households debt continues to grow but interest payments to disposable income are at healthy levels

*Credit card delinquencies have pushed higher
Total consumer credit increased by $1.56 billion in December, following a $23.7 billion gain in November and missing market expectation of a $16 billion increase. Revolving credit (credit cards) increased by $1.04 billion (1% on an annual basis). Non-revolving credit (auto and student loans) increased by $0.5 billion (0.2% on an annual basis). On a quarterly basis, total consumer credit increased at a seasonally adjusted annual rate of 2.6 YoY. The average rate of a new car loan was 8.15% in November, while the average credit card APR was 21.47%.

*Consumers have room to leverage up but are choosing to reduce debt levels

*Real revolving credit fell slightly on the month and remains at levels seen right before the pandemic

*Credit card debt as a ratio of disposable income is still below pre-pandemic levels, while the financial obligation ratio is still historically very strong
U.S. Economic Data:
CPI increased by 0.3% in January, up from 0.2% in December and surpassing market expectations of 0.2% MoM increase. This moved the annual inflation rate lower to 3.1% following a brief increase to 3.4% in December, but higher than forecasts of 2.9%. Core CPI increased by 0.4% MoM, accelerating from the 0.3% increase in December, and above market expectations of a 0.3% MoM advance. The annual core CPI rate is now 3.9%, unchanged from the prior month and above market forecasts of 3.7%. The food index increased by 0.4% MoM (vs. 0.2% MoM in Dec), with food at home higher by 0.4% MoM (vs. 0.1% MoM) and food away from home higher by 0.5% MoM (vs. 0.3% MoM). The energy index declined by -0.9% MoM due to declines in gasoline (-3.3%) and fuel oil (-4.5%), while energy services (1.4%) increased. The index for shelter rose by more than expected, increasing 0.6% MoM (vs. 0.4% MoM) and contributing over two-thirds of the monthly “all items” increase. Core goods declined by -0.3% MoM (-0.1% MoM), with new vehicles unchanged, while used cars (-3.4% MoM ) dropped notably. Apparel also dropped by a notable -0.7% MoM after a flat reading in December. Core services ex-shelter increased by 0.6% MoM (vs. 0.4% MoM), driven higher by transportation (1% MoM vs. 0.1% MoM) due to increased vehicle insurance (1.4% MoM) and, to a lesser extent medical care (0.7% MoM vs. 0.5% MoM), education (0.4% MoM vs. 0.2% MoM) and other personal services (1% MoM vs. 0.1% MoM). The “supercore” CPI measure increased by 0.4% MoM.
Key Takeaways: The bottom line is that inflation reaccelerated in Januray with the one-month core inflation rate annualized is 4.8%, which is is higher than the average three-month rate annualized of 4.0%, which is greater than the six-month rate annualized of 3.6%. The Fed will see this report as indicating inflation is moving in the wrong direction, and although there were suspicious divergences in shelter sub-categories, “supercore" and core service measures remained sticky. The Fed will also take notice of the alternative measures firming. The Atlanta Fed's sticky-price CPI (weighted basket of items that change price relatively slowly) increased by 6.7% on an annualized basis in January, following a 4.2% increase in December. However, the flexible cut of the CPI (weighted basket of items that change price relatively frequently) decreased by -4.6% (annualized basis) in January and has declined by -0.9% on a year-over-year basis. The Cleveland Fed’s Median CPI increased by 0.5% MoM (vs. 0.3% MoM in Dec), keeping the annual rate at 4.9%. The 16% Trimmed-mean CPI increased by 0.5% MoM (vs. 0.3% MoM), moving the annual rate to 3.7% from 3.8% in December. This indicates that despite the focus being on shelters weight on the results, there was a broadening of items reaccelerating. As a result, the argument that the “last mile” will be the hardest was given some further merit in the January report.

*Both headline and core CPI rose by more than expected on the month

*“Supercore” was driven higher on a monthly increase basis due to “other,” transportation, and medical care

*Monthly annualized changes all increased despite the annual rate falling due to favorable comparables

*Core services stand out as an area that saw a reacceleration, while goods disinflation faired better

*January saw a large and unusual divergence between OER and rents that is expected to correct

*On an annual basis, Sticky-Price CPI continues to trend lower, although the one-month annualized rate rose notably

*Median and Trimmed Mean readings are trending lower, but monthly increases picked up in January
The Producer Price Index increased by 0.3% in January, following a -0.1% decline in December, compared to forecasts of a 0.1% MoM increase. The annual rate declined to 0.9% from 1% in the prior month and above expectations of 0.6% YoY. Core PPI increased by 0.6% MoM, following a 0.2% MoM increase in December, notably above market expectations of a 0.1% MoM increase. The annual core rate remained at 2.6%. Final Demand for Goods declined by -0.2 MoM (vs. -0.3% MoM in Dec), with Foods declining -0.2% MoM (vs. -0.3%), while Energy was lower by -1.7% MoM (vs. -1% MoM). Core goods increased by 0.3% MoM (vs. 0.1% MoM). Final Demand for Services increased by 0.6% MoM (vs. -0.1% MoM), with Trade increasing by 0.2% MoM (vs. 1% MoM), Transportation and Warehousing declining by -0.4% MoM (vs. -0.2 MoM), while “Other” increased by 0.8% MoM (vs. 0.3% MoM). Processed goods declined by -0.2% MoM (vs. -0.5% MoM) due to drags from food and energy, while core intermediate goods increased by 0.3% MoM (vs. 0.2% MoM). Unprocessed goods increased by 0.1% MoM (vs. -4.4% MoM), with energy materials rising, while foodstuffs and nonfood materials-less-energy both declined. Services for intermediate demand increased by 0.5% MoM (vs. 0.4% MoM), making three months of solid increases, mainly due to “other” services.
Key Takeaways: The last inflation data of the week indicated a broad firming in core measures, especially on the service side. The increase in the cost of core services was notable, especially since it occurred at the final and intermediate demand levels. Increases in services came largely from hospital outpatient care, while “chemicals and allied products wholesaling, machinery and equipment wholesaling, portfolio management, traveler accommodation services, and legal services also moved higher.” Further, moving forward, the negative contributors to headlines will likely be less prominent, with energy more range bound and expectations for refined products to trend higher while food costs are near multi-year lows, and we are doubtful that they will decline much further. Of course, this is speculation, but we highlight it simply to point out that much of the disinflationary tailwinds for PPI may have played out.

*Headline PPI dropped slightly due to favorable comparables, while core PPI increased slightly at the year-over-year reading level

*Core PPI has been elevated in January relative to its recent trend in each of the last four years, which suggests inadequate seasonal factors and is why the YoY rate was little changed
Import prices increased by 0.8% in January, following a -0.7% decline in December and surpassing market expectations of a flat reading. On an annual basis, import prices have declined by -1.3%, higher from the -2.4% YoY rate in December. Import fuel prices increased by 1.2% MoM (vs. -7.7% MoM in Dec), rebounding from sharp declines observed between October and December, with a 2.3% (vs. -8.1% MoM) increase in petroleum prices more than offsetting a -24.5% MoM (vs. -3.6% MoM) plunge in natural gas prices. Prices for nonfuel imports increased by 0.7% MoM (vs. 0% MoM), the largest one-month increase in almost two years, due to broad price increases in consumer goods (1.1% MoM vs. 0% MoM), capital goods (0.4% MoM vs. -0.1 MoM), automotive vehicles (0.8% MoM vs. 0.1% MoM), and foods, feeds, and beverages (1.5% MoM vs. -0.1% MoM). Export prices increased by 0.8% in January, following a -0.7% MoM decline in December and beating market expectations of a -0.1% decrease. On an annual basis, export prices declined by -2.4%, moving higher from a -2.9% rate in December. Prices for nonagricultural exports rose 0.9% MoM (vs. -0.8% MoM), as higher prices for nonagricultural industrial supplies and materials (1.9% MoM vs. -2.1% MoM), capital goods (0.9% MoM vs. 0% MoM), automotive vehicles (0.4% MoM vs. 0.2% MoM), and nonagricultural foods (0.5% MoM vs. -0.2% MoM) more than offset lower consumer goods (-1.2% MoM vs. 0.3% MoM) prices. Prices for agricultural exports declined by -1% due to lower prices due to broad declines.
Key Takeaways: It was the most significant monthly increase in import prices since March 2022, driven by broad rising costs across both fuel and nonfuel categories. Further, the rise in export prices was the first monthly rise since September 2023. Annual readings remain negative, but comparisons will become easier in the spring, indicating that the annual rate will likely continue to trend higher, giving weight to the slowing disinflationary progress story emerging after this week’s CPI report showed disinflation progress easing. It’s also worth noting that there were broad increases in import prices, while food and consumer goods continued to decline in cost for exports. This wider breadth of increases should garner some attention at the policymaker level when included in the totality of the inflation picture.

*Import prices rose notably in January, driving the annual rate to retrace recent declines

*Export prices also moved notably higher despite agricultural exports declining in price, moving the annual ate to its least negative level since plunging last March
Retail sales declined by -0.8% in January, reversing from a downwardly revised 0.4% increase in December, and worse than market forecasts of a -0.1% decrease. Retail sales ex-autos were down -0.3% MoM. Retail sales excluding autos, building materials, and gasoline (the components of this report that feed into the calculation of non-auto consumer goods spending within GDP) were materially weaker than forecasts, falling by -0.4% MoM. Sales at building materials and garden equipment (-4.1%), miscellaneous store retailers (-3%), gasoline stations (-1.7%), and motor vehicles and parts (-1.7%) recorded the biggest declines. In contrast, sales were up at furniture stores (1.5%), food services and drinking places (0.7%), food and beverage stores (0.1%), and flat at general merchandise stores.
Key Takeaways: The retail sales report was much weaker than expected in January, and some of the strong momentum toward the end of 2023 was revised away. The severe winter weather seen in January weighed on retail sales but does not explain the bulk of the weakness, given the -0.8% drop in non-store retail spending. The January report, combined with weaker auto sales reported by vehicle manufacturers, points to a decline in real PCE of -0.2% in January, moving real PCE to a 1½% to 1¾% annual rate. The Atlanta Fed's GDPNow is tracking a 3.2% Q1 real PCE growth estimate, which now looks notably too strong. However, it is too soon to know if consumer spending momentum is cooling, given the challenges of seasonally adjusting data at this time of year, along with the negative cold weather effects.

*There was a broad deceleration across sub-categories, with gas stations compensating for decreases elsewhere at the headline level

*Core retail sales declined for the first time in a while, with the three-month annualized average continuing to trend lower
The University of Michigan Consumer Sentiment Index increased to 79.6 in February from 79 in January, slightly below market forecasts of 80, preliminary estimates showed. The Expectations Index Improved to 78.4 from 77.1 in January. The Current Economic Conditions declined to 81.5 from 81.9. Inflation expectations for the year ahead increased slightly to 3% from 2.9%, while the five-year outlook was unchanged at 2.9% for a second month.
Key Takeaways: Consumer sentiment was unchanged in February, with consumers continuing “to feel more assured about the economy, confirming the considerable improvements in December and January across various aspects of the economy.” Respondents viewed disinflation progress as likely to continue and did not express worries over the labor market. Expectations for business conditions rose to its highest reading since December 2020. However, with gas prices rising and layoff announcements occurring daily, we see sentiment likely to come off recent gains in the following months.

*February maintained recent historical gains seen in the last few months

*Inflation expectations were little changed on the month, back at more historically average levels

*Republicans affiliated respondents sentiment made greater gains recently, likely on expectations of a Trump 2.0
Industrial production declined by -0.1% in January, following a revised 0% change in December and missing market expectations of a 0.3% MoM increase. Manufacturing output, which accounts for 78% of total production, declined by -0.5% MoM, compared with forecasts of a flat reading. The production of consumer goods (0.6% MoM vs. 0.1% MoM in Dec) increased at a faster pace, as did business equipment (-0.2% MoM vs. -0.3% MoM), although it remained negative still. Construction materials (-0.9% MoM vs. -0.5% MoM) declined at a faster rate, as did overall materials (-0.4% MoM vs. 0.1% MoM). Mining output declined by -2.3% due to winter weather, while the output from utilities soared by 6% as demand for heating surged following unusually cold temperatures in January. Capacity utilization for the industrial sector declined 0.2 percentage points in January to 78.5%, a rate that is 1.1 percentage points below its long-run (1972–2023) average.
Key Takeaways: The report showed mixed results among major industries, with consumer goods production increasing, as both gains in durable and nondurable, while business equipment and construction and business supplies all declined. Notably, construction supplies continue to weaken, given that construction overall was a driver of growth in 2023. Meanwhile, defense and space equipment output continued to post solid growth in January and was over 13 percent above its year-earlier level.

*Colder weather may have driven some declines in January, but overall manufacturing production is trending lower

*There was a notable decline in core manufacturing

*Consumer goods increased while Defense and Space continue to benefit from current geopolitical risks
The ISM Services PMI increased to 53.4 in January from 50.5 in December, better than forecasts of 52. Business Activity (55.8 vs. 55.8) remained unchanged at its current expansionary level, with ten out of fifteen industries reporting increases. New Orders (55 vs. 52.8) expaned at a faster rate, with eight industries reporting growth. Meanwhile, the Backlogs of Orders rebounded (51.4 vs 49.4) from last months negative reading, expanding slightly, while New Export Orders (56.1 vs. 50) notable expanded from a neutral reading in December. Imports (59.9 vs. 49.3) also rose notably into expansionary territory. Inventory readings showed actual Inventories (49.1 vs. 49.6) contracted at a faster rate while Inventory Sentiment (59.3 vs. 55.3) indicated firms saw levels even further “too high.” Employment (50.5 vs. 43.8) shot up to a near neutral reading, however only three industries reported an increase. Finally, Prices (64 vs. 56.7) moved notably higher, with only one industry reporting declines.
Key Takeaways: Significant expansionary moves in a number of sub-indexes, including Employment and Prices, made this a “hot” report. This is not what the Fed wants to see in the area of the economy where inflation is stickiest. Based on Janaury’s report, there looks to be a reacceleration in the service sector currently occurring. Anthony Nieves, Chair of ISM, commented that services firms "are optimistic about the economy due to the potential impact of interest rate cuts; however, they are cautious due to inflation, associated cost pressures and ongoing geopolitical conflicts. Comments regarding employment from respondents included, “Ramping up head count as projects come on line” and “Highly competitive market due to salary, demand and turnover.” Labor remained the longest listed commodity up in price, while Transformers was the longest listed in short supply.

*The overall ISM Services PMI index moved back to near the top of its fourteen month range

*There were notable jumps higher in Employment and Price measures

*There were broad increases across sub-indexes
The NFIB Small Business Optimism Index declined to 89.9 in January, compared to 91.9 in December and forecasts of 91.1. Twenty-one percent of owners reported labor quality as their top problem as their single most important problem, followed closely by inflation, which fell three percentage points to 20%. The uncertainty index increased slightly to 73 from 71 in December.
Sales and Earnings: -11% (same as Dec) of owners reported higher nominal sales in the past three months, while -16% (-12 percentage points since Dec) expect higher real sales volumes. -30% (-5) of owners reported positive profit trends, with those mentioning lower profits citing weaker sales (32%), rise of costs (15%), usual seasonal changes (15%), and labor costs (11%).
Labor and Compensation: Overall, 55% of owners reported hiring or trying to hire in January, unchanged from December. 39% (-1) of owners reported job openings they could not fill, mainly for skilled workers. The difficulty in filling positions was particularly acute in the construction, manufacturing, and non-professional services sectors. Openings were the lowest in the professional services and finance sectors. 14% (-2%) of owners plan to create new jobs. Reports of labor quality as the single most important problem for business owners increased by one percentage point to 21%, and labor cost rose one percentage point to 10%. 39% (+3) of owners reported raising compensation, while 26% (-3) reported plans to raise in the next three months.

Inventories and Capital Spending: 0% (2) of owners reported inventory gains, 13% reported increases in stocks (+1), and 19% (+4) reported reductions. -4% (+1) of owners viewed current inventory stocks as “too low.” -3% (+2) of owners plan inventory investments in the coming months. 59% (+1) of owners reported capital spending in the last six months, while 23% (-1) plan to do so in the next few months. Of those that made expenditures, 40% (same) reported spending on new equipment, 25% acquired vehicles (+3), and 17% (-2) improved or expanded facilities.

Credit Markets: 29% of owners reported borrowing on a regular basis. 26% (+1) of owners reported all credit needs met, while 3% (same) needs were not satisfied, with 6% (-2) reporting their last loan was harder to get. 18% (-2) of owners reported paying a higher rate, with the average rate being paid at 9%.

Inflation: 22% (+3) of owners reported raising selling prices, while 15% reported lowering prices. Seasonally adjusted, a 33% plan price increase in the coming months.

Key Takeaways: This was the lowest headline index reading in eight months due to a notable decline in expected real sales and, to a lesser extent, earnings trends. Plans to increase employment, views on the economy, expected capital outlays, and current job openings all fell, too. Overall, optimism remains at a historically low level. Small business owners' plans to open new positions have fallen to the lowest level since May 2020. The highest level of owners who reported lowering prices since August 2020, although the percentage of firms planning to raise prices edged up. Inflation concerns and a lack of qualified workers to fill openings remained the top concerns for small businesses, although.

*The overall index retraced its December gains and then some due to notable declines in sales and earnings expectations

*The uncertainty index continues to regain recent declines, while poor sales are growing as a problem for small businesses
Housing starts declined by -14.8% to an annualized 1.331 million in January, following a revised 3.3% increase in December and missing market forecasts of 1.46 million. Single-family housing starts declined by -4.7% MoM to 1.004 million, and multi-unit starts plunged by -35.8% MoM to 314K. Starts fell in the Northeast (-20.6% to 104K), the Midwest (-30% to 142K), the South (-9.7% to 753K), and the West (-15.7% to 332K). Building permits declined by -1.5% to a seasonally adjusted annual rate of 1.470 million in January, down from December's 1.493 million and missing market projections of 1.509 million. Multi-units declined by -7.9% MoM to a rate of 455K, while single-family authorizations increased by 1.6% MoM to 1.015 million. Across the various regions, there were declines in permits in the South (-7.0% to 800K), while increases were reported in the West (1.5% to 343K), the Midwest (6.6% to 210K), and the Northeast (19.4% to 117K).
Key Takeaways: There continues to be a tale of two cities with multi-unit starts down -36.8% year-over-year in January, while single-family starts did decrease in January but are still up 22% year-over-year. With weather weighing heavy on the results, it isn’t yet worrying that single-family starts were at the lowest level since August and had their biggest monthly decline since April 2020. On the other side, multi-unit permits reached their lowest level since April 2020, while single-family authorizations increased by 1.6% MoM to a 20-month high of 1.015 million. The bottom line is that housing demand continues to favor single-family housing, where there is an inventory shortage, while multi-unit housing, mainly in urban areas, is increasingly becoming over-supplied.

*Housing starts were driven lower by cold weather and a large drop in multi-unit

*Starts and permits have been range-bound with leadership shifting to single-family from multi-unit
The NAHB/Wells Fargo Housing Market Index increased to 48 in February, compared to 44 in January, beating forecasts of 46. The sub-index for current single-family homes increased to 56 (vs. 52 in Dec). The sub-index for prospective single-family home sales increased to 63 (vs. 60). Finally, the index for prospective buyers increased to 37 (vs. 33).
Key Takeaways: It was the highest headline reading in six months, with builder sentiment improving due to expectations that mortgage rates will continue to moderate in the coming months and a protracted lack of existing inventory. "While mortgage rates still remain too high for many prospective buyers, we anticipate that due to pent-up demand, many more buyers will enter the marketplace if mortgage rates continue to decline this year,” said NAHB Chairman Alicia Huey. “With future expectations of Fed rate cuts in the latter half of 2024, NAHB is forecasting that single-family starts will rise about 5% this year,” said NAHB Chief Economist Robert Dietz. “But as builders break ground on more homes, lot availability is expected to be a growing concern, along with persistent labor shortages. And as a further reminder that the recovery will be bumpy as buyers remain sensitive to interest rate and construction cost changes, the 10-year Treasury rate is up more than 40 basis points since the beginning of the year.”

*Confidence is again rebounding after a weaker fall/winter period in 2023
The NY Empire State Manufacturing Index increased to -2.4 in February from -43.7 in January compared to market forecasts of -15. Demand and activity measures improved but broadly remained contractionary. New Orders (-6.3 vs -49.4) and Unfilled Orders (-9.6 vs -24.2) declined at a more modest pace. On the other hand, Shipments (2.8 vs .-31.3) expanded slightly. Delivery Times (-3.2 vs. -8.4) shortened at a reduced rate, and Inventories (-9.6 vs -7.4) were seen as increasingly understocked. Employment (-0.2 vs. -6.9) moved to neutral while the Average Workweek (-4.7 vs -6.1) contracted at a slower rate. Inflation readings increased for a second month, with Prices Paid (33 vs. 23.2) and Prices Received (17 vs. 9.5) both increasing notably. Finally, the six-month ahead General Business Conditions (21.5 vs 18.8) rose slightly. Demand and activity measures were mixed but generally expanded at a faster pace. Price expectations decreased, remaining still highly expansionary, as did hiring and workweek expectations. The capital spending index was little changed at 11.7, suggesting capital spending plans remained somewhat soft.
Key Takeaways: Business activity was still contractionary but rebounded from the suspiciously drastic decline in January. Actual activity turned positive while demand and backlog measures remained contractionary. Price pressures worsened notably, but hiring activity was neutral. Overall optimism based on forward readings improved, which, with lower price increase expectations and higher capex spending, gave a broadly more positive picture.

The Philadelphia Fed Manufacturing Index increased to 5.2 in February, from -10.6 in January and better than market forecasts of -8. Demand and activity measures broadly improved. However, demand remained negative, with New Orders (-5.2 vs. -17.9 in Jan) and Unfilled Orders (-11.7 vs. -18.5) contracting at a reduced rate. Shipments (10.7 vs. -6.2) moved notably higher and back into expansionary territory. Delivery Times (-21.1 vs. -27.6) continued to shorten at a solid pace. However, Inventories (-2.8 vs. -14.6) moved to a more neutral level. Labor measures were mixed, with the Number of Employees (-10.3 vs. -1.8) contracting at a higher rate, while the Average Workweek (1.4 vs. -0.9) expanding slightly. Price measures showed a contraction in margins, with Prices Paid (16.6 vs. 11.3) expanding at a faster pace, while Prices Received (6.2 vs. 6.3) expanding at the same pace as January. Future readings were generally more positive, with new orders and production expected to expand at a much stronger pace. However, readings on backlogs, delivery times, and inventories were more contractionary. Prices and headcount are expected to increase at a faster pace, as is capex spending.
Key Takeaways: There was a broad improvement in February’s reading in the Philly Fed district, especially at the current level, although expected demand and activity increases were significant. This series (as most regional PMIs) has been volatile, so it is unclear if the trend-lower in the general business activity index is ending, but the breadth of sub-index improvements was notable. Price pressures moved against profits again, something occurring in other regional Fed surveys. The month’s special question asked about price changes in respondent’s products and for consumers overall. Regarding their own price increases over the next year, the median forecast remained at 3%, unchanged when the question was last asked in November. The median forecast for the rate of inflation for U.S. consumers over the next year was 3%, down from 4% percent in November.

*Both current and future general activity readings improved on the month with broad participation at the sub-index level

*Other than hiring activity, current readings all improved, as did the majority of six-month ahead ones
The Logistics Manager’s Index increased to 55.6 in January from 50.6 in December. There was an increase in the restocking of Inventories (52.8 vs. 44.3), especially for retailers, after a busy holiday season. This led to a considerable expansion of Inventory Costs (66.8 vs. 55.8). Also, Transportation Prices (55.8 vs. 43.1) rose for the first time since June 2022. Meanwhile, warehousing metrics expanded at a slower pace, with Warehousing Capacity (54.1 vs. 55.1), Warehousing Utilization (58.7 vs. 60.2), and Warehousing Prices (64.2 vs. 65.5) all falling.
Key Takeaways: For the first time since September 2019, every metric in the LMI was in expansion territory. The most significant move was the rise in transportation prices back into expansion territory since June of 2022 at the start of the freight recession. "We need to see a longer period of growth to call an official end to the freight recession. However, January’s report does offer evidence that the logistics industry could be moving back into a period of growth,” said Zac Rogers, Ph.D. Logistics Manager’s Index Analyst.

*The headline LMI index based in 2023 and is trending higher

*Every sub-index reading is above 50 and expanding
Technicals, Positioning, and Charts:
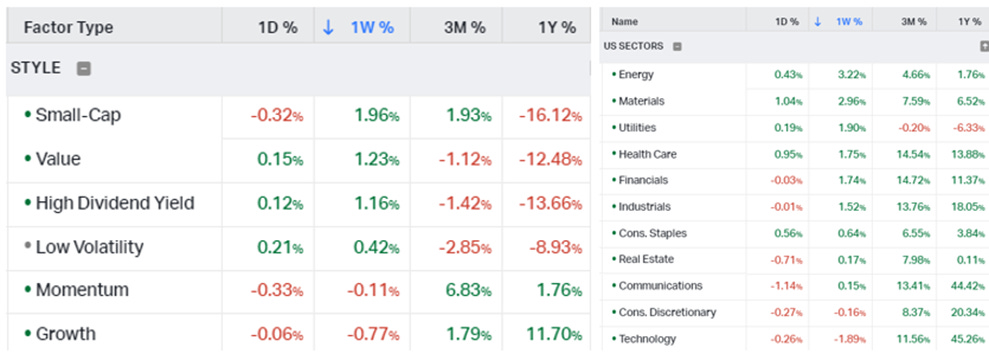
The Russell outperformed the S&P and Nasdaq on the week. Energy, Materials, and Utilities were the best-performing sectors, while Small-Cap, Value, and High Dividend Yields were the best-performing factors. Small-Cap Value was the best-performing size/value combo of the week.
@Koyfin
S&P optionality strike levels have the Zero-Gamma Level at 5000 while the Call Wall is 5000 and the Put Wall is 4995. 5,000 is major support for the S&P today, with 5,050 resistance. Spotgamma sees the S&P in a neutral zone that may hold into NVDA earnings on Wednesday. They believe between today’s OPEX and NVDA earnings, the call chasing could cool off, which would lead to a market correction lower. Spotgamma sees the transition between "correction" and "crash" at 4,900. If we do get a test of 4,900, monitoring fixed strike vol for signs of higher IV is critical (higher IV suggests lower SPX). The high level of skew could exacerbate vol higher if things begin to break down given where dealers are.

@spotgamma
S&P (/ES Futures) technical levels have support at 5030, then 5000, with resistance at 5065, then 5095.
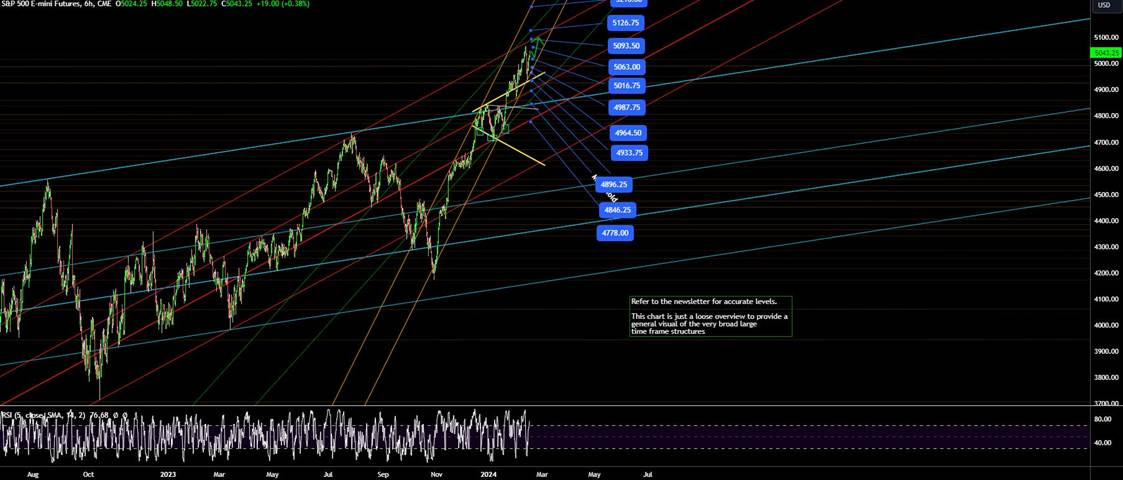
@AdamMancini4
Treasuries are lower on the day, with the 10yr yield higher by 6 bps to 4.29%, while the 5s30s curve is flatter by 3.5 bps on the session, moving to -3.5 bps.

Four Key Macro House Charts:

Growth/Value Ratio: Value is higher on the week; with Small-Cap Value the best-performing size/factor on the week.

Chinese Iron Ore Future Price: Iron Ore futures are higher on the week.

5yr-30yr Treasury Spread: The curve is flatter on the week.

EUR/JPY FX Cross: The Euro is stronger on the week.
Other Charts:

“Some of this momentum is set to continue as everyone seems to be in the same trade.” - @ayeshatariq

The US stock market is close to being the most concentrated in history. - @SoberLook

Volatility skew indicates a highly bullish sentiment among options traders.

GS is seeing extremely bullish options activity in the big tech names - namely Meta, Apple, Amazon, Google, Nvidia, and Microsoft. This has only happened 5 other times in the post-covid era (over the last 3 years). According to the team, the forward returns following this activity in 2 to 4 week forward window skews towards negative returns.

"On days when $SPX rallied so far in 2024, its average gain stood at 0.66%, compared with 0.45% on days when it fell. The ratio of the two, at 1.5, is the highest skew in favor of the bulls this far into a year since 1995." - @lena_popina

Large- and small-cap correlations to real rates have diverged. - Morgan Stanley Research @dailychartbook

"Earnings revision trends improved across the board over this past month, but revision ratios are still below 1.0 (more cuts than raises to estimates) in all three size segments (and weakest in small caps)." - Savita Subramanian – BofA.

Improving market breadth could benefit value stocks relative to growth stocks. - Stifel

“Capex down, buybacks up” follows from the view that corporate America is exiting a heavy investment period (which was inflationary), and, given the financing environment, would rather do buybacks than go on another investment binge. Amazon is a poster child for this.” - @conorsen

Banking stocks have tended to underperform as Fed cycles peak, acting as something of a canary in the market coal mine. This time around, however, the sector broke downward well before the US central bank stopped hiking interest rates. That’s partly perhaps because the Fed raised rates so rapidly this time around. - @GarfieldR1966
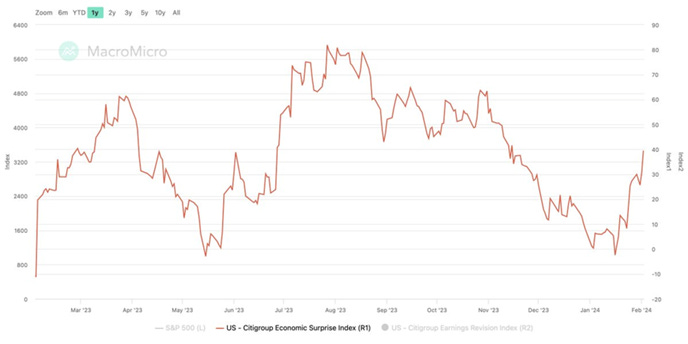
The Citi Economic Surprise Index is at its highest since November.

The EUR/USD exchange rate has been driven by market expectations of Fed policy.

"With nominal spending significantly outpacing income gains, the saving rate plunged by 0.4pp to 3.7%" in December. – BoA

"This month, 30% of consumers indicated they do not have any savings, 36% have 3 months or less in savings, 19% have 4-12 months and 16% have more than a year." – Morgan Stanley

"After reserving judgment last fall about whether the slowdown in inflation would persist, consumers now feel assured that inflation will continue to soften." - @samro

Drewry’s World Container Index decreased by 4% to $3,824 per 40ft container this week and has increased by 88% when compared with the same week last year. This week’s reduction in the index follows eight consecutive week-on-week gains, possibly reflecting an improvement in the security situation around the Red Sea. The geopolitical risk index also moderated on a one-week moving average basis.
Articles by Macro Themes:
Medium-term Themes:
Half the World (2024 Election News):
Law and Order: Two of Pakistan’s major political parties - the Pakistan Muslim League-Nawaz (PMLN) and the Pakistan People’s Party (PPP) - say they will form a coalition government after last week’s inconclusive elections. The PMLN also released a statement that Shahbaz Sharif would be the party’s candidate for prime minister. Earlier on Tuesday, the PPP’s chairman Bilawal Bhutto Zardari had said his party would support the PLMN candidate for prime minister. The move means the party of former Prime Minister Imran Khan will not be in power, despite independent candidates affiliated with it gaining the most votes. - Coalition government deal in Pakistan leaves Imran Khan’s party out of power - CNN

Special Forces: Indonesia’s defense minister, Prabowo Subianto, took a significant lead in his country’s presidential election on Wednesday, according to early projections from private polling groups, putting the former military general on track to helm the world’s third-largest democracy home to 280 million people. Unofficial tallies showed the 72-year-old had nearly 60% of the votes in a three-way contest. Subianto has vowed to finish what the president Joko Widodo started. That includes doubling down on an economic policy that has made Indonesia the world’s dominant source of nickel for the electric-vehicle industry while touching off a coal binge. Subianto has also endorsed Widodo’s pet project of moving Indonesia’s capital from crowded Jakarta to a remote part of Borneo island. - Ex-General With Checkered Past Takes Lead in Indonesia’s Election - WSJ

Bot Attack: Hate speech, political propaganda and outright lies are hardly new problems online—even if election years such as this one exacerbate them. The use of bots, or automated social media accounts, has made it much easier to spread deliberately incorrect disinformation, as well as inaccurate rumors or other kinds of misinformation. Now as large language models (artificial intelligence systems that create text) become ever more accessible to more people, some researchers fear that automated social media accounts will soon get a lot more convincing. Disinformation campaigns, online trolls and other “bad actors” are set to increasingly use generative AI to fuel election falsehoods, according to a new study published in PNAS Nexus. - How AI Bots Could Sabotage 2024 Elections around the World – Scientific America
China’s Rebalancing Act:
Boosting Stocks: China is tightening trading restrictions on domestic institutional investors as well as some offshore units. Officials this week imposed caps on some brokerages’ cross-border total return swaps with clients, limiting a channel that can be used by China-based investors to short Hong Kong stocks, said the people, asking not to be identified discussing a private matter. At the same time, some Chinese brokers that use the channel to buy mainland shares for their offshore units were told not to reduce their positions. Some quantitative hedge funds, meanwhile were banned from placing sell orders completely starting Monday, while others were barred from cutting stock positions in their leveraged market-neutral funds. - China Tightens Some Trading Restrictions for Domestic and Offshore Investors - Bloomberg

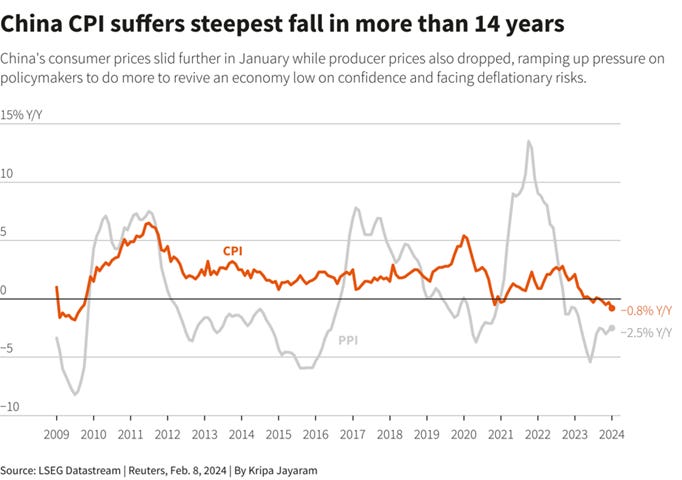
Persistent: China's consumer prices fell at their steepest pace in more than 14 years in January, while producer prices also dropped. The annual CPI decline in January was mainly led by a sharp drop in food prices, but analysts warn the overall deflationary impulse in the economy risks becoming entrenched in consumer behavior. Core inflation, which strips out volatile food and energy prices, gained 0.4% from a year earlier, down from a 0.6% gain in December. The data also pointed to persistent factory gate deflation, keeping the pressure on manufacturers as they try to recover lost business. The producer price index (PPI) slid 2.5% from a year earlier in January after a 2.7% fall the previous month, compared with a 2.6% slide forecast in the Reuters poll. Factory-gate prices were down 0.2% from a month earlier, after falling 0.3% in December. - China's consumer prices suffer biggest fall since 2009 as deflation risks stalk economy - Reuters
Longer-term Themes:
The Singularity is Near (AI Developments) and Cyber Life (More Generally):
Unsafe Zone: Last week, Meta opened up access to its virtual-reality social media platform, Horizon Worlds. Early descriptions of the platform make it seem fun and wholesome, drawing comparisons to Minecraft. But not everything has been warm and fuzzy. According to Meta, on November 26, a beta tester reported something deeply troubling: she had been groped by a stranger. Meta’s internal review of the incident found that the beta tester should have used a tool called “Safe Zone” that is part of a suite of safety features built into Horizon Worlds. Safe Zone is a protective bubble users can activate when feeling threatened. Within it, no one can touch them, talk to them, or interact in any way until they signal that they would like the Safe Zone lifted. It’s not the first time a user has been groped in VR—nor, unfortunately, will it be the last. But the incident shows that until companies work out how to protect participants, the metaverse can never be a safe place. - The metaverse has a groping problem already – MIT Technology Review

AI Enabled Adversaries: Microsoft said Wednesday that U.S. adversaries, chiefly Iran and North Korea and, to a lesser extent, Russia and China, are beginning to use its generative artificial intelligence to mount or organize offensive cyber operations. In a blog post, Microsoft said the techniques employed were “early-stage” and neither “particularly novel or unique,” but it was important to expose them publicly as U.S. adversaries leverage large-language models to expand their ability to breach networks and conduct influence operations. - Microsoft says US rivals are beginning to use generative AI in offensive cyber operations – AP News
The Demise of Unipolarity: A World of Rising Regional Sphere:
Illegal Self-Defense: Russia and China on Wednesday accused the U.S. and UK of illegally attacking military sites used by Yemen’s Houthi rebels to launch missiles at commercial vessels in the Red Sea, disrupting global shipping. U.S. Deputy Ambassador Robert Wood and UK Ambassador Barbara Woodward countered by arguing that the Houthi attacks are illegal and their “proportionate and legal action” against the Yemen rebels is being taken in self-defense. But Russia’s deputy UN ambassador Dmitry Polyansky and China’s UN envoy Zhang Jun argued that the UN Security Council never authorized military action against Yemen. The clashes came at a council meeting where UN special envoy for Yemen Hans Grundberg said promising efforts to restore peace to Yemen had been slowed by rising regional tensions linked to the war in Gaza and “in particular the military escalation in the Red Sea.” - Russia and China clash with US and UK over attacks on Yemen rebels for strikes on Red Sea ships – AP News
")
Food: Security, Innovations, and Climate Change Implications:
Extension: India, the world’s top rice shipper, may extend an export tax on the parboiled variety as part of efforts to ease food inflation ahead of national elections, a move that could keep world supply tight and send prices to new peaks. Any such move could add to the rally in benchmark Asian rice prices, which are hovering near a 15-year high after India began restricting sales of key varieties in 2023. That would be bad news for some countries in West Africa and the Middle East that rely on the South Asian nation for most of their requirements of the food staple. - India Is Considering to Extend Parboiled Rice Tax in Risk to World Supply - Bloomberg

Hacking Biology (Medical Innovation):
Breakthroughs: A Belgian boy is the first child in the world to have been cured of brainstem glioma, a particularly brutal cancer, according to the researchers who treated him. “Lucas beat all the odds” to survive, said Dr. Grill, head of the brain tumor program at the Gustave Roussy Cancer Centre in Paris. Exactly why Lucas fully recovered and how his case could help other children like him in the future remains to be seen. The tumor, which has the full name diffuse intrinsic pontine glioma (DIPG), is diagnosed every year in around 300 children in the United States and up to 100 in France. While the researchers are excited about this new lead, they warned that any possible treatment is still a long way off. - First child cured of rare brain tumour ‘offers real hope’ – The Straights Times

Automated Warfare:
Drone Branch: Ukrainian President Volodymyr Zelenskyy announced the creation of the Unmanned Systems Forces in a video message addressed to his country Tuesday. He said the new branch would improve coordination, planning and logistics as the country continues its war with Russia. Creating a military service specific to drones is unusual, even though the U.S., Israel and other countries have been using drones in combat for decades. In the U.S. government, drone fighter groups are divided among various services and agencies, including the Army, the Air Force and the CIA. But in recent years, uncrewed vehicles have begun to play a larger role in conflicts, including the Russia-Ukraine war, the Israel-Hamas war and Yemen’s civil war. - Ukraine creates a branch of its armed forces specific to drone warfare – NBC News

Drone Coalition: The Netherlands is joining a military coalition with allies including Britain that will supply Ukraine with advanced drone technology and bolster its offensive capabilities in the war against Russia, the Dutch defence minister said. Drones have become a crucial part of both Ukraine and Russia's wartime strategies for reconnaissance and striking targets, thanks in large part to their relatively low cost. Both sides are now using thousands of small, inexpensive drones originally built for enthusiasts and racers to conduct battlefield-level surveillance and attacks, while also growing their fleets of larger, longer-distance unmanned craft which can fly much further and carry heavier cameras or more explosives. - Netherlands joins coalition to supply Ukraine with advanced drones - Reuters
Other Articles of Interest:
Easier for the Economy: Lael Brainard, director of the White House National Economic Council, pointed to how inflation-adjusted manufacturing spending has more than doubled over the past year. More broadly, she laid out the case for how the administration’s response to the pandemic avoided permanent scars in the form of lost output and idled workers that usually accompanies serious downturns. In an interview, Brainard dismissed concerns that high interest rates might damp the investment in sectors targeted by those spending bills. “The investing environment should only get better as inflation has come down,” she said. - Biden Adviser Says Soft Landing Helped by Public Spending Boost – WSJ

Impounded: Thousands of Porsche, Bentley and Audi cars have been impounded in US ports after a supplier to parent group Volkswagen found a Chinese subcomponent in the vehicles that breached anti-forced labour laws. The US prohibits the import of products that have been made with forced labour in the western Xinjiang region and other areas in China under the Uyghur Forced Labor Prevention Act of 2021. Questions around forced labour found within its Chinese supply chain are particularly sensitive for VW, which has been facing mounting pressure from human rights groups and investors alike over a facility it jointly owns in Xinjiang’s capital, Urumqi. - US Porsche, Bentley and Audi imports held up over banned Chinese part - FT

More Workers: The influx of millions of unauthorized migrants in recent years has sparked a political firestorm that has paralyzed Congress and consumed election campaigns. But it also has a benefit: a bigger, faster-growing economy. The precise scale of that economic boost was laid out in the Congressional Budget Office’s latest long-term budget and economic outlook, released Feb. 7. It estimates the labor force will be larger by 1.7 million potential workers in 2024 and 5.2 million more—about 3%—in 2033 than the nonpartisan agency expected one year ago. Gross domestic product—the value of all goods and services produced in a year—should be 2.1% larger. - Immigration Wave Delivers Economic Windfall. But There’s a Catch. - WSJ

Podcasts and Videos:
MacroVoices #413 Darius Dale: Still Bullish - Macro Voices Podcasts
Lots More on Why Farmers Across Europe Are Furious – Odds Lots
How the First World War Created the Middle East Conflicts – The Great Wars
For Fun:
How Bitcoin mining devastated this New York town – MIT Technology Review
The Year Flaco the Owl Roamed Free - NYT
The Norwegian sovereign wealth fund’s $92mn Excel error - FT
VIEWS EXPRESSED IN “CONTENT” ON THIS WEBSITE OR POSTED IN SOCIAL MEDIA AND OTHER PLATFORMS (COLLECTIVELY, “CONTENT DISTRIBUTION OUTLETS”) ARE MY OWN. THE POSTS ARE NOT DIRECTED TO ANY INVESTORS OR POTENTIAL INVESTORS AND DO NOT CONSTITUTE AN OFFER TO SELL -- OR A SOLICITATION OF AN OFFER TO BUY -- ANY SECURITIES AND MAY NOT BE USED OR RELIED UPON IN EVALUATING THE MERITS OF ANY INVESTMENT.THE CONTENT SHOULD NOT BE CONSTRUED AS OR RELIED UPON IN ANY MANNER AS INVESTMENT, LEGAL, TAX, OR OTHER ADVICE. YOU SHOULD CONSULT YOUR OWN ADVISERS AS TO LEGAL, BUSINESS, TAX, AND OTHER RELATED MATTERS CONCERNING ANY INVESTMENT. ANY PROJECTIONS, ESTIMATES, FORECASTS, TARGETS, PROSPECTS AND/OR OPINIONS EXPRESSED IN THESE MATERIALS ARE SUBJECT TO CHANGE WITHOUT NOTICE AND MAY DIFFER OR BE CONTRARY TO OPINIONS EXPRESSED BY OTHERS. ANY CHARTS PROVIDED HERE ARE FOR INFORMATIONAL PURPOSES ONLY, AND SHOULD NOT BE RELIED UPON WHEN MAKING ANY INVESTMENT DECISION. CERTAIN INFORMATION CONTAINED IN HERE HAS BEEN OBTAINED FROM THIRD-PARTY SOURCES. WHILE TAKEN FROM SOURCES BELIEVED TO BE RELIABLE, I HAVE NOT INDEPENDENTLY VERIFIED SUCH INFORMATION AND MAKE NO REPRESENTATIONS ABOUT THE ENDURING ACCURACY OF THE INFORMATION. I MAY OR MAY NOT HAVE POSITIONS IN ANY STOCKS OR ASSET CLASSES MENTIONED. I HAVE NO AFFILIATION WITH ANY OF THE COMPANIES OTHER THAN EXPLICITLY MENTIONED.