
Stalled Disinflation Progress? Slower Rate of Decline Raises Second Wave Fears – Midday Macro – 1/12/2024
Color on Markets, Economy, Policy, and Geopolitics

Stalled Disinflation Progress? Slower Rate of Decline Raises Second Wave Fears
Midday Macro – 1/12/2024
Market’s Weekly Narrative and Headlines:
The S&P and Nasdaq are ending the week higher, while the Russell is slightly lower, with Large-Cap Growth, mainly in Tech and Communication sectors, outperforming. A slight headline beat in CPI failed to change the generally positive momentum started by a dovish speech by Dallas Fed President Logan last weekend. Today’s better-than-expected PPI report elicited an initially positive reaction in equities that later faded. The Q4 earnings season has started with the likes of JPM, Delta, and UnitedHealth Group reporting, all of which are ending the day lower. This week’s mainly in-line inflation data and Fed speakers not materially changing their tune (and even becoming more dovish) supported front-end Treasuries, with the curve notably steepening. It also helped that Treasury supply was well received this week with solid 3, 10, and 30-year auctions. The NFIB Small-Business Optimism Index improved on greater sales and earning expectations while hiring and inventory plans fell. Pricing and compensation plans changed little, indicating inflationary pressures are not yet abating meaningfully.

WTI Oil is ending the week little changed, falling from recent highs this morning after the U.S. and U.K. hit Houthi military targets overnight. It traded in a wide range this week due to a barrage of geopolitical headlines and a larger-than-expected reported EIA inventory build. Earlier in the week, Saudi Arabia cut its selling price to Asian customers amid rising supply, growing competition from rival suppliers, and demand concerns. Meanwhile, U.S. oil production remains near record levels, with weekly exports at a fresh high as the Red Sea crisis and the resulting run-up in costs for diverting tankers have driven up demand for cheaper American crude. Elsewhere, Libyan refineries were threatened by protests. Copper was lower on the week, trending lower since late December as traders ignored the growing supply deficit concerns. Overall, industrial metals have been sluggish in 2024, with iron ore falling notably in China due to excess supply concerns. Markets continue to wonder if Beijing will truly commit to stimulating their economy with “out-of-the-box” measures (week ??? of talking about this). The domestic equity market there were inclined to say no, with Chinese equities hitting a five-year low this week. This, on top of a bleak World Bank growth assessment for 2024, has cyclical commodity plays more challenged this week. The agg complex was slightly lower, with today’s WASDE report weighing on corn, beans, and wheat, although all are rebounding earlier losses. The dollar continues to consolidate, with the $DXY little changed on the week, ending near 102.4, despite talks of ending QT and inline inflation reports. The Euro outperformed due to better disinflationary progress, while the Yen was slightly weaker.


Deeper Dive:
Two weeks into the new year, we find ourselves a little baffled by this week’s price action. The “totality” of the data continues to warrant a patient Fed, with a higher likelihood of a below-trend period of growth and stickier inflation in 2024, not risk-positive developments. Add in a worsening geopolitical backdrop due to escalations in the Middle East and the beginning of an uncertain Q4 earning season (based on likely defensive guidance), and it is our view that risk appetite should be lower and implied volatility should be higher for equities. Still, recent dovish rhetoric from more hawkish Fed officials and the belief that December’s core PCE reading will be weaker than expected is driving yields lower again and steepening the curve. This, in turn, is supporting equities, which have rebounded from last week’s pullback, although small caps are still consolidating notable November and December gains. On the periphery, greater disinflationary gains in the Eurozone and weaker wage and profit data in Japan have reduced “higher for longer” and tightening worries there, respectively, adding to the risk-on tone. We believe these tactical “dovish” central bank developments will fade. Instead, a more sticky inflationary story will emerge, forcing markets to recalibrate “higher for longer” views back to a more risk-neutral, if not negative, level. We see the expected Q4 earning results to be in line with expectations, given the relative strength in growth in the fourth quarter (especially in PCE). At the same time, guidance may be more defensive and negative than expected as firms increasingly worry about rising costs (again) and falling demand in 2024. Further, we expect real rates to remain at current levels, weighing on further multiple expansions, which drove much of the 2023 equity returns. Putting it all together, a weaker earnings outlook and lower PE multiples based on the Fed remaining more restrictive than currently expected will tighten financial conditions again, primarily through equity and credit channels.

*Investors remain overly bullish, especially among retail

*Positioning in U.S. equities is extreme and arguably priced for an outperfromance in Q4 earning results and guidance

*Disinflationary progress has stalled, and wage pressures could remain stickier than initially thought even as hiring slows, delaying the Fed’s pivot

*Since November, financial conditions have eased at the fastest pace in history. This is not what the Fed wants, especially if Q1 core-service inflation moves sideways.
As a result of our above points, and with full respect to the current price action, which has weighed on our mock portfolio returns, we still have a bias towards being short equities and long the dollar at this current juncture. We see Treasury yields in the middle of our expected H1 ‘24 range, providing less of a tactical trading opportunity. When looking at the totality of inflation, labor markets, and growth outlook, the economy, and, by extension, the Fed, look to be entering an increasingly tricky period of tradeoffs. We see the “last mile” of disinflation, getting from this current 3% area in Core PCE to the target of 2%, requiring a below-trend period of growth. However, positive aggregate real wage gains and still healthy household balance sheets are maintaining enough consumer purchasing power to allow stickier pricing power from firms, especially in services. This has been consistently seen in both national and regional business surveys, with PMIs seeing prices received increase even as demand has been weaker. This was further confirmed by this week’s NFIB pricing plans, which were little changed from November and are trending higher (albeit on higher sales). As a result, our belief that reduced costs would allow for greater price cuts as firms competed for greater market share has not yet materialized. Although many input and logistical costs have fallen due to improved supply-side dynamics, wages have not, and although varied by industry, stronger price inelasticity has continued to give sellers more power than expected. Further, reduced cost pressures from improved supply-side dynamics have mainly run their course and are likely firming now, given increased shipping costs and what looks to be a bottoming of energy prices. The cost-push disinflationary boat has sailed. Now, the Fed will truly need a weaker demand-pull inflationary pulse to declare victory or be forced to change its narrative and signal it is willing to accept higher inflation, something we believe is very possible, especially in such a controversial election year. We will leave it here and discuss some of the macro tailwinds that could support risk assets moving forward next week, offering a counterargument to our more bearish outlook this week. We will also introduce our new macro themes for 2024, guiding our article selection in the “Articles by Macro Themes” section. Also, please take a look at our “Policy Talk” and “U.S. Economic Data” sections for more color on this week’s Fed speakers and inflation and NFIB data releases.

*The Fed’s favorite sub-measure of inflation, supercore, has not been making any progress, while there was a broader number of CPI components rising over 0.2% MoM in December than in November

*Although nowhere near where it was, shipping costs are rising due to geopolitical tensions. However, supply delivery times show no impairment to supply chains yet

*We are increasingly sympathetic to a second wave of inflation forming due to the strong level of personal consumption expenditures, allowing greater pricing power by firms, especially in services
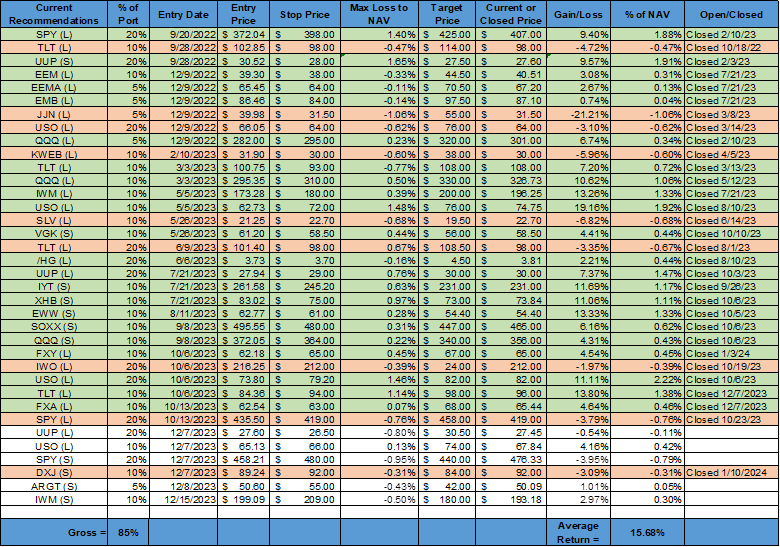
*The strong recent rally in Japanese equities stopped us out of our $DXJ short, while we have mixed results elsewhere.
As always, thank you for reading, and please share our newsletter. Please feel free to reach out with any questions or comments. – Michael Ball, CFA, FRM
Policy Talk:
Numerous Fed officials spoke this week, covering views on the economy, policy, and regulatory reform. Last week’s release of the December FOMC Meeting Minutes showed several policymakers raised the issue of ending quantitative tightening. However, given the ample level of reserves in the system, policymakers seem to differ in the appropriate time to start the process of ending QT. In a speech given last Saturday, Dallas Fed President Logan outlined benchmarks the Fed could use to guide its decision, but NY Fed President Williams countered in a speech later in the week that the Fed is not close to making any adjustments to QT with aggregate bank reserves at levels similar to when the Fed started QT. In fact, reserve balances increased in 2023, despite around $825 billion decline in Fed assets over the same period due to drops in the overnight reverse repo facility (-$1.5 trillion), indicating the cash being extinguished in the Fed’s bond holding runoff is falling on O/N RRPs rather than bank reserves, which doesn’t indicate a shortage of cash available for repo financing is pressuring rates higher.

William’s speech also noted that policy is restrictive enough, but this will need to be maintained for some time, and rate cuts will only happen once the Fed is confident that 2% inflation will be reached and sustained, which he was not yet. Atlanta Fed Bostic said he believes the Fed is on a path to achieving its 2% target, but “the goal is to stay on that path,” he said in a moderated discussion with the Rotary Club of Atlanta. He worried that tight labor markets and rising real wages would keep consumer purchasing power higher than what was needed to keep disinflationary progress going. Cleveland Fed President Mester said it was premature to consider cutting interest rates as soon as March but believes policy is in a good position, emphasizing that December’s CPI inflation data suggests policymakers have more work to do. However, she said, “We don’t want to see the progress in inflation stall out, but I don’t think this report suggests that’s happening.” She also added that inflation expectations had been improving, giving more evidence that inflation was on a sustainable path to 2%. Richmond Fed President Barkin reiterated he still needed further evidence that inflation is trending toward target despite the CPI report coming in “about as expected.” On the topic of a March rate cut, Barkin said he didn’t want to “prejudge” a decision. Chicago Fed President Goolsbee noted in an interview with Reuters on Thursday that there was considerable disinflationary progress in 2023 and that if this trend continued, there would be room for a few rate cuts in 2024. At the same time, Goolsbee said, he needs to see more data confirming the recent easing in price pressures to judge how soon or how fast those cuts in borrowing costs should take place. We highlight in more detail speeches given this week by Williams, Logan, and Bowman below.

New York Fed President Williams gave prepared remarks titled “Rules of Three” at the EDC and BICNY’s 2024 Regional Economic Outlook conference. Williams started his remarks by identifying where the Fed stands regarding its two mandates, noting the labor markets look very good. At the same time, more work is needed on the price stability side. He believes the labor market is in a better balance but is still “tight” compared to pre-pandemic measures. He noted it will be harder to increase the labor supply moving forward. He continued to use his onion analogy when discussing disinflationary progress. Continued progress in commodity input, logistics, and goods costs means the first two layers of the onion are near zero. He went on to say he is “beginning to see significant progress in the third, innermost layer of the onion, too,” core services inflation. He highlighted that inflation expectations “have been quite encouraging,” with long-term expectations well anchored and medium-term back to pre-pandemic levels. He concluded his thoughts on inflation by noting that trend wage inflation has declined from its peak, indicating labor markets were in better balance. Turning to policy, he believes the current restrictive stance will “continue to restore balance” and bring inflation back to target; however, the “future remains uncertain.” He concluded by stating the Fed will continue to reduce its security holdings and see no adverse effects on market functioning. He expects the Fed to slow and stop QT when reserves balances are near “ample,” a point not close yet. Williams, however, acknowledged that demand for reserves is much higher than it was the last time the Fed talked about slowing the first round of QT, but it’s unclear how much larger the amount is. He committed to closely monitoring money market conditions as the RRP facility declines and the balance sheet shrinks.
“Labor force participation has trended upward, and immigration rates have returned to pre-pandemic levels. But there are limits to how much supply can increase, and some further moderation in demand is likely needed to fully return balance to the labor market.”
“We’re beginning to see significant progress in the third, innermost layer of the onion, too. Core services inflation has come down after peaking early last year. One factor contributing to this is slowing shelter inflation, as the growth of rents for newly signed leases returns to pre-pandemic norms. And the inflation rate for core services excluding housing has also slowed considerably.”
“The strategy and implementation of the reduction in our security holdings is working exactly as designed. Thus far we have reduced our securities holdings by about $1.3 trillion, with no signs of adverse effects on market functioning.”

Dallas Fed President Logan gave prepared opening remarks at the annual meetings of the International Banking, Economics and Finance Association, where she called for a slower pace in the Fed’s balance-sheet reduction and then gradually end the program to reduce the likelihood of having to stop it abruptly. She started her remarks by noting that inflation was in a better place as the economy moved into better balance, and progress since the summer was in line with reaching the Fed's target in a timely manner. She highlighted that her regional business contacts are seeing growth “settling down” and not collapsing, reducing her recessionary worries. The labor market is also rebalancing but remains tight. However, wage growth “appears to be somewhat more consistent” with the Fed’s inflation target. Logan warned that risks still remained, citing renewed supply chain pressures from geopolitical risks and weakness in commercial real estate. She also noted that the easing in financial conditions could hurt disinflationary progress. Turning to the Fed’s balance sheet, Logan highlighted the changes that have occurred since mid-2022, noting increased levels of reserves despite falling securities holdings due to changes to the ON RRP facility. She credited increased issuance and less uncertainty over the path of interest rates as motivating greater investment into T-bills. However, she doesn’t see liquidity as overly abundant. In the aggregate, though, “as rate conditions demonstrate, the financial system almost certainly still has more than ample bank reserves and more than ample liquidity overall.” She worries that weaker banks may be more vulnerable, though, and called for a reduced pace of runoff to ensure financial stability in light of the rapid decline in the ON RRP.
“The ratio of job vacancies to unemployed workers has fallen, as has the rate of workers quitting their jobs. And wage growth appears to be somewhat more consistent with our 2 percent inflation target. Contacts tell me that applicant pools are growing, and job candidates’ salary expectations are moderating.”
“Restrictive financial conditions have played an important role in bringing demand into line with supply and keeping inflation expectations well-anchored. Yet, over the past few months, long-term yields have given back most of the tightening that we saw over the summer. We can’t count on sustaining price stability if we don’t maintain sufficiently restrictive financial conditions.”
“Normalizing the balance sheet more slowly can actually help get to a more efficient balance sheet in the long run by smoothing redistribution and reducing the likelihood that we’d have to stop prematurely.

Fed Governor Bowman gave prepared remarks titled “New Year’s Resolutions for Bank Regulatory Policymakers” at the South Carolina Bankers Association, where she discussed monetary policy and bank regulatory reforms. She noted that tighter policy has had the intended effect of lower inflation over the past six months. She noted that labor markets remained tight, but the pace of hiring was slowing, and there was a better balance. These developments have led her views on policy to “evolve,” and she now sees policy at an appropriate place to see continued disinflationary progress. She still sees upside risk for inflation, especially from growing geopolitical pressures, and highlighted easier financial conditions as supporting stronger growth, which could stall disinflationary progress. She focused on how continued labor market tightness could support stickier service sector inflation. As a result, she emphasized the need to weigh incoming data. Bowman went on to highlight the key developments in bank regulatory reform in 2023, calling 2024 a regulatory tidal wave. She noted that the events surrounding the bank failures in March changed the course of regulatory reform and that the reviews done were limited in scope, and she questioned the results. Bowman was also critical of changes made to the CRA and fee caps on community banks. She went on to cover other changes and give her views on the effectiveness of the reforms.
“…based on this progress, my view has evolved to consider the possibility that the rate of inflation could decline further with the policy rate held at the current level for some time. Should inflation continue to fall closer to our 2 percent goal over time, it will eventually become appropriate to begin the process of lowering our policy rate to prevent policy from becoming overly restrictive. In my view, we are not yet at that point.”
“To the extent that both food and energy markets remain exposed to geopolitical influences, they present upside risks to inflation. There is also the risk that the recent easing in financial conditions encourages a reacceleration of growth, stalling the progress in lowering inflation, or even causing inflation to reaccelerate. Finally, there is a risk that continued labor market tightness could lead to persistently high core services inflation.”

The Board of Governors’s November Consumer Credit Report showed total consumer credit increased by $23.7 billion in November, from a $5.7 billion increase in the previous month and way above market expectation of a $9 billion rise. Revolving credit increased by $19.1 billion, higher by 17.7% on an annual basis. Non Revolving credit increased by $4.6 billion, or 1.5% on an annual basis from the prior month. Both new car loan and credit card plan rates are at a recent high of 8.15% and 21.47%, respectively.

*Total credit jumped notably higher in November than expected

*In real terms, revolving credit is now at pre-pandemic highs
The New York Fed’s December Survey of Consumer Expectations showed inflation expectations declined at all horizons. Earnings growth and spending growth expectations also decreased slightly to their lowest recorded levels since 2021, while expectations about credit access and households’ financial situation turned less pessimistic.
One-year ahead inflation expectations declined to 3.0% from 3.4% in November, while the three-year declined to 2.6% from 3.0%, and the five-year declined to 2.5% from 2.7%. Inflation uncertainty remained unchanged. Home, medical care, and gas price growth remained unchanged, decreasing for food and rent.
Earnings growth decreased to 2.5%, the lowest level since April 2021, while unemployment expectations decreased to 37%. The perceived probability of losing one’s job decreased slightly to 13.4% while leaving voluntarily increased to 20.4%.
Expected household income decreased slightly to 3%, remaining in a narrow post-pandemic range. Spending growth also declined slightly to 5%, well above the pre-pandemic average of 3.1%.
Perceptions regarding current and future households' financial situation improved. Perceived credit access was unchanged, but future expectations improved. The perceived probability of missing a payment rose to 12.4%, a level comparable to pre-pandemic times.

*Inflation expectations continue to trend lower
The Atlanta Fed’s Wage Growth Tracker was unchanged for a third month at 5.2% in December. Job changers experienced a 5.7% annual wage increase, the same as in November, while those not changing jobs moved higher to 4.9%, up from 4.6% in November.

*Wage Growth has remained sticky for three months now at 5.2% YoY
Economist Alberto Musalem is named next President of St. Louis Federal Reserve Bank. Musalem served as CEO and co-chief investment officer of Evince Asset Management (2018-’22), a quantitative investment technology company that he co-founded in 2018. From 2014-’17, he served as executive vice president of the Federal Reserve Bank of New York and senior advisor to the president. He led the Integrated Policy Analysis Group and the Emerging Markets and International Affairs Group, served on the Bank’s Management Committee and represented the New York Fed on the Committee on the Global Financial System (CGFS) of the Bank of International Settlements. He begins his post on April 2, 2024.

U.S. Economic Data:
Headline CPI increased by 0.3% in December, the most in three months, up from 0.1% in November and surpassing market expectations of a 0.2% MoM increase. This moved the annual headline CPI rate to 3.4% from 3.1% in November. Core CPI increased by 0.3% MoM, the same rate as in November and in line with market expectations. Food prices increased by 0.2% MoM, the same as the prior month, with increases in Food at Home (0.1% MoM vs. 0.1% MoM in Nov) unchanged and Food Away from Home (0.3% MoM vs. 0.4% MoM) increasing at a slightly lower rate. Energy costs rose by 0.4% MoM, an increase from -2.3% MoM change in November. Energy commodities were little changed, decreasing by -0.1% MoM (vs. -5.8% MoM) due to gasoline costs being slightly higher. Energy Service costs increased by 0.9% MoM (vs. 1.7% MoM) on increased electricity costs, while natural gas prices fell slightly. Core commodity prices were unchanged. Household Furnishing and Supplies (-0.4% MoM vs. -0.7% MoM) declined at a reduced rate due to rises in household equipment and floor covering. Apparel was slightly higher (0.1% MoM vs. -1.3% MoM), stabilizing from last month's declines. Recreational goods (-0.5% MoM vs. -0.6% MoM) declined for a second month due to drops in video, toys, and sporting goods. New Vehicles (0.3% MoM vs. -0.1% MoM) and Used Cars (0.5% MoM vs. 1.6% MoM) both increased on the month versus expectations. Shelter (0.5% vs. 0.4%) increases accelerated, contributing over half of the monthly headline increase. Medical Care Services (0.7% MoM vs. 0.6% MoM) also accelerated due to Hospital Services (0.5% MoM vs. 0.1% MoM) and Health Insurance (1.1% MoM vs. 1.1% MoM) rising. Transportation Services (0.1% MoM vs. 1.1% MoM) changed little due to declines in motor vehicle maintenance, although motor vehicle insurance accelerated and airline fare costs increased after declines in the prior month. Finally, Recreational Services (1.1% MoM vs. 0.1% MoM) increased due to broad increases, while Educational Services (0.2% MoM vs. 0.1% MoM) rose slightly. The Supercore Services CPI subindex increased by 0.4% MoM, similar to last month, moving the annual rate to 3.9%.
Key Takeaways: Headline CPI came in slightly higher than expected with supercore services, the sub-cut the Fed has stressed, not materially improving. The fact that it has actually picked up in recent months after softer reading in the spring and early summer does not bode well for the Fed who wants to get inflation back to target in a timely manner. Effectively, the disinflationary process is losing steam. Shelter costs contributed over half the overall increase and accelerated slightly in December despite what was expected and seen in private surveys.The BLS’s methodology for shelter inflation tends to be seriously lagged, meaning it is likely overstating rental inflation. That’s important because CPI excluding shelter is back below 2%. The Cleveland Fed’s Median and Trimmed Mean CPI measures increased by 0.4% and 0.3% in December, the same rate as in November, moving the annual readings slightly lower to 5.1% and 3.9% (vs. 5.2% and 4% in the prior month). The Atlanta Fed’s Sticky-Price CPI increased by 4.6% on an annualized basis in December, rising from a 3.6% increase in November. The Flexible Cut of the CPI (a weighted basket of items that change price relatively frequently) increased 3.3% on an annualized basis in December, rising to 0.4% on a year-over-year basis. These separate measures confirm that the disinflation process is having trouble with the last mile (3% to 2%). As a result, the December CPI report was a disappointment but not a game changer for the Fed, confirming that the “last mile” will take some time and that patience is required. Pimco’s economist Tiffany Wilding summed it up well when she said, “The deflationary impulse from normalizing supply chains is a tailwind that will eventually fade. Shelter inflation continues to slowly cool, and services ex-shelter inflation remains sticky — supported by still-elevated wage growth. We think this backdrop is likely to mean that disinflation, which was incredibly fast by historical standards in 2023, could be slower and more complicated in 2024.”

*Headline CPI is increasingly moving sideways, with shelter and core services remaining sticky

*3mo and 6mo annualized rates are increasingly showing reduced progress, especially for core

*Monthly increases in supercore CPI have been gravitating around 0.4%

*Shelter remains the primary reason CPI is not closer to the Fed’s target

*Disinflationary progress slowed in the Cleveland Fed’s Median and Trimmed-Mean measures

*The Atlanta Fed’s Sticky and Flexible CPI measures firmed slightly

*The number of sub-components rising at a greater than 0.2% MoM rate increased in December’s report
Producer prices declined by -0.1% in December, the same as in November, and compared to forecasts of a 0.1% rise. The annual headline PPI rate increased to 1% from 0.8% in November. Core PPI was unchanged, moving the annual rate to 1.8% from 2%, the same as last month, while PPI excluding Food, Energy, and Trade increased by 0.2% MoM, a slight increase from the 0.1% increase in November, increasing the year-on-year rate to 2.5% from 2.4%. Final demand for goods declined by -0.4% MoM (vs. -0.3% in Nov), with nearly 60% of the decline coming from a -1.2% MoM (vs. -2.4% MoM) decline in energy. Final Demand for Food declined -0.9% MoM (vs. 0.7% MoM), while prices for final demand goods less foods and energy were unchanged (vs. 0.1% MoM). Final Demand for Services was unchanged on the month, the same as in November. Trade service prices declined by -0.8% MoM (vs. -0.1%), while Transportation and Warehousing costs fell by -0.4% MoM (vs. -0.2% MoM). Other Services rose 0.4% MoM (vs. 0.1%). Intermediate Demand for Processed Goods declined by -0.6% MoM (vs. -0.4% MoM), while Unprocessed Goods declined by -4.4% MoM (vs. -2.4% MoM). There were large declines in energy goods for both, while unprocessed food-stuff and feed-stuff declined by a greater percentage. The cost of Services for Intermediate Demand increased by 0.4% MoM (vs. 0.3% MoM), with all categories (Trade, Warehousing and Transportation, and Other) positive, increasing the annual rate to 3.4% from 3% in November.
Key Takeaways: At the headline level, December’s PPI report is supportive that disinflationary progress continues for the Fed. Final demand for goods dropped for a third consecutive month, mainly due to a -12.4% fall in prices for diesel fuel, while gasoline prices were up 2.1%. Most of the December decrease in processed goods for intermediate demand can also be attributed to the decline in diesel fuel, too. Further, over 80% of the decrease in unprocessed goods for intermediate demand can be attributed to a -13.2% decline in the price of crude oil. Meanwhile, prices for services were unchanged, the same as in the previous two months. However, when excluding trade services, the annual rate increased to 2.9%, and when excluding distributive services, the annual rate was 3.6%. This indicates that there is still some stickiness in other final demand services prices. Further, with international shipping costs rising, it's possible that some logistical cost firmness may occur, especially if firms replenish low inventory stocks more aggressively than expected. All in all, recent stabilization in energy prices (due to geopolitical risks) and greater inventory restocking pressures may see recent PPI weakness reverse. Regarding the PPI inputs into PCE, it is clear that changes in core PCE in December will be weaker than core CPI, with sell-side research estimating core PCE will rise 0.2% MoM due to what core PPI final demand personal consumption indicates.

*Disinflationary progress in PPI has slowed, with comparables now getting harder, limiting the downside to annual readings

*Core and headline have seen muted monthly changes as falling energy costs balance sticker service prices

*PPI is indicating that December’s change in core PCE will be weaker than core CPI
The NFIB Small Business Optimism Index increased to 91.9 in December, the highest in five months, compared to 90.6 in November and beating forecasts of 90.7. Twenty-three percent of small business owners reported that inflation was their single most important problem in operating their business, up one point from last month, and replacing labor quality as the top concern.
Sales and Earnings: -11% of owners reported higher sales in the past three months, a 6-point improvement from November. -4% expect higher sales, an improvement of 4 points. -2% of owners reported increased inventories, an improvement of 1 point. -5% of owners viewed current inventory stocks as “too low” in December, down 5 points. -5% of owners plan inventory investment in the coming months, down 2 points. -25% of owners reported positive profit trends, 7 points higher than in November. Among owners reporting lower profits, 31% blamed weaker sales, 17% blamed the rise in the cost of materials, and 16% cited lower prices. For owners reporting higher profits, 48% credited sales volumes, 19% cited usual seasonal change, and 14% cited higher selling prices.

Inflation: 25% of owners raised selling prices, unchanged from November. Unadjusted, 15% (up 1 point) reported lower average selling prices, and 36% (unchanged) reported higher average prices. Price hikes were most frequent in finance, retail, construction, and services. Seasonally adjusted, 32% plan price hikes, down 2 points.

Labor Markets and Compensation: 40% of owners reported job openings they could not fill, unchanged from last month. 49% (89% of those hiring or trying to hire) of owners reported few or no qualified applicants for the positions they were trying to fill. The difficulty in filling open positions is particularly acute in the construction and transportation sectors. 55% reported hiring or trying to hire in December, up 1 point from November. 16% of owners plan to create new openings in the next three months, down slightly. 36% of owners reported raising compensation, unchanged from November, while 29% plan to raise compensation in the next three months, an increase of 1 point.

Capital Spending and Credit: 58% of owners reported capital outlays in the last six months, down 3 points from November. Of those making expenditures, 40% reported spending on new equipment (down 1 point), 22% acquired new vehicles (down 1 point), and 19% improved or expanded facilities (up 2 points). 24% percent plan capital outlays in the next few months, up 1 point. 3% of owners reported all borrowing needs unsatisfied (down 1 point), while 25% reported all credit needs met (unchanged), and 61% said they were not interested in a loan (down 2 points).

Key Takeaways: The headline optimism index was driven higher by improved readings for expected sales, earnings trends, and general expectations for the economy to improve. Hiring plans and inventory sentiment became more negative, while capex activity and credit conditions were slightly better. Despite better expectations for sales, the net percentage of owners raising their average selling prices was unchanged. Inflation (23) replaced a lack of qualified labor to hire (20) as small business owners’ top concern, followed by taxes (17). The uncertainty index retraced half of its dramatic drop in November but still looks to be trending lower. The commentary in the report was still very negative. NFIB Chief Economist Bill Dunkelberg said, “Small business owners remain very pessimistic about economic prospects this year.”

*The headling NFIB Small Business Optimism Index continues to be rangebound, in a pre-pandemic Democrat Administration historical range

*Soft indicators continue to be notably lower than hard, although December saw an uptick and closing of the spread

*The Uncertainty Index retraced almost half of its November decline
Technicals, Positioning, and Charts:
The Nasdaq outperformed the S&P and Russell on the week. Technology, Communication, and Consumer Discretionary were the best-performing sectors, while Momentum, Growth, and Low Volatility were the best-performing factors. Large-cap Growth was the best-performing size/value combo of the week.

@Koyfin
S&P optionality strike levels have the Zero-Gamma Level at 4752 while the Call Wall is 4800 and the Put Wall is 4600. January’s OPEX is setting up to be a major event, with the expiration of large long call positions likely pulling the market lower by mid to late January. Implied volatility remains muted despite recent equity market weakness, with a surge in demand for long volatility (i.e. put buying) as a potential driver of equity weakness moving forward. Until then, the S&P remains in a 4,770 - 4,800 zone, one it has been unable to break above or fall too far from for nearly a month, and the large positive gamma in the strike zone supports this mean-reverting action we've seen.

@spotgamma
S&P technical levels have support at 4808, then 4780, with resistance at 4820, then 4835. “Buy the Dip” has been the theme of the week in ES, and CPI didn’t disrupt that. /ES has been constructing a perfect flag pattern with low 4700s support and 4835 resistance.

@AdamMancini4
Treasuries are mixed on the day, with the 10-yr yield a little changed at 3.96%, while the 5s30s curve is steeper by 5.5 bps on the session, moving to 35 bps.

Four Key Macro House Charts:

Growth/Value Ratio: Growth is higher on the week, with Large-Cap Growth the best-performing size/factor on the week.

Chinese Iron Ore Future Price: Iron Ore futures are lower on the week.

5yr-30yr Treasury Spread: The curve is notably steeper on the week.

EUR/JPY FX Cross: The Euro is stronger on the week.
Other Charts:

"Global Equity Risk-Love, our contrarian sentiment indicator for equities, has moved from near-panic (25th percentile) in October to euphoria now." – BofA

Nasdaq CFTC net speculative positioning at all-time highs."

Projections for earnings growth among S&P 500 companies are increasingly positive moving forward.

The CBOE VVIX index (vol of vol) has been tumbling, reflecting falling demand for VIX call options.

In an average year, the S&P sees at least seven separate dips of at least 3%, three separate pullbacks of at least 5%, and one correction of at least 10%. - Carson Group’s Ryan Detrick

Going back to 1980, the chart shows each year’s annual return for the S&P 500 in gray and its intra-year max drawdown (i.e., the biggest sell-off from its high of the year) in red. During this period, the S&P has seen an average annual max drawdown of 14% while ending positive in 33 of the 44 years measured. This means that in most years, the market has more than recovered the losses experienced in the max drawdown. – Sam Ro

The correlation between bonds and equities has been very strong since August.

Investment-grade bond issuance surged at the start of the year.

“Total card spending per HH was up 1.0% y/y in the week ending Dec 30, according to BAC aggregated credit and debit card data. Spending on holiday items fell 1.3% y/y in the week ending Dec 30. ... However, in the five weeks since Thanksgiving, spending on holiday items was up 0.3% compared to the same period last year.” - BofA

“Americans generated ~$300 billion in interest income from money-market funds in 2023, according to estimates from Crane Data.“ - WSJ’s Gunjan Banerji

The Apartment List National Rent Report showed that the rental market ended 2023 with a fifth straight month of negative rent growth nationwide, with median rent falling by 0.8% in December.

Expectations for U.S. growth in 2024 have been rising, while EZ and China have been declining and flat.
VIEWS EXPRESSED IN “CONTENT” ON THIS WEBSITE OR POSTED IN SOCIAL MEDIA AND OTHER PLATFORMS (COLLECTIVELY, “CONTENT DISTRIBUTION OUTLETS”) ARE MY OWN. THE POSTS ARE NOT DIRECTED TO ANY INVESTORS OR POTENTIAL INVESTORS AND DO NOT CONSTITUTE AN OFFER TO SELL -- OR A SOLICITATION OF AN OFFER TO BUY -- ANY SECURITIES AND MAY NOT BE USED OR RELIED UPON IN EVALUATING THE MERITS OF ANY INVESTMENT. THE CONTENT SHOULD NOT BE CONSTRUED AS OR RELIED UPON IN ANY MANNER AS INVESTMENT, LEGAL, TAX, OR OTHER ADVICE. YOU SHOULD CONSULT YOUR OWN ADVISERS AS TO LEGAL, BUSINESS, TAX, AND OTHER RELATED MATTERS CONCERNING ANY INVESTMENT. ANY PROJECTIONS, ESTIMATES, FORECASTS, TARGETS, PROSPECTS AND/OR OPINIONS EXPRESSED IN THESE MATERIALS ARE SUBJECT TO CHANGE WITHOUT NOTICE AND MAY DIFFER OR BE CONTRARY TO OPINIONS EXPRESSED BY OTHERS. ANY CHARTS PROVIDED HERE ARE FOR INFORMATIONAL PURPOSES ONLY, AND SHOULD NOT BE RELIED UPON WHEN MAKING ANY INVESTMENT DECISION. CERTAIN INFORMATION CONTAINED IN HERE HAS BEEN OBTAINED FROM THIRD-PARTY SOURCES. WHILE TAKEN FROM SOURCES BELIEVED TO BE RELIABLE, I HAVE NOT INDEPENDENTLY VERIFIED SUCH INFORMATION AND MAKE NO REPRESENTATIONS ABOUT THE ENDURING ACCURACY OF THE INFORMATION. I MAY OR MAY NOT HAVE POSITIONS IN ANY STOCKS OR ASSET CLASSES MENTIONED. I HAVE NO AFFILIATION WITH ANY OF THE COMPANIES OTHER THAN EXPLICITLY MENTIONED.