


Powell Flips the Script Despite Stronger Data and High Disinflation Uncertainty - Midday Macro – 12/15/2023
Color on Markets, Economy, Policy, and Geopolitics

Powell Flips the Script Despite Stronger Data and High Disinflation Uncertainty
Midday Macro – 12/15/2023
Market’s Weekly Narrative and Headlines:
Equities are ending the week up notably despite some weakness today on a historically large OPEX Friday. Powell and company managed to surprise markets with what is being viewed as a significant dovish pivot. December’s new economic projections added a rate cut next year despite little expected progress on inflation or additional weakness in the economy. Powell’s press conference demeanor and comments also indicated Fed officials are seeing enough progress in cooling the economy and bringing inflation down that they are starting to discuss rate cuts. This somewhat abrupt change of tune caught markets a little off guard but furthered the already existing higher stocks/lower yield price action that has been dominant since late October. In a slight reversal, both NY Fed President Williams and Atlanta Fed President Williams pushed back on discussions about rate cuts today. Perplexingly, in our opinion, this week's inflation data showed less progress than would be indicated by Powell’s FOMC remarks. Although headline CPI readings were flat due to declines in energy and goods prices, core-service costs reaccelerated. PPI did come in weaker and was noted as affecting the FOMC outlook, but it is also heavily influenced by energy price declines while showing less progress in its core readings. Import prices, excluding energy rose notably in November. In totality, the progress on inflation was more mixed in November, energy-driven, and not broader than in past months. However, markets saw what they wanted in many ways. Turning to the rest of the new economic data on the week, the NFIB small-business optimism index fell for a fourth month, while manufacturing activity was flat in November, excluding the resumption of auto production. S&P PMIs showed manufacturing contracting further while the service sector expanded at a stronger pace. The New York Fed’s Empire State manufacturing survey came in much weaker than expected, although respondent outlooks improved.

In rounding out market price action, Treasuries, akin to stocks, rallied on the week, with the 10yr Treasury yield now well below 4%. Credit spreads also tightened notably following the FOMC meeting. The dollar took it hardest in many ways, and more hawkish posturing from the ECB, BOE, and other central banks added to the pain over the rest of the week. The $DXY touched below 102, but is recovering today on the more hawkish comments. Turning to commodities, oil had another volatile week, touching on new recent lows around $68 earlier in the week but rallying off the weaker dollar and an upgrade in demand expectations from the IEA. Copper rallied further this week despite the Central Economic Work Conference in China prioritizing critical tech innovation and dual circulation policy goals over outright growth and property market stabilization. Iron ore is also higher there, indicating growth expectations are stabilizing despite cooler consumption and investment data for November than expected. The agg complex was a little changed during the week.


Deeper Dive:
It looks like we got it backward. It was the ECB and BoE’s turn to be hawkish, while the Fed did a dovish pivot. This was surprising as just two weeks ago, Powell stressed that he was unclear if policy was restrictive enough and the FOMC was not close to talking about rate cuts. Other Fed policymakers were more mixed, but overall, the message was that patience was still needed as the job was not yet done. However, that all changed this week with December’s new SEPs notably more dovish and a confident Powell talking about greater progress than expected during his press conference. As we wrote last week, we expected a more neutral to hawkish tone, pushing back on March cuts, and like many others, we are struggling to reconcile the abrupt dovish “pivot” to any changes in the data over the last two weeks, much of which came in stronger than expected at the headline level. Add in November’s better-than-expected retail sales report that effectively doubled projected Q4 GDP growth and an Atlanta Fed wage tracker index that moved sideways, and it is hard to see this “substantial” slowing in growth Powell noted in his prepared remarks. This clearly now skews market reaction functions as the Fed seems increasingly detached from reality. Perhaps “supercore” CPI or average hourly earnings are not the most important drivers of Fed policy, given the focus on trending core-services ex-shelter inflation lower is wavering. In general, this unexplained dovish pivot now adds uncertainty to what the Fed is focused on. This is, of course, on top of the already high level of uncertainty over where economic activity and inflation are heading. It is increasingly looking like the next few months will have higher-than-anticipated volatility, given that markets are now seemingly pricing in an almost perfect scenario for risk assets given still positive growth and continued looser financial conditions.

*The market is now pricing in six rate cuts for next year, expected to start in March

*Q3 GDP growth expectations notably jumped on better retail sales in November

*Core services reaccelerated to 0.5% MoM in November, with supercore up 0.4% MoM

*Wage growth is still too high and will continue to pressure service prices higher
We want to apologize to our readers as not only have we missed the entire year-end rally after entering our long small caps and S&P positions too early in October and subsequently being stopped out too quickly, but we now missed a further opportunity to produce alpha by misreading the Fed’s communications going into the December FOMC meeting. We still believe the Fed will need to walk this dovish pivot back, something already seen by NY Fed President Williams and Atlanta Fed President Bostic today, and keep financial conditions from over-loosening. Powell indicated that he believes actual policy actions would lead financial conditions here, and they were not specifically targeting any level, but in reality, we still expect a more hawkish forward guidance approach to keep markets from getting too far ahead of projected rate cuts. Of course, Fed projections have been particularly bad during this cycle, giving them less credibility and also meaning the delta between what they communicate and what markets are pricing can be larger than normal. However, this does not bode well for rates and equities at current levels, all else equal. As a result, we are adding a short Russell index position through the $IWM to our mock portfolio. Given the massive rally since late October, the large size of call options rolling off in today’s OPEX, and our belief the Fed will talk back some of the easing priced into markets, on top of our view growth is cooling, we see this as a good way to enhance our short U.S. equities position.

*Financial conditions continue to loosen, offsetting tighter credit conditions?

*Looser financial conditions will support service sector activity, keeping disinflationary gains there limited, forcing the Fed to reassess whether they should be talking more dovishly

*We moved lower our dollar stop and added a 10% small cap short position but have left the rest of the portfolio alone
We will conclude by restating that we see economic activity as slowing, but not in a way that is reducing wage growth to a non-inflation-accelerating level yet. We still believe the full effects of tighter Fed policy, let alone tighter global policy, have only begun to hit the broader economy, with business investment increasingly slowing and the consumer likely to follow next. There have already been rolling recessions in parts of the economy, especially in manufacturing and more interest rate-sensitive areas like housing. But overall, the consumer, which drives the economy, continues to show too little price sensitivity in making purchase decisions for a mission-accomplished posture by the Fed. As a result, we maintain our more defensive posture, believing we are near the end of the current rally for both rates and equities. We do not see inflation as beat even with continued supply-side improvements and better supply and demand balances. We will increasingly enter a period where firms choose to cut prices to gain market share. Still, consumer's current rising real disposable income allows persistent pricing power by most firms, especially in discretionary services, that will limit further disinflationary gains. As labor markets contract next year, this will change, but until that is fully seen, the Fed will face persistent core service inflation ex-shelter above a level consistent with their 2% target, delaying their ability to enact the level of rate cuts expected by markets in the next few quarters. Markets will have to eventually shift from this “Fed policy easing rally of all things” narrative to a more realistic “slower growth and Fed that is not as dovish as we thought” one. As a result, despite blowing this week's FOMC meeting call, we maintain our current mock portfolio positions. We were unable to do a deeper dive into Japan today due to a busy week of client needs and general market monitoring and trading. We also still owe a further dive into oil markets. Thank you for being so patient, and we hope to cover those both next week before taking a two-week break.

*The proxy Fed funds rate is much higher than the official one, and the lagged effects of tighter policy are hitting in a rolling and uncertain manner

*We are increasingly seeing expected pricing power increase in business surveys

*Consumer confidence is improving, but it has been uncorrelated to actual spending, and loosening in labor markets may weigh more heavily on consumer activity moving forward

*Business investment is trending lower as greater uncertainty over future demand and higher financing costs weigh on activity
As always, thank you for reading, and please share our newsletter. Please feel free to reach out with any questions or comments. – Michael Ball, CFA, FRM
Policy Talk:
The Federal Reserve decided to maintain the target Fed funds range at 5.25% to 5.5% and continue reducing its holdings of Treasuries and AMBS at their December FOMC meeting. There were no dissenters. The official statement which accompanies every meeting was little changed. It noted that economic activity had slowed from a strong Q3 pace, job gains were moderating, and inflation had eased but remained elevated. Tighter financial and credit conditions were expected to weigh on economic activity and inflation, but “the extent of these effects remains uncertain.” The new December Summary of Economic Projections showed Fed officials expect to lower rates by 75 basis points next year, a sharper pace of cuts than indicated in September, moving the median expectation for the federal funds rate at the end of 2024 to 4.6%, although individuals policymaker expectations varied widely. The new SEPS showed a higher forecasted GDP rate for 2023 (2.6% vs. 2.1%) but a slightly lower one for 2024 (1.4% vs. 1.5%), with little changes after. Projections for UER were unchanged. Headline and Core PCE were lowered significantly for 2023 (2.8% vs. 3.3% PCE and 3.2% vs. 3.7% Core), while 2024 and 2025 declined slightly. This was a notably more dovish shift in the “dots” as the lowering of inflation or growth expectations can not entirely explain the additional projected 25bp cut. Nor was there a greater level of slack projected in the economy as the level of expected unemployment did not rise, and the long-run “natural” unemployment rate rose.
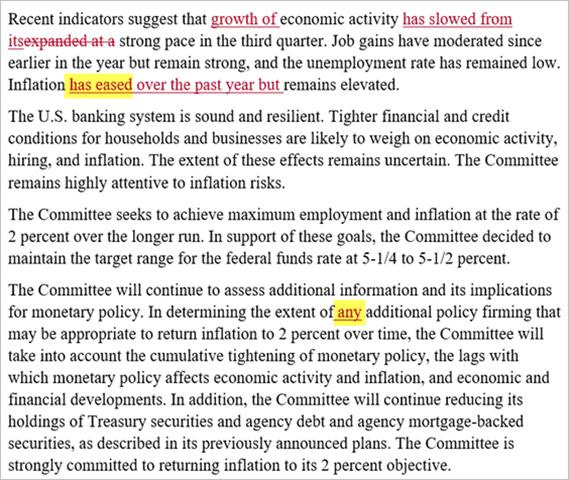
*There were little changes to the statement, although markets focused on the addition of “any”

*There is generally a wide dispersion in the dots for Fed funds projections
Powell gave a more upbeat assessment during his press conference. He highlighted that the progress on inflation so far had come without a significant increase in unemployment but warned that the movement of policy into the restrictive territory has not yet been fully felt. He noted that recent economic activity has slowed “substantially.” He sees higher interest rates as increasingly weighing on housing and business investment. He stressed that the labor market remained tight but continued to come into better balance, highlighting the increase in labor participation and normalization of immigration. Further, slowing nominal wage growth and lower job vacancies meant this loosening of labor markets would continue. Moving on to inflation, Powell said recent progress was welcome, but the Fed still needed to see further evidence and believed that the process of getting inflation back to target would still take some time. He noted the Fed believes that its policy rate is likely at or near its peak, but the “surprising” nature of the economy makes that uncertain. Powell concluded his prepared remarks by saying, “In light of the uncertainties and risks and how far we have come, the Committee is proceeding carefully. We will continue to make our decisions meeting by meeting, based on the totality of incoming data and their implications for the outlook for economic activity and inflation as well as the balance of risks.” When asked about financial conditions easing, Powell did not push back, simply saying they would follow policy, not lead it in the long run. He also noted the surprising degree of supply-side improvement, which he saw as contributing to the better-than-expected growth and better progress on inflation. When asked to access the current state of the labor market, he saw things at more normal levels but wage growth at a level still above what would be consistent with the Fed’s 2% target.
“We are seeing, you know, strong growth that appears to be moderating, We're seeing a labor market that is coming back into balance by so many measures, and we're seeing inflation making real progress. These are the things we've been wanting to see. We can't know -- we still have a ways to go. No one is declaring victory.”
“I think it's really good to see the progress that we're making. I think if you look at the 12-month -- look at the six-month measures, you see very low numbers. If you look at 12-month measures, you're still well above 2 percent. You're actually above 3 percent on core through November PCE. That isn't to say, I'm not, you know, calling into question the progress. It's great. We just need to see more.”
“You know, we're obviously looking hard at what's happening with demand, and what we see, we see the same thing other people see, which is a strong economy, which really put up quite a performance in 2023. We see good evidence and good reason to believe that growth will come in lower next year… We'll also be looking to see progress on inflation, and you know, the labor market remaining strong, but ideally without seeing the kind of large increase in unemployment that happens sometimes.”
“We haven't typically tried to articulate, with one exception, really specific target levels, which was if you -- some of you will remember the thresholds that we used in, I guess, 2013. The answer is, these are things that we haven't, you know, really worked out yet. We're sort of just at the beginning of that discussion.”

*Expectations for inflation fell, growth rose, and UER was little changed

The New York Fed’s November Survey of Consumer Expectations showed that inflation expectations declined at the short-term horizon and remained unchanged at the medium and longer-term horizons. Labor market expectations were mixed, with less pessimism about unemployment, but expected earnings growth declined slightly, and the perceived probability of losing one’s job increased. Household finance perceptions and expectations were mostly unchanged in November, while credit access perceptions and expectations both improved slightly.

The Atlanta Fed's Wage Growth Tracker was 5.2% in November, unchanged from October. For job switchers, wages were up 5.7% from 5.6% in October. For job stayers, wages grew 4.6% from 4.8% in October.

U.S. Economic Data:
The Consumer Price Index increased by 0.1% in November, compared to expectations of a flat reading, and after being unchanged in October. The annual headline CPI rate moved slightly lower to 3.1% from 3.2% in October. Core CPI increased by 0.3% MoM, in line with expectations and slightly higher than the 0.2% MoM increase in the prior month. The annual core inflation rate remained at 4%. Food prices rose by 0.2% MoM (vs. 0.3% in Oct), with Food Away From Home rising by 0.4% MoM for the third month in a row, while Food at Home increased by 0.1% MoM (vs. 0.3%). Energy prices fell by -2.3% MoM (vs. -2.5%), driven lower by declines in gas (-6% MoM vs. -5 MoM) and fuel oils (-2.7% MoM vs. -0.8%), while energy services (1.7% vs. 0.5%) costs increased with rises in both electricity and utility gas services. Shelter costs reaccelerated to 0.4% MoM (vs. 0.3% MoM). Prices for core goods (-0.3% vs. -0.1%) declined at a slightly faster rate, driven lower by significant declines in the prices of apparel (-1.3% MoM vs. 0.1% MoM) and a continued slight decrease in new vehicles (-0.1% MoM). Used car and truck prices (1.6% MoM vs. -0.8%) increased after five months of declines. Prices for core services, less shelter or “supercore” rose by 0.4% MoM, moving the annual rate to 3.87%. There was an acceleration in the cost for transportation services (0.8% MoM vs. 0.7% MoM), with motor vehicle insurance again driving increases. Medical care services rose by 0.3% MoM for the third month in a row, driven higher by rises in the cost of hospital services. Costs were unchanged for education and communication services (0% MoM vs. 0.1% MoM), while recreation services (0.1% MoM) and other personal services (0.3% MoM) increased by the same monthly rate.
Key Takeaways: Headline CPI came in slightly higher than expected, while increases in the core rate were in line. However, the reacceleration in the Fed’s preferred supercore service index, mainly due to rises in the cost of auto insurance and hospital services, moved the three-month annualized rate to 5.8%, bringing into question how much disinflationary progress was really made in November. Further, owners' equivalent rent firmed up, causing shelter to come in stronger than last month and, although less important in the eyes of Fed officials due to the known lag effects, still contributed to the stronger-than-expected headline reading. There continues to be a tale of two cities, with core goods now deflationary, mainly due to declines in apprel goods, while core services prices are more sticky, mainly due to transportation and increasingly medical services. This is also seen in food and energy, with food at home (1.7% YoY) versus food away from home (5.3% YoY) and energy commodities (-9.8% YoY) versus energy services (-0.1% YoY) diverging further.

*The weaker reading in the headline CPI was again driven by energy and food, while service costs increased

*The annual rate for Core CPI was unchanged, while Headline CPI ticked slightly lower

*Progress was made at the six-month annualized rate, while the three-month annualized change moved sideways

*The Fed’s favorite measure of core services, ex-shelter, aka “supercore”, reaccelerated in November

*Shelter prices rose slightly on the month due to OER

*Median (0.4% MoM vs. 0.3% in Oct) and Trimmed-Mean (0.3% vs. 0.2%) picked up slightly, although annual changes continued to fall

*The Atlanta Fed’s Sticky-price and Flexible-cut CPI readings fell on the month
Producer prices were unchanged in November, following a -0.4% fall in October, and compared to forecasts of a 0.1% rise. The annual headline PPI rate fell to 0.9% from 1.2%. Core PPI rose by 0.1% MoM, the same as in October, moving the annual rate to 2% from 2.3%. Prices for both final demand goods and services were unchanged on the month . Within goods, gasoline cost fell the most (-4.1%) followed by other fuels and chemicals. In contrast, prices of food increased by 0.6% MoM (vs. -0.1% MoM in Oct) with chicken eggs jumping 58.8% followed by increaseso in fresh fruits and melons. Core final demand goods rose by 0.2% MoM (vs. 0%). Within final demand services, trade (-0.2% MoM), and transportation and warehousing (-0.5% MoM) declined, while other services (0.1% MoM) rose slightly. Intermediate demand for processed goods was flat (vs. -1% MoM), with energy goods (1% MoM) higher, while foods and feeds (-0.6% MoM) declined. Unprocessed goods declined by -1.4% MoM (vs. -1.8% MoM), with declines in both foodstuff and feedstuff (-1% MoM) and energy materials (-3.2% MoM). Core intermediate demand saw processed (-0.2% MoM) lower and unprocessed (0.7% MoM) higher. Services for intermediate demand rose 0.2% MoM, with trade (-0.1% MoM) and transportation and warehousing (-0.2% MoM) slightly lower, and other services rose by 0.4% MoM.
Key Takeaways: PPI continues to exhibit consistent disinflationary trends, with broader declines this month due to trade and transportation and warehousing falling by the largest combined amount since April. Decreases in energy-related products weighed across the report, with unprocessed energy materials declining notably due to a -9.5 % decrease in crude oil. Interestingly, prices for final demand foods increased while processed and unporccess food readings declined. Despite this divergence, the final demand for food components is now lower by -4.9% annually, the largest annual drop since December 2015. Given some persistence in core readings outside energy and food, we saw this report as neutral for the Fed. While falling trade margins show reduced pricing power, lower capacity utilization, and tighter inventories reduce transportation and warehousing needs, the report shows a cooling in demand. However, much of this report reflects lower energy costs, and we are dubious that those can continue at the current pace.

*Declines in energy and food weighed on headline PPI again, with core components more stable

*PPI continues to indicate disinflationary pressures are building in the pipeline
Import prices declined by -0.4% in November, following a downwardly revised -0.6% rise in October, compared with market forecasts of a -0.8% MoM decrease. The annual change in import prices moved to -1.4%. Fuel import prices declined by -5.6% MoM, with petroleum prices declining by -7.1% in November, the most since August 2022, after decreasing by -3.8% the previous month. In contrast, natural gas prices rose 38.3% in November, the largest increase since December 2022, following a -2.7% decline in October. The cost of nonfuel imports increased by 0.2% MoM, after five consecutive months of declines. Export prices declined by -0.9% in November, the same as a downwardly revised -0.9 percent decline in October and below market expectations of a -1% MoM decrease. Export prices have declined by -5.2% on an annual basis. Prices for nonagricultural exports declined by -1% for the second consecutive month, as lower prices for nonagricultural industrial supplies & materials, capital goods, consumer goods, and automotive vehicles more than offset higher nonagricultural food prices. Prices for agricultural exports increased by 0.2% MoM as higher fruit & soybeans prices more than offset lower prices for corn, meat, and other foods.
Key Takeaways: Import price declines were driven lower by a drop in fuel costs, with lower oil prices offsetting rises in natural gas. Excluding fuels, prices were slightly higher due to increases in foods, feeds, and beverage prices and, to a lesser extent, nonfuel industrial supplies. Import prices for finished goods changed little, with autos slightly lower, while capital and consumer goods were unchanged. Conversely, lower prices for nonagricultural exports offset higher agricultural prices. Consumer goods export prices fell for a second month, while auto export prices declined for the first time since April.

*Deflationary progress has stalled in import prices due to tougher comparables

*Export price declines have accelerated with two strong deflationary months in a row
Retail sales increased by 0.3% in November, rebounding from an upwardly revised -0.2% decline in October and beating market forecasts of a -0.1% decline. Excluding autos, gas, building materials, and food services, retail sales increased by 0.4% MoM. The largest increase in sales by percentage came from sales at food services and drinking places (1.6%), nonstore retailers (1%), health and personal care (0.9%), and furniture stores (0.9%). To a lesser extent, sales were also up at clothing stores (0.6%), motor vehicles and part dealers (0.5%), and food and beverages stores (0.2%). In contrast, sales at gasoline stations declined by -2.9% MoM due to notable gas price declines. Sales were also lower at miscellaneous store retailers (-2%), electronics & appliance stores (-1.1%), building material & garden equipment & supplies dealers (-0.4%), and general merchandise stores (-0.2%).
Key Takeaways: The November report suggests a strong start to the holiday shopping season. Eight out of the thirteen categories increased, with restaurants and bars, the only service sector, seeing the largest increase. Food away from home prices also reaccelerated in the November CPI report. Retail sales excluding autos, building materials, and gasoline, the component of this report that feeds into the calculation of non-auto consumer goods spending within GDP, was also stronger-than-expected and, in combination with other stronger data on the week, has moved up the AtlantaFed GDPNow to 2.6% for Q4. However, these core sales for both September and October were revised lower. The retail sales report certainly indicates that the consumer remains resilient, especially in the service sector. It also brings into question what cooling in the totality of the data Powell stressed in his presser following a stronger headline NFP report, expanding ISM Services PMI, and increase in Univ of Michigan consumer confidence.

*Retail sales surprised to the upside following a weaker October reading

*8 of the 13 categories increased on the month, with core retail rising by 0.4% MoM

*With inflation falling, real retail sales are more notably trending higher
Industrial production increased by 0.2% in November, following an upwardly revised -0.9% decline from October and slightly below market expectations of a 0.3% increase. Manufacturing output, which accounts for 78% of total production, rose by 0.3% MoM, also marginally missing market expectations of 0.4% MoM, following a revised -0.8% contraction seen in the previous month. The increase was driven by a 7.5% rebound in output from the automotive industry. Manufacturing production declined by -0.2% when excluding automobiles and parts. From the previous year, manufacturing output is lower by -0.8%. Final products rose by 0.3% MoM, with consumer goods (0.1% MoM) and business equipment (0.9% MoM) both rising. Mining rose by 0.3% MoM, rebounding from a -1.1% decline in the prior month, while Utilities (-0.4% MoM vs. -1.4% MoM) declined for a third month. Capacity utilization slightly increased to 78.8% in November from a downwardly revised 78.7% in October and below forecasts of 79.1%.
Key Takeaways: Industrial production would have been negative on the month without autos, with durable consumer goods rebounding 3.5% after a -5.4% decline last month. This also supported business equipment production, which saw a rebound in transit equipment. Defense and space equipment are having a great year, higher by 11.1%, due to the continued demand from foreign wars and heightened geopolitical risks. However, this is secondary to home electronics (14% YoY) for the best-performing sub-sector in the final products group. On the other side, clothing is lower by -14.5% on the year. Interestingly, despite the stronger growth on the year, production of consumer goods and business equipment is both lower by -1.6% YoY and -1.5% YoY, respectively.

*Returning auto production helped the headline industrial production and manufacturing increase on the month

*Consumer goods and business equipment are lower on an annual basis. However, defense production is trending much higher
The NFIB Small Business Optimism Index declined to 90.6 in November, compared to 90.7 in October and forecasts of it being unchanged. 24% of owners cited difficulty finding qualified workers as their single most important problem, up 1 point, while 22% cited inflation.
Revenue/Profits: -32% of owners reported positive profit trends, unchanged from October. Among owners reporting lower profits, 36% blamed weaker sales, 16% blamed the rise in the cost of materials, and 14% cited labor costs. For owners reporting higher profits, 60% credited higher sales volumes, and 14% cited higher selling prices. Overall, -17% of firms reported higher nominal sales in the past three months, unchanged from October. -3% (up 2 points) of owners expect higher sales.

Inventories: -3% (up 3 points) of owners reported increasing their inventory. 14% reported increases in stocks (up 3 points), and 16% reported reductions (unchanged). 0% (up 3 points) of owners viewed current inventory stocks as “too low” in November. By industry, shortages are reported most frequently in the retail (14%), finance (13%), and services (10%) sectors. -3% (down 3 points) of owners plan inventory investments in the coming months.

Labor: Overall, 54% (down 7 points) of owners reported trying to hire in November. 44% (down 3 points) of owners reported job openings they could not fill, largely in skilled worker openings. The difficulty in filling open positions is particularly acute in the construction, manufacturing, and transportation sectors. 18% (up 1 point) of owners plan to fill open positions in the next three months. 36% of owners reported raising compensation, unchanged from the prior month, while 30% (up 6 points) plan to raise compensation in the next three months.

Capital Spending and Credit: 61% (up 4 points) of owners reported capital outlays over the last three months. Of those making expenditures, 41% reported spending on new equipment (up 4 points), 23% acquired new vehicles (down 1 point), 17% improved or expanded facilities (down 1 point), and 6% acquired new buildings or land for expansion (down 1 point). 23% (SA) plan capital outlays in the next few months, down 1 point from October. 2% of owners reported all their borrowing needs were not satisfied (unchanged), with 63% indicating no interest in a loan (down 1 point). 31% of all owners reported borrowing on a regular basis (up 4 points), with 8% indicating their last loan was harder to get (up 1 point), and 25% reported paying a higher interest rate on their most recent loans (down 3 points). The average rate paid on short-maturity loans was 9.3%, up 0.2 percentage points from last month.

Prices: 25% (down 5 points) of owners reported rising their average selling prices. Unadjusted, 14% (up 3 points) reported lower average selling prices and 36% (down 3 points) reported higher average prices. Price hikes were most frequent in finance, retail, and construction. Seasonally adjusted, a net 34% plan price hikes (up 1 point).

Key Takeaways: The headline NFIB report moved sideways in November, little changed with declines in plans to increase inventories and current job openings offset by increases in current inventory and higher expected sales levels, although the last remained negative. A net -42% of small business owner respondents expect the economy to improve, little changed from last month and still historically very negative. However, 8% view now as a good time to expand, increasing from the prior month despite lower plans to increase inventory and views credit conditions have worsened. Further, more businesses are using credit and they found it harder and more costly to obtain it than last month. Actual reported capital expenditures over the last three months rose on the month. However, NFIB comments noted that in the “longer term, the worker shortage has given firms an incentive to invest in labor-saving technology. But, overall, capital spending is not strong historically.” Despite this juxtaposition of readings, overall uncertainty fell notably. Inflationary pressure picked up, with pricing plans rising and expected compensation increasing as labor shortages remain problematic. “Small businesses didn’t experience the surge in spending, and the percent who raised prices fell 5 points to 25% of all firms, down from over 60% when inflation started,” the commentary said. There was pushback on recent job gains seen in the jobs report, given what small-business owners have been reporting since spring. “The net percent of NFIB firms increasing employment has been negative since March, with more firms decreasing jobs than adding them. The percentage of owners reporting unfilled job openings has declined from 51% (in 2020) to 40% in November, a shift in the labor market now reflected in the JOLTS report. So, openings remain elevated, but the surge in the economy did not bring a strong wave of workers to fill open positions.” Further, comments went on to highlight how strong growth in Q3 GDP should have been accompanied by higher small business sales volumes and earning trends. Commentary said that “hopefully that will improve for December! But that’s not “5%” growth. There was a significant increase in “inventory investment,” a result of making stuff and paying workers but not selling the product to a final user (consumer or business). Visually, a parking lot full of unsold electric vehicles, a drag on Q4 growth most likely.”


*The overall Optimism Index has moved sideways for some time, with weaker sales and earnings weighing on better labor and capex readings

*The uncertainty index took a notable drop this month
The NY Empire State Manufacturing Index declined to -14.5 in December from 9.1 in November and forecasts of 2. Demand and activity measures contracted on the month, with New Orders (-11.3 vs. -4.9), Unfilled Orders (-24 vs. -23.2), and Shipments (-6.4 vs. 10) all declining, and now all contracting. Delivery Times (-15.6 vs. -6.1) shortened further, and Inventories (-5.2 vs. 9.1) contracted notably. Employment (-8.4 vs. -4.5) contracted at a faster rate. However, the Average Workweek (-2.4 vs. -3.8) contraction rate slowed. Inflationary readings were mixed with Prices Paid (16.7 vs. 22.2) increases moderating, while the Prices Received (11.5 vs 11.1) were little changed. On the other hand, forward-looking indicators were much more positive, with the Expected Six Month Ahead General Business Conditions (12.1 vs. -0.9) moving strongly back into expansionary territory thanks to broad increases in sub-index readings outside of hiring and average workweek. Capital expenditure plans also expanded after falling recently, especially for technology spending.
Key Takeaways: There was a broad decline in the November Empire Survey readings for current conditions. In general, the headline index has been range-bound this year, and we are now in the middle of that range. There was a notable tick lower in shipments, and when coupled with delivery times shortening at the fastest pace since well before the pandemic and contracting inventory levels, firms' activity slowed rapidly. Time will tell whether this is due to seasonal factors and reduced inventory stock due to weaker demand expectations for this holiday season or something indicating a greater cyclical downturn. The improvement in the forward readings indicates that firms see the current weaker period as temporary. The uptick in capex also supports this view. Declines in price expectations and hiring intentions also bode well for the Fed.

*Demand and activity measures notably contracted, but the majority of subindex readings were lower

*Price measures continue to indicate improving supply-side dynamics while end consumers are less price-sensitive
Associated Builders and Contractor’s Construction Backlog Indicator increased slightly to 8.5 months in November from 8.4 months in October. ABC’s Construction Confidence Index readings for sales and staffing levels increased in November, while the reading for profit margins fell. All three readings remain above the threshold of 50, indicating expectations for growth over the next six months.
Key Takeaway: Despite the slight increase, the month of backlogs is currently 0.8 months lower than the summer's cyclical peak. The sharpest declines are among larger contractors (more than $100 million in annual revenues), who collectively reported fewer than ten months of backlogs in November for the first time since the second quarter of 2018. “A growing number of contractors are reporting declines in backlogs,” said ABC Chief Economist Anirban Basu. “The interest rate hikes implemented by the Federal Reserve appear to be making more of a mark on the economy. Not only has the cost of capital risen over the past 20+ months, but credit conditions are also tightening, rendering project financing even more challenging.” Basu went on to say that 2024 will be weaker from a construction demand perspective for many firms “especially those that depend heavily on private developers. Those operating in public construction and/or industrial segments should meet with less resistance on average.”

*Profit margins continue to trend lower while sales and staffing rose on the month
Technicals, Positioning, and Charts:
The Russell outperformed the Nasdaq and S&P on the week, with historic weekly gains for the first and notable gains for the others. Consumer Discretionary, Communication, and Technology were the best-performing sectors, while Small-Caps, High Dividend Yield, and Value were the best-performing factors. Small-cap growth was the best-performing size/value combo of the week.

@Koyfin
S&P optionality strike levels have the Zero-Gamma Level at 4587 while the Call Wall is 4750 and the Put Wall is 4400. Today’s OPEX sees 30% of S&P/Nasdaq/Russel gamma expiring, with the bulk of that centered in the 4,700-4,750 area for S&P (470-475 SPY), near the 400-405 strikes for QQQ, and 200 strike for IWM. December expiration is huge, with $1.3 trillion of call delta notional set to expire. Puts are essentially nonexistent. Spotgamma continues to believe that this call-heavy expiration will lead to some consolidation in stocks, but we appear to be fighting a heavy, bullish tide on this front.

@spotgamma
S&P technical levels have support at 4755, then 4710, with resistance at 4780, then 4805.

@AdamMancini4
Treasuries are mixed on the day, with the 10yr yield a little higher by 0.5 bps to 3.93%, while the 5s30s curve is flatter by 2bp on the session, moving to 11bps.

Four Key Macro House Charts:

Growth/Value Ratio: Value is higher on the week, however, Small-Cap Growth is the best-performing size/factor on the week.

Chinese Iron Ore Future Price: Iron Ore futures are higher on the week.

5yr-30yr Treasury Spread: The curve is steeper on the week.

EUR/JPY FX Cross: The Yen is stronger on the week.
Other Charts:

The rally looks increasingly stretched, with RSI measures indicating extreme overbought conditions, but MACD readings indicates still positive momentum.

Market Breadth measures continue to improve, with around 80% of the S&P above its 200-day moving average.

Fund flows remain strong as well, with equities seeing their largest eight-week inflow since March 2022.

Trading in call options across all stocks and ETFs jumped to a RECORD Thursday during the stock rally, with around 43 million contracts changing hands. That surpasses February's high and the wave of bullish options trading in 2021. - @GunjanJS
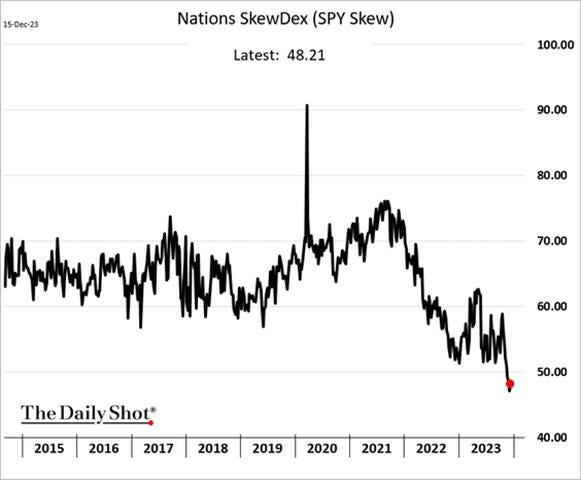
Skew also indicates that call demand is far greater than put demand.

Credit spreads continue to tighten, helped further by the Fed’s dovish pivot this week

Despite the seeming decline of U.S. hegemony, the dollar still remains by far the largest currency used for foreign exchange reserves.

The PBoC has been accelerating liquidity injections to boost economic growth.
Articles by Macro Themes:
Medium-term Themes:
China’s Post-Pandemic Life:
Underlying Momentum Slowed: China’s economic recovery showed signs of losing further momentum as investment and consumer spending expanded slower than expected last month, fueling calls for policymakers to do more to support growth. Retail sales, a key metric for domestic consumption, rose 10.1% in November from a year earlier, missing the 12.9% expansion expected. Fixed-asset investment increased 2.9% during the January-to-November period, matching the pace for the first ten months of the year. Economists had expected fixed-asset investment to grow 3% in year-over-year terms. Investment made by private firms, who supply most of the jobs in urban China, fell 0.5% in the first 11 months compared with a year earlier. In a sign that Beijing is concerned about China’s fragile recovery, the country’s central bank on Friday pumped a net of 800 billion yuan, equivalent to about $112 billion, worth of funds into the financial system, the largest amount of liquidity supplied via its one-year loans to banks on record. - China’s Economy Shows Signs of Losing Further Momentum – WSJ

No Large Scale Actions: China’s ruling Communist Party’s annual economic work conference made building a “modern industrial system” its No. 1 goal, up a place from last year. The priority for 2023 was boosting domestic demand, which fell to the second spot as policymakers emphasized developing cutting-edge technology and artificial intelligence. The language on housing was little changed from previous statements, emphasizing social housing, while no new remedies were offered for the faltering property sector. The meeting’s emphasis on supporting companies to produce higher-value products above trying to spur consumer spending is unlikely to significantly juice growth in the near term. Ramping up manufacturing also risks inflaming geopolitical tensions, as the European Union warns China against flooding the market. - Xi Disappoints Investors by Skipping Signal for Big Stimulus - Bloomberg

Higher Real Rates: China’s real borrowing costs are expected to stay high in 2024 as deflation pressures linger. Calculations by Bloomberg News show those rates — adjusted for inflation and reflective of the actual cost of borrowing funds — have topped 4% and may even be near 5%, which would be the highest level since 2016. That’s because consumer and producer prices have fallen at a much faster pace than the country’s average loan rate, a figure largely based on changes in benchmark rates set by the People’s Bank of China and major lenders. “Real interest rates are important, but obviously, what the PBOC can do is rather limited,” said Wei He, China economist at Gavekal Dragonomics. “It’s impossible for the PBOC to match the changes in CPI for interest rates because that would mean substantial changes to rates, which is very much against its methodology.” - China’s Real Borrowing Costs Are Surging Near Highest Since 2016 – Bloomberg

Longer-term Themes:
Cyber Life and Digital Rights:
Cyber Mandates: Harry Coker is the nation’s newest national cyber director, following a Senate confirmation vote Tuesday. Coker will soon take on the role of the next “coach” to oversee and coordinate cybersecurity policy across the federal government. The Senate passed his nomination by a 59-40 vote. Coker, most recently the executive director at the National Security Agency, continues the trend of NSA alums serving as the nation’s top cybersecurity official. The Office of the National Cyber Director has gone without a Senate-confirmed director for 10 months. The ONCD released an implementation guide that serves as the North star for U.S. cybersecurity policy and includes more than 65 initiatives to carry out the national cybersecurity strategy. The breadth of topics covers everything from critical infrastructure regulations to cyber diplomacy to workforce issues, and is considered a “living document” that is expected to be updated next year. - Harry Coker confirmed to be the next National Cyber Director - CyberScoop

A.I. All Day:
EnviroAI: The U.S. Department of Energy today opened a new office tasked with coordinating the government’s support for and use of artificial intelligence and other cutting-edge technologies to fight climate change, stave off pandemics, and protect the country’s security. The Office of Critical and Emerging Technology will oversee AI, biotech, quantum computing, and semiconductors and will be led by newly-appointed DOE Chief Artificial Intelligence Officer Helena Fu, a former top technology and security official on the National Security Council and at DOE. The new office was mandated by an executive order on AI issued by President Joe Biden in October. AI is quickly emerging as one of the most powerful tools for fighting climate change. It can help develop and test new materials for batteries and solar cells, manage the electric grid, study climate patterns, and monitor emissions, among other applications. But it also has risks, such as the possibility of data leaks and invasions of privacy, and costs, including the vast quantities of energy needed to power the computing that drives it. - The US has a new plan for wielding AI to fight climate change - Semafor

Risks of Generative AI: Since May, Google has been testing an AI product dubbed “Search Generative Experience” on a group of roughly 10 million users and has been vocal about its intention to bring it into the heart of its core search engine. Google’s integration of AI is crystallizing for media outlets the perils of relying on big technology companies to get their content in front of readers and viewers. Already, publishers are reeling from a major decline in traffic sourced from social media sites, as both Meta and X, the former Twitter, have pulled away from distributing news. As bad as the social media downshift is, Google’s generative AI-powered search is the true nightmare for publishers. Across the media world, Google generates nearly 40% of publishers’ traffic, accounting for the largest share of their “referrals,” according to a Wall Street Journal analysis of data from measurement firm Similarweb. - News Publishers See Google’s AI Search Tool as a Traffic-Destroying Nightmare – WSJ

Effective Accelerationism: Under colorful lights and screens showing anime images, the mostly young, mostly male crowd danced to a D.J. set by the musician Grimes, who is better known in tech circles as Elon Musk’s ex. A big banner on the wall read “Accelerate or Die.” Another sign showed a diagram of an A.I. neural network emblazoned with the motto “Come and Take It.” An A.I. start-up handed out promotional fliers that read “THE MESSENGER TO THE GODS IS AVAILABLE TO YOU.” The party was called “Keep A.I. Open,” and it was a coming-out bash of sorts for Effective Accelerationism, one of the weirder and more interesting splinter groups that have emerged from the A.I. boom of the past year. The group believes that artificial intelligence and other emerging technologies should be allowed to move as fast as possible, with no guardrails or gatekeepers standing in the way of innovation. - This A.I. Subculture’s Motto: Go, Go, Go – NYT

Energy’s Midlife Crisis:
Attractive as a Stable Environment: Energy and mining deals have dominated Australia’s dealmaking scene like never before this year. About $A111.3 billion ($73 billion) of energy and mining deals have been announced in Australia year-to-date, accounting for almost half of all transactions in the country, data compiled by Bloomberg shows. That’s the largest share on record going back to 1998. The ratio could go even higher as Woodside Energy Group Ltd. and Santos Ltd. have started initial talks for a tie-up that could create an A$80 billion company with gas and oil asses spanning from Alaska to Australia. Excluding energy and mining deals, Australia is on track for the slowest year in dealmaking since 2020. - Record Resources Deals Rescue a Dim Year for Australian Bankers – Bloomberg

Food: Security, Innovations, and Climate Change Implications:
Grounds of Food Security: India added onions to the nation’s expanding list of food staples slapped with sweeping export restrictions as the government seeks to contain domestic prices ahead of a national election next year. Overseas shipments of onions will be banned until March 31, although cargoes of vegetables that started loading prior to the notification can still be exported, the government said Friday. The ban follows government measures in August to release stockpiles of the staple to shield consumers from rising costs. The onion ban comes a day after India restricted the use of sugar cane juice to produce biofuels, a move aimed at expanding its reserves of the sweetener, and follows curbs on wheat and rice. The measures have spilled over into the global market, threatening food supply from Asia to Africa and boosting some prices. - First It Was Wheat, Then Rice. Now, Onions Are on India’s Restricted List – Bloomberg

Mother of All Peppers: Climate and agricultural models predict a worsening climate scenario. The production of corn, a leading crop that feeds billions around the world, could decline by 24% as early as 2030, according to a 2021 study conducted by NASA. While other staple foods, such as wheat, may actually see an increase in production, researchers say it’s important to diversify food production could help diversify food production, and scientist are now looking at new genetic materials and cross-breeding to help make other crops more drought- and heat-tolerant. Crop breeding is a time-intensive process, so it can be difficult for researchers to keep pace with rapidly changing weather. Advances in genetic sequencing and gene editing can help speed up the process, but come with their own trials. - In the Face of Extreme Weather, Scientists Look to Adapt Crops - UnDark

Authoritarianism in Trouble?:
Cling to Power for Life: These days, a question crops up when African officials gather to discuss governance: Which president will be ousted by his military next? In the first two decades of this century, 13 successful coups took place in Africa. But from August 2020 to November 2023, seven African leaders were toppled by their own militaries. While these military takeovers have so far primarily occurred in a belt of instability that stretches from Niger to Sudan, the risk of broader contagion is real. In already fragile states, coups tend to reverse economic and political progress, and so stemming their rise may be the most urgent task for Africa in the coming decade. - The Crisis of African Democracy – Foreign Affairs

Other Articles of Interest:
Less Labor: Japan's ruling Liberal Democratic Party on Tuesday called for a three-year minimum wait before foreign trainees can change jobs against earlier recommendations by an expert government panel, appealing to business-owning constituents worried about a labor shortage. Japan is designing a new system to replace its troubled Technical Intern Training Program, which has been criticized for barring participants from switching jobs for three years as a general rule. Many have gone missing because they could not endure harsh work conditions. The expert panel in its final report last month urged letting trainees switch jobs if they work for the same employer for at least a year. The proposal allowed for longer waits of up to two years for certain industries. - Japan's LDP resists push to let foreign trainees switch jobs faster - NikkeiAsia

Semiconductor giants race to make next generation of cutting-edge chips – FT
Sales by Segment, Application, and Region: Global sales of total semiconductor manufacturing equipment by original equipment manufacturers are forecast to reach US$100 billion in 2023, a contraction of -6.1% from the industry record of US$107.4 billion posted in 2022, according to SEMI. Semiconductor manufacturing equipment growth is expected to resume in 2024, with sales forecast to reach a new high of US$124 billion in 2025, supported by both the front-end and back-end segments, SEMI indicated. "We anticipate a temporary contraction in 2023 due to the cyclical nature of the semiconductor market," said Ajit Manocha, SEMI president and CEO. "2024 will be a transition year. We expect a strong rebound in 2025, driven by capacity expansion, new fab projects, and high demand for advanced technologies and solutions across the front-end and back-end segments." - Global semiconductor equipment sales to reach record US$124 billion in 2025, says SEMI - GigiTimesAsia

Not Going Up: One airline recently offered a $20 one-way flight, televisions are cheaper than before the pandemic, and appliances are on sale. After inflation surged to a four-decade high, consumers are finally finding deals. Supply-chain constraints have eased, and manufacturers’ staffing has improved, executives and economists say, helping get production lines humming again and helping push down prices. Overall, prices for durable goods—long-lasting items such as consumer electronics—have fallen on a year-over-year basis for five straight months. For some product categories, such as televisions, prices are lower now than before the pandemic, according to Circana, a firm that tracks consumer goods. - Here’s Where Prices Are Actually Coming Down – WSJ

Podcasts and Videos:
Consumer Spending Still Strong – The Transcript
The One Where They Talk About the Outlook - BMO Macro Horizons
Candid Business Diplomacy: A Conversation about China with Joerg Wuttke - CSIS
For Fun:
Getting on Track: Space and Airborne Sensors for Hypersonic Missile Defense - CSIS
VIEWS EXPRESSED IN “CONTENT” ON THIS WEBSITE OR POSTED IN SOCIAL MEDIA AND OTHER PLATFORMS (COLLECTIVELY, “CONTENT DISTRIBUTION OUTLETS”) ARE MY OWN. THE POSTS ARE NOT DIRECTED TO ANY INVESTORS OR POTENTIAL INVESTORS AND DO NOT CONSTITUTE AN OFFER TO SELL -- OR A SOLICITATION OF AN OFFER TO BUY -- ANY SECURITIES AND MAY NOT BE USED OR RELIED UPON IN EVALUATING THE MERITS OF ANY INVESTMENT. THE CONTENT SHOULD NOT BE CONSTRUED AS OR RELIED UPON IN ANY MANNER AS INVESTMENT, LEGAL, TAX, OR OTHER ADVICE. YOU SHOULD CONSULT YOUR OWN ADVISERS AS TO LEGAL, BUSINESS, TAX, AND OTHER RELATED MATTERS CONCERNING ANY INVESTMENT. ANY PROJECTIONS, ESTIMATES, FORECASTS, TARGETS, PROSPECTS AND/OR OPINIONS EXPRESSED IN THESE MATERIALS ARE SUBJECT TO CHANGE WITHOUT NOTICE AND MAY DIFFER OR BE CONTRARY TO OPINIONS EXPRESSED BY OTHERS. ANY CHARTS PROVIDED HERE ARE FOR INFORMATIONAL PURPOSES ONLY, AND SHOULD NOT BE RELIED UPON WHEN MAKING ANY INVESTMENT DECISION. CERTAIN INFORMATION CONTAINED IN HERE HAS BEEN OBTAINED FROM THIRD-PARTY SOURCES. WHILE TAKEN FROM SOURCES BELIEVED TO BE RELIABLE, I HAVE NOT INDEPENDENTLY VERIFIED SUCH INFORMATION AND MAKE NO REPRESENTATIONS ABOUT THE ENDURING ACCURACY OF THE INFORMATION. I MAY OR MAY NOT HAVE POSITIONS IN ANY STOCKS OR ASSET CLASSES MENTIONED. I HAVE NO AFFILIATION WITH ANY OF THE COMPANIES OTHER THAN EXPLICITLY MENTIONED.