


Any Regrets? “I’ve Had a Few…” Powell Commits to not Committing, as Wage Pressures Grow and Markets Stay Rangebound – Midday Macro - 5/5/2023
Color on Markets, Economy, Policy, and Geopolitics

Any Regrets? “I’ve Had a Few…” Powell Commits to not Committing, as Wage Pressures Grow and Markets Stay Rangebound – Midday Macro Weekend Read - 5/5/2023
Daily/Weekly Price Action and Headlines:
Equities are higher on the day but lower on the week, with today’s stronger-than-expected jobs report eliciting a broad rally, with recently weaker sectors boosted by short covering, despite a higher-than-expected average hourly earnings reading
Treasuries are lower on the day but higher on the week, as the general risk-off tone earlier in the week moved yields to the bottom of their recent ranges, although today’ saw a notable retracement higher in the front-end, flattening the curve
WTI is higher on the day but lower on the week, with worries about weaker growth and hence demand and greater supply, mainly due to Russia not implementing their stated cuts, causing speculators to dump longs this week, driving WTI down to the $65 area at one point but now ending the week at $71.50

Market’s Weekly Narrative:
Equities are ending the week on a positive note, with a broad rally taking place after today’s job report came in stronger than expected, moving the S&P closer to the top of its still intact April-May range. The risk on tone really began with an earnings beat from Apple last night, reversing the sharp selloff that occurred Thursday due to continued worries about regional banks and a higher-than-expected unit labor cost reading, increasing worries the Fed was not done. Powell certainly left the door open for additional rate hikes, although the rhetoric used in the statement and during the FOMC press conference suggests a “hawkish” pause is now the likely scenario. Of course, incoming data will continue to influence future policy decisions, while continued financial instability concerned seemed less important to policymakers, a somewhat confusing message given the pressure regional bank stocks were under until today. ISM Manufacturing and Service-sector PMIs both improved but also showed more persistent price pressures in April, while the JOLTs report on Tuesday showed a further decline in openings and quits, a positive sign for the needed labor market loosening. To that point, today’s NFP headline beat was soured by negative revisions to the last two months, explaining why the bigger-than-expected increase in average hourly earnings didn’t elicit a more negative market response. Treasuries did take notice of this rise in AHEs, however, with two-year yields moving back towards 4%, flattening the curve after its recent steepening. Oil is having a hell of a week, crashing at the Thursday Asia open to recent lows due to Chinese traders showing up after their holiday; however, fundamentals came back into play today, helping WTI recover some of its recent losses. Copper is ending the week mostly unchanged as future supply worries grow there. The agg complex is also little changed, with wheat and soybeans a little higher on the week but corn down. Finally, the dollar is slightly lower on the week. The ECB failed to give the Euro a lasting bid, while the Yen was stronger on the week, moving the $DXY to 101.25.
Deeper Dive:
The week, again, brought a fair amount of positive and negative developments, maintaining the glass-half-full or half-empty narrative we continue to highlight. Despite the increased volatility and a still highly uncertain macro backdrop, we find ourselves more optimistic going into next week’s CPI report. This is because we believe the potential for a soft landing increased this week due to a more cautious Fed and a persistently strong labor market, which continues to deliver rising real disposable incomes. At the same time, we see reduced pricing pressures from firms whose costs are stabilizing while the consumer becomes more thrifty due to negative headline fatigue that is causing increased job insecurity. However, with a June rate hike still very much on the table, something next week’s CPI report will likely determine, and D.C. debt-ceiling drama still in early innings we are by no means advocating an all-is-clear message.

*Job gains remain strong but are trending lower as greater uncertainty and a normalizing consumption pattern move supply and demand into a better balance

*With inflation falling, first for goods and gas, and hopefully increasingly elsewhere moving forward, stickier wages should keep the current trend o improving real disposable income intact

*Decreases in the ISM Service Sector PMI Price sub-index continue to indicate overall headline inflation should fall

*With wage increases still occurring, there should continue to be some stickiness in service ex-shelter inflation, but we believe the peak is in
We believe the more defensive posture in markets allows for a further leg higher as “greed beats fear” due to lower Fed and recessionary worries. This was best seen in this week’s options activity, as put buying turned into call buying when technical support levels were reached around 4070 on the S&P. If investors increase their net exposure to risk due to increased FOMO animal spirits taking hold, a step up in ranges can occur for equities, supported by a stabilization in yields at current levels. This is despite the already rich index valuations due to mega-cap outperformance, as any further gains would be driven by multiple expansions due to lower real rates, an improved future growth outlook for 2024, and an increasingly disinflationary backdrop. Of course, with the looming debt-ceiling showdown fast approaching, any additional risk-taking could be akin to “picking up nickels in front of the steamroller.” We don’t claim to have any great insights here and currently expect a short-term deal to be reached at the 11th hour.

*Despite the general choppiness, the S&P has remained in a nearly 120-point range since the beginning of April

*Skew indicates more defensive positioning, which also is supported by some sell-side sentiment surveys

*Any further move higher in equities is predicated on Treasury yields remaining in their current range
With our above-stated view, we are cautiously opening two new long positions in oil and the Russell Index. We see both as currently oversold and not in line with fundamentals. Oil seems to be in its own world recently, as the price drop is somewhat surprising given that OPEC’s cuts are supposedly starting this month. The recent decline is primarily due to long positions being liquidated by funds that built up sizable positions over the past few weeks. There are worries that the global deceleration in manufacturing activity will lead to lower energy demand, and when coupled with higher-than-expected Russian exports, is creating a mismatch between supply and demand that warrants a lower price. However, OPEC will likely “right size” the supply/demand balance with more aggressive cuts. We also see the consumer-driven recovery in China increasing demand there while the U.S. driving season comes in stronger than expected due to that “resilient” consumer. Turning to our Russell long, small caps are cheap, and maybe for a good reason. However, we see a tactical contrarian long opportunity here given our more optimistic growth and Fed outlook and belief that regional banks, although facing significant headwinds regarding balance sheet holdings, do not warrant this much of a discount.

*Oil fundamentals indicate a supply deficit in the second half of the year, yet speculative positioning and falling recent demand have driven prices lower

*Views on China’s reopening vary, made worse by the opaqueness of the economy. However, the consumer looks to be gaining confidence and increasing activity, which should support demand for oil

*The Russell is near its cheapest levels compared to the S&P and Nasdaq since the beginning of the pandemic

*Today’s short-squeeze price action is an excellent example of how many of the regional banks will need to be bought back to close short positions
It is our goal to grow these positions on any pullback due to macro concerns brought on by debt-ceiling “drama” or an uptick in inflationary readings increasing Fed hiking expectations. We still strongly believe inflation is returning to target by next year, and stickiness in core services ex-shelter inflation will begin to thaw. Coupling this with the increased drag that shelter will have on headline and core, the passthrough effects decrease in import prices and PPI readings will have on goods, and the overall drop in energy and agriculture commodities, we expect disinflationary forces to increase. Finally, as alluded to above, we see the “shock and awe” effects of the now daily bank failures and layoff headline announcements changing the consumer’s price sensitivity mentality. This is hard to quantify, and it does not necessarily mean a plunge in consumer confidence readings, but ultimately the growing uncertainty everyone is experiencing should create a more defensive price-elasticity response moving forward, again reducing the pricing power of firms.

*A looser labor market is developing, with Powell even noting that he saw it, increasing consumer price sensitivity

*Demand measures are cooling despite the strong level of private domestic sales in Q1

*Despite more defensive posturing and rhetoric in earning calls, firms generally beat what now look to be overly pessimistic expectations
Admittedly our “inflation will fall fast” view has been dead wrong. The resilience of the consumer will continue for some time due to still historically strong household balance sheets and tight labor markets. However, business surveys are increasingly noting a tougher environment to pass price increases through, and we believe with variable costs stabilizing, firms will be incentivized to reduce prices to gain market share as we enter the next phase of the current cycle. We are early in this process, and it is counterintuitive to what many firms told us in their Q1 earning calls, as discussed in last week’s Deeper Dive. However, if you believe this has mainly been a cost-push supply-side impaired business/inventory/inflation cycle, falling costs should allow firms to switch from defending margins to growing market share as policy/macro uncertainties subside in the second half of the year. There’s a lot to assume there, and our conviction is not strong, mainly due to our uncertainty over how cumulative policy tightening will affect growth moving forward. Nonetheless, we are willing to add risk to the book with tight stops. As always, we want to be clear on what we know and don’t know and the resulting level of confidence we have so that we are honest with our readers, who we greatly appreciate.
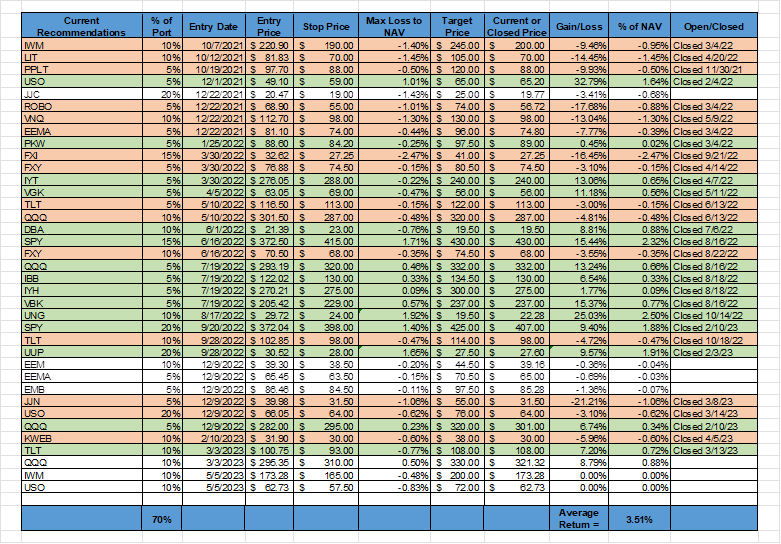
*Adding a 10% position in both $IWM (Russell ETF) and $USO (WTI Oil) with tight stops due to oversold conditions there, while the average portfolio position has returned 3.5%

In the world of options investing, people often use the metaphor “picking up pennies in front of a steamroller” to reference strategies where one collects a small premium but assumes the risk of exorbitant losses if a negative event occurs.
Fed Policy Talk:
The Federal Open Market Committee raised its target rate by another 25 basis points at the May meeting this week, bringing its benchmark federal funds rate to a range between 5% and 5.25%, a 16-year high. The decision was unanimous, with no dissenters, as some expected Chicago Fed President Goolsbee might do. The statement noted modest economic growth, robust job gains, and a still elevated inflation level. The statement immediately highlighted that the “U.S. banking system is sound and resilient.” Still, the Fed expected tighter credit conditions and was unclear what the effects these would have on growth and inflation. The most notable shift in its policy language was the dropping of the phrase that it "anticipates" further rate increases, noting instead that further hikes "may be appropriate." This shift in language in the statement is similar to how officials concluded their interest-rate increases in 2006, with no explicit promise of a pause by retaining a bias to tighten. Powell would also call this a “meaningful change” later in the presser.

*The Fed believes it "may be appropriate." to be more patient now, given growing uncertainty and the lag effects of cumulative policy tightening to date
More generally, Powell was careful in his language during the press conference and continued to leave the door open for a pause or continued hikes. Powell did say, “people did talk about pausing, but not so much at this meeting,” concluding, “we feel like we’re getting closer or maybe even there.” The main message Powell delivered during the press conference’s prepared remarks was that “in light of these uncertain headwinds (likely tighter credit conditions), along with the monetary policy restraint we have put in place, our future policy actions will depend on how events unfold.” Effectively saying that the Fed was even more data-dependent, and this data set had expanded to include credit conditions regarding whether there would be another hike in June. However, Powell would later highlight in the Q&A session that he believed that “policy is tight,” citing that real rates are now close to 2%, “meaningfully above the neutral rate.” He also remarked that he sees a cooling in labor markets occurring and that the unemployment rate doesn’t need to rise too much for wages to fall, something he sees already occurring. However, he noted that looking at a combination of AHE, Atlanta Fed wage Tracker, ECI, and hourly compensation, you still see a 5% level of growth, and he believed a 3% level would be more conducive with the Fed’s 2% inflation target. He concluded that line of thought by dropping a rather shocking admission that he did not believe wages were the principal driver of inflation. This was counter to the mosaic of Fed rhetoric tying wage increases to the persistent/sticky core service inflation ex-shelter inflation.

*For what its worth, Bloomberg’s hawkish/dovish sentence model/counter came in more balanced for the May FOMC meeting
Finally, Powell again pushed back against the market’s pricing of rate cuts in the second half of this year, highlighting that non-housing services haven’t “really moved much.” He still believes demand will need to “weaken a little bit, and labor market conditions may have to soften a bit more to begin to see progress there. And, again, in that world, it wouldn’t be appropriate for us to cut rates.” However, given the continued stress in the banking sector and recession fears, markets actually increased their rate cut projections following the meeting.

*Powell was unable to convince markets the Fed was going to keep rates at the terminal level throughout the year
Stepping back, as we have highlighted since the end of last year, the Fed is taking a more two-sided risk approach to policy decisions, something Vice-Chair Brainard introduced before her departure. This week’s May FOMC meeting’s message reaffirmed this. The Fed is still faced with a broadening financial instability picture. As a result, the effects of expected tighter credit conditions remain a mystery regarding how much policy tightening they will do for the Fed. There has been some progress on the inflation front, something we highlighted two weeks ago, but core service ex-shelter remains too high and sticky. Labor markets are loosening but are still too tight to move inflation to target. However, Powell’s de-emphasis on the labor-inflation relationship is notable, highlighting a potential shift in thinking about the Phillips curve relationship among policymakers (see the below paper summary). Finally, changes to the official statement indicate we are now in a 50/50 world regarding further rate hikes and that there will likely be only a few more, if any, moving forward.
“We've seen inflation come down and move back up two or three times since March of 2021. We've seen inflation have a few months of coming down and then come right back up. So I think you're going to want to see that – you know, that a few months of data will persuade you that you've got this right kind of thing. And, you know, we have the luxury, we've raised 500 basis points. I think that policy is tight. I think real rates are probably (tight) -- that you can calculate in many different ways. But one way is to look at the nominal rate and then subtract a reasonable estimate of, let's say, one-year inflation, which might be 3 percent. So you've got 2 percent real rates. That's meaningfully above what most people would -- many people, anyway, would assess, as, you know, the neutral rate.”
“We always have to balance the risk of not doing enough and not getting inflation under control against the risk of maybe slowing down economic activity too much. And we thought that this rate hike, along with the meaningful change in our policy statement, was the right way to balance that.”
“But it just seems that -- to me that it's possible that we can continue to have a cooling in the labor market without having the big increases in unemployment that have gone with many, you know, prior episodes. Now, that would be against history. I fully appreciate that. That would be against the pattern. But I do think that it -- that this, that the situation in the labor market with so much excess demand, yet, you know, wages are actually -- wages have been moving down.”
"We on the committee have a view that inflation is going to come down not so quickly. It will take some time. And in that world, if that forecast is broadly right, it would not be appropriate to cut rates, and we won't cut rates. Markets, from time to time, have been pricing in quite rapid reductions in inflation. We factor that in, but that's not our forecast."
“I would just say that the SLOOS is broadly consistent when you see it with how we and others have been thinking about the situation and what we're seeing from other sources. You will have seen the Beige Book and listened to the various earnings calls that indicate that midsize banks have -- some of them had been tightening their lending standards. Banking data will show that lending has continued to grow, but the pace has been slowing really since the second half of last year.”

*Historically, the Fed has not been able to stay at a terminal rate after a hiking cycle for long.
Elsewhere in Fed policy land, economists Pierpaolo Benigno and Gauti B. Eggertsson have reassessed the relationship between employment and prices to explain the post-pandemic inflation shock in a new paper titled; “It’s Baaack: The Surge in Inflation in the 2020s and the Return of the Non-Linear Phillips Curve.” In economist terms, they propose “a non-linear New Keynesian Phillips curve” to explain today’s inflation problem. They make three observations to explain why most didn’t see it coming. First, inflation expectations didn’t immediately flash red as there was an assumption the 2021 inflation surge would prove transitory. Second, most assumed the slope of the Philips curve, or rate prices would rise as the labor market tightened, was very low. Finally, there was an assumption we would follow a similar path as seen during the 1970s supply-shock period, but due to the level of stimulus and resilience of the consumer turned out to be wrong. The bottom line of the paper is that the inflationary risk of allowing the labor market to tighten too much (past a point) generated a much greater upside pulse for inflation than had been expected. Both economists concluded that “the good news, in any case, is that if our theory is correct, the cost of taming inflation triggered by a labor shortage, but with stable inflation expectations, can be expected to be much lower than it was in the 1970s.” We were lucky enough to know and work alongside Gauti at the New York Fed and wanted to highlight this work by him and Pierpaolo as we respect this new approach to understanding the Phillips curve.

*A more hockey stick-shaped Phillips curve has emerged due to the pandemic
Econ Data:
The April Jobs Report showed an addition of 253K jobs in April, beating forecasts of 180K and following a downwardly revised 165K (from an initial estimate of 236K) in March. Employment continued to trend up in health care (20.3K), leisure and hospitality (15.5K), and government (22.4K). On the other hand, employment was little changed in construction, manufacturing, wholesale trade, retail trade, transportation and warehousing, and information. The unemployment rate fell to 3.4%, below market expectations of 3.6%. The number of unemployed people decreased by 182K to 5.657 million, and employment levels rose by 139K to 161.031 million, while the labor force participation rate remained unchanged at 62.6%. Average hourly earnings rose by 0.5% MoM to $33.36 in April, after a 0.3% MoM increase in the prior month, while analysts had expected them to remain steady at 0.3% MoM. Over the past 12 months, average hourly earnings have increased by 4.4%. The average workweek was unchanged at 34.4 hours, in line with market forecasts.
Why it Matters: The employment report was broadly stronger than expected. The downward revisions to the prior two months negated the more significant than-expected increase in April, potentially explaining why markets reacted more positively to the data given the higher-than-expected increase in average hourly earnings. Private NFP has averaged 182K per month for the last three months. There is still no material slowing in the labor market despite falling job openings and rising unemployment claims. The unemployment rate is at its lowest level since 1953, while the ratio of vacancies, as seen in the March JOLTs report, to April’s unemployment level at 1.7, a historically very high ratio. Wage growth rose by 4.4% YoY for all private sector workers. However, and not yet significant enough to meaningfully matter, production workers saw their pay slightly fall to 5.0% YoY from 5.1% YoY. As we heard from Powell this week, that level is still 2% points higher than the Fed sees as consistent with attaining its 2% inflation target. The workweek fell slightly to 33.8 hours which resulted in a 0.2% drop in total hours worked in April from March despite the strong increase in private sector payrolls. Nonetheless, this report did not show a labor market moving to a supply and demand balance conducive to quickly lowering inflation.

*The report showed broad hiring across sectors, with education and health services leading the gains

*The monthly gains in AHE were the highest seen in over a year

*The various measures of the UER are all showing a continued tight labor market

*The participation rate is now clearly back at pre-pandemic levels

*Forecasters again underestimated the U.S. Labor market
The number of job openings fell by 384K to 9.6 million in March, the lowest level since April 2021 and below the market's expectation of 9.775 million. The job openings rate (job openings level as a percentage of payrolls plus job openings) fell to 5.8% from 6.0% in February. Over the month, job openings decreased in transportation, warehousing, and utilities (-144K) but increased in educational services (+28K). The number of hires and total separations remained relatively stable at 6.1 million (hires rate of 4%) and 5.9 million (total separations rate of 3.8%), respectively. Within separations, the number of quits (3.9 million) moved the quits rate slightly lower to 2.5% from 2.6% in February, while layoffs and discharges increased to 1.8 million, moving the layoff rate to 1.2% from 1% in the prior month.
Why it Matters: The decline in the ratio of job vacancies to unemployment in the last three months represents a reduction in the excess demand for labor that the Fed will welcome. However, with the ratio still higher than at any time prior to November 2021, the labor market is still tight by historical standards. There was a more significant decline in small business job openings and an increase in layoffs verse larger firms. The construction industry saw a considerable rise in layoffs, followed by leisure and hospitality. There was also a notable drop in leisure & hospitality and accommodation & food quits. There remains a record high level of openings in arts & entertainment.

*The decline in job openings came largely from Trade, Transportation, and Utilities, followed by Professional and Business Service

*Voluntary resignations slowed further while layoffs increased

*The number and rate of quits changed little at 3.9 million and 2.5 percent, respectively, but the sectors with the largest past levels of quits saw the biggest decreases
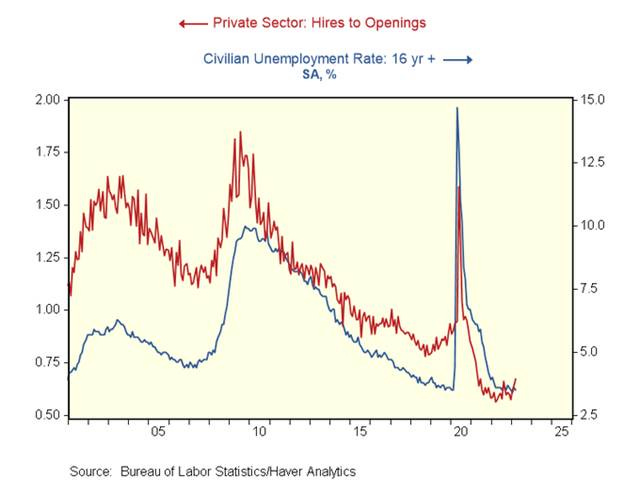
* The ratio of hires to openings in the private sector rose to 0.673, the highest since April 2021 (still low in absolute terms). When the ratio goes up, it implies that firms are having an easier time filling open positions.
Labor productivity declined by -2.7% in the first quarter, following a downwardly revised 1.6% increase in Q4 ’22, and was worse than market expectations of a -1.8% drop. Output grew by 0.2%, compared to 2.9% in Q4 2022, while hours worked were up by 3%, compared to 1.3% in Q4. This brings the annual productivity level to 0.9%. Preliminary data showed that unit labor costs rose by an annualized rate of 6.3% in the first quarter of 2023, accelerating from an upwardly revised 3.3% increase in the previous period and above market expectations of a 5.5% gain. It reflects a 3.4% increase in hourly compensation and a 2.7% decrease in productivity. Year-on-year, labor costs were up 5.8%, easing from a 6.3% annual advance ending in Q4.
Why it Matters: The increase in labor costs is not a good sign for getting inflation down to 2% anytime soon, and unfortunately, although we personally find the measurement of productivity through this method a little archaic, it does elicit attention from policymakers and financial talking heads more generally. The results are also counterintuitive to data seen elsewhere that showed reduced work weeks being reported across various business surveys instead of the 3% increase in hours worked as seen in this report. The drop in productivity subsequently increased the cost of labor, due to a 3.4% rise in hourly compensation. However, Real hourly compensation fell by -0.3% in the first quarter after climbing by 0.7% in the fourth quarter, countering increases seen in other data reports showing real disposable income rising.

*Labor productivity fell by -2.7% in the first quarter, with hours worked increasing and output per hour negative

*Growth in labor costs picked back up, with the Q1 unit labor costs topping expectations
The Challenger Job Cut Report showed employers announced 67K job cuts in April, the lowest monthly level this year and 25% less than in March. Job cuts in the retail sector led all industries (14.6K cuts), up 270% from March, followed by the technology sector (11.5K) and consumer products manufacturers (9.1K). Employers have now announced plans to cut 337.4K jobs so far this year, a 322% increase from the same period a year earlier and the highest January-April total since 2020. Cuts have been largest in the tech sector (114K), retail sector (36.1), and financial sector (33.3K). Hiring plans also fell significantly so far this year, with companies announcing plans to add 23.3K positions in April for a total of 93.9K so far this year. This is a decrease of 81% in the same period last year, the lowest number of announced hiring plans through April since 2016,
Why it Matters: Although April saw a decrease in the total number of cuts (compared to March), consumer-orientated sectors saw increasing levels of layoffs, a sign that despite strong consumer activity in Q1, firms in that sector are becoming increasingly uncertain/defensive about the future. This is also seen in market/economic conditions continuing to be by far the largest reason why firms are cutting workers, with cost-cutting reasons second. “Retailers and Consumer Goods Manufacturers are preparing for a tightening in consumer spending, particularly with the Fed’s hike to interest rates in an attempt to control inflation,” said Andrew Challenger, Senior Vice President of Challenger, Gray & Christmas, Inc.

*March saw a drop in total cuts, although they remain well above levels seen in the last two years

*Technology is still by far the highest layoff sector, but retail saw the largest increase in April

*Retail layoffs were likely mainly attributed to market/economic conditions, but an increase in closing and restructuring reasons for layoffs is worth watching
Construction spending rose by 0.3% in March to $1,834.7 billion, making up for the upwardly revised -0.3% drop in the previous month and beating market expectations of a 0.1% increase. Private construction spending rose by 0.3% MoM after falling by -0.7% MoM in February. Private residential construction spending fell by -0.2% MoM, with spending on single-family housing projects dropping by -0.8% MoM. However, construction spending on multi-family housing climbed by 0.4% MoM. Private nonresidential construction rose by 1% MoM. The largest contributors (by size) were from manufacturing (4.6% MoM), healthcare (0.6% MoM), and office (0.3% MoM), while commercial construction decreased by -0.8% MoM. Public spending rose 0.2% MoM after rising by 1.1% in February. Investment in state and local government construction projects increased by 0.3% MoM, while federal government construction spending declined by -0.7% MoM. Highway and street construction, the largest sector of public spending, saw a move slightly lower for the first time in a while, falling by -0.1%.
Why it Matters: Although residential investment has contracted for eight straight quarters, the longest such streak since the collapse of the housing bubble triggered by the 2007-2009 Great Recession, the pace of decline is slowing. The decline in the first quarter was the smallest in a year. On the other side, nonresidential continues to grow more unevenly. "Nonresidential construction spending increased for the 10th time in the past 11 months," said Associated Builders and Contractors Chief Economist Anirban Basu. "As has been the case for the past several months, though, the expansion in nonresidential investment is attributable to manufacturing. Were it not for a 4.6% increase in manufacturing-related spending, the nonresidential category would have been flat in March.” Further because this data is not adjusted for inflation, real nonresidential construction spending, excluding manufacturing, contracted in March. Basu went on to say "contractors remain optimistic about their sales and profit margins over the next six months, according to ABC's Construction Confidence Index," said Basu. "Given the surprising resilience of construction activity in the face of ongoing interest rate increases and pervasive fears of recession, this confidence has proved justified. Spending has increased over the past year in every nonresidential subsector except for the power category, and multifamily construction is up 23% over the past year. The only construction category that is meaningfully affected by interest rate increases is single-family construction; spending is down by -22.9% since March 2022."

*Private nonresidential construction spending again drove overall gains despite a further slowing in residential activity, with the construction of manufacturing facilities leading the way
The ISM Manufacturing PMI rose to 47.1 in April, up from 46.3 in March and slightly above the market consensus of 46.8. Demand and activity measures improved but remained in contractionary territory as New Orders (45.7 vs. 44.3 in March), New Export Orders (49.8 vs. 47.6), and Production (48.9 vs. 47.8) all modestly improved, while the Backlog of Orders (43.1 vs. 43.9) shortened further. Supplier Deliveries (44.6 vs. 44.8) were little changed, continuing to contract while inventory measures were mixed with input Inventories (46.3 vs. 47.5) fell while Customers’ Inventories (51.3 vs. 48.9) moved slightly back into expansionary territory. Prices (53.2 vs. 49.2) also moved back into expansionary territory. Finally, Employment (50.2 vs. 46.9) moved to neutral.
Why it Matters: The theme for April’s manufacturing PMI reading was a still-falling demand and production activity, but at a slower pace. This was seen in a broader improvement in the sub-index readings, although the majority stayed in contractionary territory while hiring intentions returned to neutral. Respondent's comments were also more neutral to upbeat. Firms noted a general level of uncertainty regarding the future. However, demand/activity varied by industry, with only two of the six biggest manufacturing industries, petroleum products, and transportation equipment, reporting growth. A few respondents commented that they were seeing greater resistance to price increases. The move back into expansionary territory for price measures was expected due to shortages of industrial metals (steel & copper). Interestingly the cost of temporary workers also rose. Activity has contracted for a sixth-straight month, the longest stretch since 2009 and a sign of a deeper contraction in the manufacturing sector.
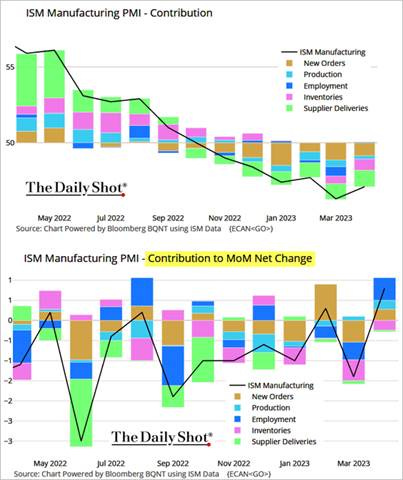
*Three of the ten subindex readings moved back into expansionary territory, helping the headline PMI reading move slightly higher

*Fed officials will see this report as a step back, with hiring activity increasing while prices paid moved back into expansionary territory, but it’s not a tier-one data series for them

*Supply-side impairments continue to ease, but demand/activity expectations vary by industry, and uncertainty remains high
The ISM Services PMI increased to 51.9 in April from 51.2 in March, and slightly higher than market expectations of 51.8. Business Activity (52 vs. 55.4) fell but still expanded in April, while Imports (51.3 vs. 43.6), something that could be seen as an input into production/activity, strongly bounced back into expansionary territory. Most demand measures rose, with New Orders (56.1 vs. 52.2) expanding further while New Export Orders (60.9 vs. 43.7) rose sharply back into expansionary territory. However, the Backlog of Orders (49.7 vs. 48.5) sub-index remained near neutral. Supplier Deliveries (48.6 vs. 45.8) also increased, although delivery times are still falling. Inventory measures fell notably, moving into contractionary territory. Employment also fell, with hiring intentions nearer to neutral. Finally, Prices (59.6 vs. 59.5) were little changed, remaining well in expansionary territory.
Why it Matters: “There has been a slight uptick in the rate of growth for the services sector (in April), due mostly to the increase in new orders and ongoing improvements in both capacity and supply logistics.The majority of respondents are mostly positive about business conditions; however, some respondents are wary of potential headwinds associated with inflation and an economic slowdown”, Anthony Nieves, Chair of the ISM Services Business Survey Committee, said. All fourteen service industries reported growth. Interestingly, steel products declined in price, whereas the opposite was reported in the ISM Manufacturing PMI survey. Electrical components have now seen 27 months of price increases but are no longer in “short supply.” As noted by Nieves, respondent comments were skewed positively, with a few respondents (specific to Health Care, Finance, and Professional, Scientific & Technical Services) expecting “significant” growth. However, the main message from the selected respondent comments was one of stable demand and improving supply-side conditions, reducing cost pressures.

*Although a good thing regarding the supply-side picture, falling delivery times were a drag on the headline service-sector PMI reading

*Increases in demand readings were countered by a more neutral employment picture

*Actual business activity and inventory measures fell, but otherwise, there was a broad rise at the subindex level

*Still varied by industry, the selected comments painted a better outlook in April
Technicals, Positioning, and Charts:
The Russell is outperforming the Nasdaq and S&P with Small-Cap and Growth factors, as well as Energy, Technology, and Financials sectors all outperforming on the day. Despite today’s rally, only Technology, Health Care, and Utilities were higher on the week, indicating yield-sensitive and defensive sectors were favored. Similarly, Growth and Low Volatility factors outperformed on the week, but Small-Caps staged an impressive comeback today.

@KoyfinCharts
S&P optionality strike levels have the Zero-Gamma Level at 4099 while the Call Wall is 4300 and Put Wall is 3900. The S&P is now at the next major level of optionality support at 4150 where the declining IV, which is creating a tailwind for equities (from vanna) will begin to fade. Bullish options activity has consistently dried up at 4150-4200, and we see little reason for that to change in the next few weeks. Looking at yesterday, although implied volatility jumped higher when the S&P moved to the 4050 area, the response to the downside was for traders to buy calls and/or close out puts. Further, yesterday was not a highly correlated selloff; instead, a rotation with weaker sectors seeing more weakness, which is now recovering, likely due to short covering.

@spotgamma
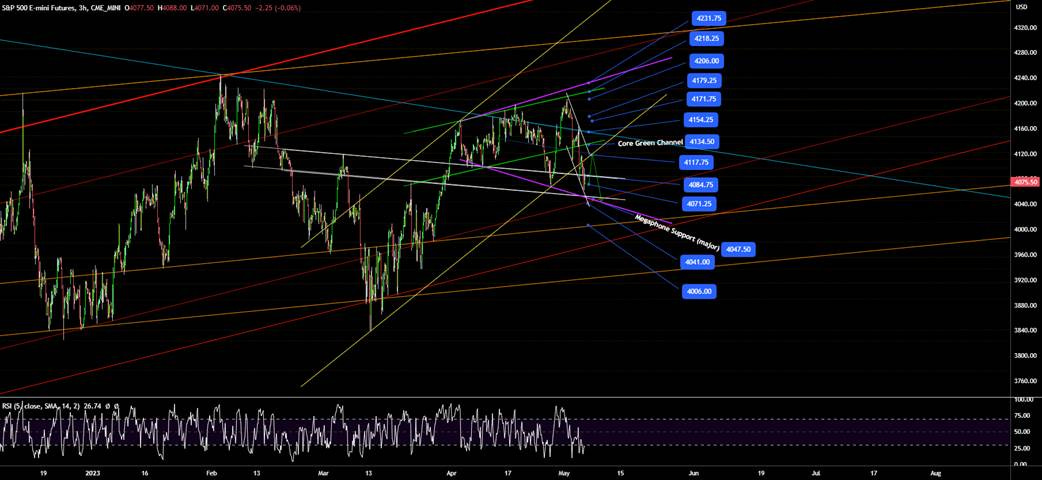
S&P technical levels have support at 4135, then 4115, with resistance at 4165, then 4185. The S&P remains in a dip-buying regime, as discussed last week. The S&P had a very nice failed breakdown setup yesterday afternoon, with its break below 4070. The follow-through higher today is a positive sign for bulls, getting back in the yellow channel at 4115 and then back above 4130 into the core green channel. The ultimate resistance is the top of the megaphone, around 2240. Conditions are now overbought, and price action will likely need to cool and retest the green channel support before the CPI report provides the next catalyst higher or lower.
@AdamMancini4
Treasuries are lower, with the 10yr yield at 3.45%, higher by around 6.5 bps on the session, while the 5s30s curve is flatter by 6 bps on the session, moving to 34 bps.

Four Key Macro House Charts:
Growth/Value Ratio: Growth is higher on the day and week, with Small-Cap Growth the best-performing size/factor on the week.

Chinese Iron Ore Future Price: Iron Ore futures are slightly lower on the day but higher on the week.

5yr-30yr Treasury Spread: The curve is flatter on the day but steeper on the week.

EUR/JPY FX Cross: The Euro was stronger on the day but weaker on the week.

Other Charts:

U.S. Large Cap factor analysis for April showed that quality and low valuation outperformed fo

@NumeraAnalytics model attributes the majority of the S&P’s returns this year to positive sentiment and financial stress levels, with Fed policy and weaker growth being the biggest detractors.

Deutsche Bank’s research team shows that earning beats have been broad-based in Q1, with cyclical and energy sector firms performing the best. However, pandemic-impacted companies are still missing estimates.

Despite the better Q1 performance and improved guidance, the fundamentals still seem off, with growth expected to trend lower while earnings rise…

…However, it does look like several sectors have already gone through a “profit” recession, as end demand has changed and varied by sector - @mrbpartners

Conversations continue shifting from 'Labor Shortages' to 'Job Cuts' during S&P 500 company earnings calls - @M_McDonough

Household net worth (cash assets, housing, equities, and bonds) was inflated dramatically by monetary and fiscal stimulus during the pandemic. A combination of cash handouts and asset price appreciation pushed household net worth way above trend relative to current consumption. The “everything bubble” has since deflated, but asset values are still above trend. This points to a diminished, but still positive, wealth effect. - Gavekal

U.S. supply-chain pressures eased last month, with the Logistics Managers’ Index falling to 50.9, the lowest in its 6 1/2-year history. A dip in inventory levels led the drop, suggesting that respondents “continue to get closer to properly balancing their supply of goods and working through the glut many of them have been saddled with for the last year,” the index’s compilers wrote.
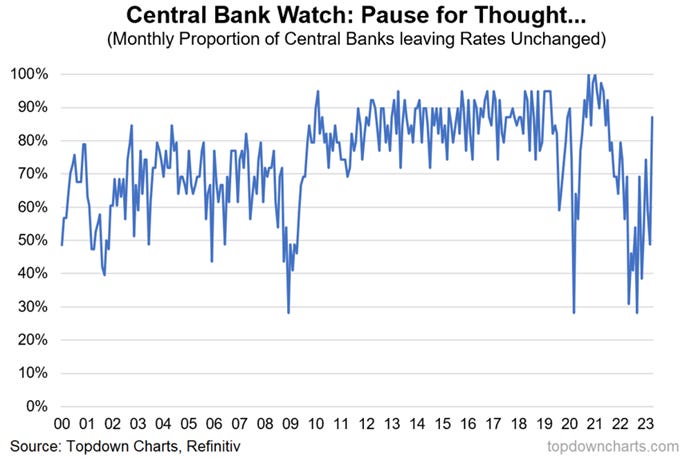
This chart tracks the proportion of central banks (across developed + emerging markets: 39 central banks, representing ~90% of world GDP) who neither cut nor hiked rates during the month (i.e., left interest rates unchanged). In April (at just under 90%), it reached the highest level since mid-2021 (which was when the global policy pivot to hiking began). Definitely an interesting indicator and certainly a pause for thought in terms of the phase of the global monetary policy tightening cycle. - @topdowncharts
Articles by Macro Themes:
Medium-term Themes:
China’s Post-Pandemic Life:
Swarms: Chinese travelers hit the road en masse and thronged tourist spots during the annual Labor Day holiday, an encouraging sign that the country’s consumer-led economic rebound is powering ahead even as factories start to struggle. The travel splurge also underlines how domestic consumers are in the driver’s seat of China’s economic recovery. Official survey data released Sunday showed Chinese factory activity unexpectedly shrank last month, a victim of faltering global spending as consumers and businesses in the U.S., Europe, and Asia confront high and rising interest rates, persistent inflation, and pockets of weakness in the financial system. China’s long holiday, known domestically as a Golden Week, “shows that pent-up demand is strong and excess savings accumulated over the past two to three years are helping to sustain consumer spending,” said Shuang Ding, chief economist for China and North Asia at Standard Chartered in Hong Kong. - Chinese Travelers Swarm Domestic Tourist Sites, a Positive Sign for Economy – WSJ

Lopsided: April’s purchasing managers’ indexes showed an unexpected decline in factory activity, weighed down by weaker global demand for Chinese exports. Chinese consumers, though, continued to spend on travel and shopping, with early figures from the Labor Day holidays showing a notable jump from last year. The data suggest China’s recovery remains lopsided, with the production side of the economy lagging the rebound in consumption. “These mixed signals will likely keep the pressure on the government to continue its supportive fiscal and monetary policies” in the second quarter, said Zhang Zhiwei, chief economist at Pinpoint Asset Management Ltd. - China’s Mixed Economic Data Fuels Concerns About Recovery - Bloomberg

Longer-term Themes:
Cyber Life and Digital Rights:
Extra Pain: Twitter's decision to shut off its free API caused more than a few problems for public institutions that depend on the functionality, and the company is clearly ready to backtrack. The social network has restored free access to the app programming framework for verified government and publicly-owned services that use the tool for "critical purposes" such as emergency notifications, transportation updates, and weather alerts. The shutoff broke numerous apps and services that relied on the free API for sharing and content streams, such as Flipboard's reader. It also created issues for developers willing to pay for access, including Echobox. While Twitter had warned that a cutoff was coming at some point, it didn't notify customers of the exact timing and did little to explain the impact. - Twitter restores free API access for emergency, weather and transportation alerts - engadget

AI All Day:
“Sufficiently Detailed Summary”: Italy’s privacy regulator rescinded its temporary ban on ChatGPT after the chatbot’s developer, OpenAI, implemented changes demanded by the regulator, the latest twist in the complex regulatory response to new artificial intelligence technology. The privacy regulator said late Friday that OpenAI had implemented most of its demands, including giving more information about how it processes information and creating an online form for people to opt out of their information being used to train the language models that power ChatGPT. OpenAI isn’t off the hook for privacy investigations in Europe, with an ad hoc task force of European Union privacy regulators assembled earlier this month. - ChatGPT Ban Lifted in Italy After Data-Privacy Concessions – WSJ

AI Regulations Starting: The Group of Seven advanced nations should adopt "risk-based" regulation on artificial intelligence, their digital ministers agreed on Sunday, as European lawmakers hurry to introduce an AI Act to enforce rules on emerging tools such as ChatGPT. But such regulation should also "preserve an open and enabling environment" for the development of AI technologies and be based on democratic values, G7 ministers said. "We plan to convene future G7 discussions on generative AI, which could include topics such as governance, how to safeguard intellectual property rights including copyright, promote transparency, address disinformation," including information manipulation by foreign forces, the ministerial statement said. - G7 should adopt 'risk-based' AI regulation, ministers say – Reuters

Energy’s Midlife Crisis:
Bigger Share: Chile is transforming its model for lithium extraction and production, with the government seeking majority stakes in new contracts with private companies. President Gabriel Boric is walking a fine line, seeking a fairer distribution of wealth from Chile’s resources without compromising the country’s position as a major player in the clean-energy transition. His model will also require operations in one of the driest places on Earth to adopt a new technique that uses less water, though the method is relatively untested at scale and initially may mean less output. The No. 2 lithium producer globally moving to a state-run system risks hindering the supply of the highest-value mineral in the battery supply chain, just as the auto world needs it more than ever. - One of the World’s Lithium Leaders Looks Like a Shakier Source - Bloomberg

300-Megawatts: Westinghouse, the U.S. nuclear technology giant, is developing a compact version of its flagship power plant, a move aimed at making its designs more competitive in markets that don’t need large, conventional reactors. The compact plant would have a generating capacity of 300 megawatts, making it a suitable replacement for coal plants that often generate a similar amount of power. The AP300 is one of the dozens of so-called SMRs that are expected to be made in factories and assembled on-site, an approach advocates say will make them faster and cheaper to build. Westinghouse said it would eventually be able to deliver one for about $1 billion. The Nuclear Regulatory Commission has approved only one design to date, and it’s unlikely any will be in service in the U.S. before the end of the decade. - Westinghouse Unveils Plans for Its First Small Nuclear Reactor - Bloomberg

Asian Tigers 2.0:
Open Doors: President Biden met with President Marcos of the Philippines at the White House on Monday, a visit meant to send a message to China that the Filipino leader planned to deepen his country’s relationship with the United States. Mr. Marcos’s trip comes days after the U.S. and Philippine militaries held joint exercises aimed at curbing China’s influence in the South China Sea and strengthening the United States’ ability to defend Taiwan if China invades. The exercises were part of a rapid and intensifying effort between the two countries: In February, the Pentagon announced that the U.S. military would expand its presence in the Philippines, and this spring, four new military sites were announced. - Biden Meets Marcos in Washington Amid Tensions With China – NYT

Other Articles of Interest:
Shut-In Wells?: Moscow pledged to curb output by 500,000 barrels a day in retaliation for Western energy sanctions and to support the price of its oil. Deputy Prime Minister Alexander Novak has said the cuts were implemented by the end of March and maintained in April, but official production data is being withheld due to Russia’s official oil-output data being classified after the invasion of Ukraine due to its “sensitive” nature and tanker tracking shows no corresponding drop in seaborne exports. The proportion of idled and shut-in wells could be an indication that Russia’s producers have taken steps to reduce output, reaching the largest proportion of inactive wells for the nation since May 2022, when the country was making short-term output cuts amid the first waves of international energy sanctions following its invasion of Ukraine. - Russia Halts Some Oil Wells But Keeps Production Data Secret - Bloomberg


Sanity May Not Prevail?: A full-on collision is entirely possible, given how far apart the two sides remain on how to limit future budget deficits. The Democrats favor increasing taxes on the wealthy and improving compliance. The Republicans favor sharply cutting domestic discretionary spending. The only area of agreement is that Social Security and Medicare are off-limits. If the debt limit ends up binding, the Biden administration is highly unlikely to resort to gimmicks such as issuing a $1 trillion coin or invoking the 14th Amendment. Instead, the Treasury would prioritize obligations, putting interest and principal on government securities first to avoid a sovereign default and delaying other types of payments (for example, to government workers and contractors). Even if prioritization averted an immediate default on Treasury securities, the damage would be vast. Markets, still dealing with the consequences of a rash of bank failures, would be shocked, having expected the usual last-minute deal. - This Debt-Limit Standoff Could Be Really Disastrous - Bloomberg

VIEWS EXPRESSED IN "CONTENT" ON THIS WEBSITE OR POSTED IN SOCIAL MEDIA AND OTHER PLATFORMS (COLLECTIVELY, "CONTENT DISTRIBUTION OUTLETS") ARE MY OWN. THE POSTS ARE NOT DIRECTED TO ANY INVESTORS OR POTENTIAL INVESTORS, AND DO NOT CONSTITUTE AN OFFER TO SELL -- OR A SOLICITATION OF AN OFFER TO BUY -- ANY SECURITIES, AND MAY NOT BE USED OR RELIED UPON IN EVALUATING THE MERITS OF ANY INVESTMENT.
THE CONTENT SHOULD NOT BE CONSTRUED AS OR RELIED UPON IN ANY MANNER AS INVESTMENT, LEGAL, TAX, OR OTHER ADVICE. YOU SHOULD CONSULT YOUR OWN ADVISERS AS TO LEGAL, BUSINESS, TAX, AND OTHER RELATED MATTERS CONCERNING ANY INVESTMENT. ANY PROJECTIONS, ESTIMATES, FORECASTS, TARGETS, PROSPECTS AND/OR OPINIONS EXPRESSED IN THESE MATERIALS ARE SUBJECT TO CHANGE WITHOUT NOTICE AND MAY DIFFER OR BE CONTRARY TO OPINIONS EXPRESSED BY OTHERS. ANY CHARTS PROVIDED HERE ARE FOR INFORMATIONAL PURPOSES ONLY, AND SHOULD NOT BE RELIED UPON WHEN MAKING ANY INVESTMENT DECISION. CERTAIN INFORMATION CONTAINED IN HERE HAS BEEN OBTAINED FROM THIRD-PARTY SOURCES. WHILE TAKEN FROM SOURCES BELIEVED TO BE RELIABLE, I HAVE NOT INDEPENDENTLY VERIFIED SUCH INFORMATION AND MAKES NO REPRESENTATIONS ABOUT THE ENDURING ACCURACY OF THE INFORMATION