


Rangebound Choppy Price Action on a Heavy Fed Rhetoric but Light Data Week Leaves Risk-Reward Still Poor– 4/21/2023
Color on Markets, Economy, Policy, and Geopolitics

Rangebound Choppy Price Action on a Heavy Fed Rhetoric but Light Data Week Leaves Risk-Reward Still Poor– 4/21/2023
Price Action and Headlines:
Equities are higher on the day but little changed on the week, with the S&P remaining in its April range, as this week’s more hawkish Fed rhetoric, generally inline-to-more-positive earnings results, and a lack of any tier 1 data kept indexes choppy and consolidating
Treasuries are lower on the day but also little changed on the week, with yields also range bound as the MOVE index has fallen notable as policy expectations have solidified for May’s FOMC meeting while growth expectations have weakened generally, pressuring breakevens slightly
WTI is higher on the day but lower on the week, with weaker global growth expectations for the U.S. and Europe dampening oil consumption expectations and offsetting falling US inventories and strong Chinese economic data

Narrative Analysis:
Equity indexes remain rangebound with no new catalyst moving them material higher or lower this week. Leadership was more defensive at the sector level, while factor performance was more mixed. However, with the VIX below 17, volatility was being sold, indicating a more risk-positive underbelly in equity markets. Economic data this week showed a cooling in housing activity, although homebuilder sentiment improved. Manufacturing activity in the NY region rebounded sharply back into expansionary territory, while the Philly region was weaker, although not as bad as the headline drop indicated. Today’s S&P PMI readings were better than expected, showing increased demand/activity, hiring, and, unfortunately, price pressures, countering drops seen elsewhere. Fed speakers were out in force this week, getting in their appearance before next week’s May FOMC meeting blackout period starts. Generally, the tone was more hawkish, with the majority seeing recent financial instability as contained while inflation remains persistently too high. Some noted further loosening in labor market tightness and progress toward price stability goals, indicating that May’s likely 25bps hike could be the last. This helped Treasury yields tighten their recent range and drove rate volatility lower. Oil was one of the worst performers of the week, giving back OPEC+ cut gains as cross-Atlantic demand expectations fell. Copper also trended lower on the week after rising on better-than-expected China growth data on Monday. The agg complex was little changed on aggregate, although there were plenty of individual stories, with grains falling despite uncertainty over Ukraine exports. Finally, the dollar was also little changed, with the $DXY finishing the week near 102.
Deeper Dive:
We will keep things relatively short and simple in this week’s Deeper Dive. Since we last wrote, there has been progress on the data front regarding inflation continuing to ease and labor markets loosening. However, as is often the case, it is all in the eye of the beholder. For example, although inflation data more broadly (PPI, import/export, regional and national PMI readings of prices) has fallen and is outright contracting by some measures now, official data remains sticky, as “supercore” registered minimal improvements in March. Further, inflation expectations were notably higher in the most recent University of Michigan survey, largely thanks to price increases at the pump and reversing any relief the Fed recently had there. Labor market conditions also look to be loosening, with early indicators (initial/continuing claims, temporary/part-time worker cuts, layoffs, and weaker business survey hiring intentions) continuing to point to a softening. However, at the same time, actual hiring activity remains robust and high turnover continues to keep wage growth too high for comfort. As a result, and with reduced financial stability concerns, the bulk of Fed officials that spoke this week continued to support the “more work is needed” mantra, indicating an additional 25bps rate hike is all but assured at the fast-coming May FOMC meeting. With outlook uncertainty continuing to be high and the economy in a glass-half-full or half-empty position, the probability for the Fed and markets to miss read the tea leaves is very high. It also leaves us with little conviction on where markets may move next, something that is important to acknowledge as it justifies our lower asset allocation and often-stated belief that we are still in an environment that dictates patience and tactical trading.

*PPI and import prices have been falling quickly, although there is underlying stickiness in certain areas of PPI while the focus for the Fed is now on services, not goods, which import prices represent more

*PMI surveys from ISM and regional Feds have generally shown decreasing prices received and paid, although today’s April S&P Flash PMI showed increases in both.

*The so-called “supercore” service inflation continues to rise at an elevated monthly rate while median CPI readings are still rising, giving the Fed reason to continue to tighten policy

*The recent uptick in consumer inflation expectations was driven by recent gas price rises, something that may reverse; nonetheless, it will still be seen as a negative at the May FOMC meeting

*Rising continuing claims and more neutral hiring intention readings in business surveys indicate a cooling in the labor market is occurring

*Wage growth and the average workweek hours are trending lower, but turnover/quits, job openings, and overall payroll gains are still historically high
Something is said to be gospel when enough people believe it to be true, and the barrage of market participants calling for a recession continues to grow louder the longer we actually don’t get one, impacting investor's emotional and cognitive biases and creating what is beginning to look like a self-fulfilling prophecy. The problem is that the data still suggest a soft landing is probable. This is increasingly seen in the current Q1 earning season, with firms benefiting from a more substantial and broader growth pulse at the beginning of the year. However, more recent March and April data showed that momentum is slowing in household spending and the economy, as seen in retail sales as well as manufacturing reports. The problem is that currently, activity is still too strong for the Fed, mainly due to the strength of the consumer, whose confidence has improved, still has a relatively strong household balance sheet, and, most importantly, is employed, leaving the door open for additional tightening. As a result, a “good is bad” market mentality remains. This creates a negative feedback mechanism that caps the degree to which risk assets can rally from current levels.

*Stronger than expected personal consumption expenditures drove the bulk of Q1 GDP growth

*U.S. household leverage is currently at levels last seen in the early 1980s. If the unemployment rate rises, consumer spending will slow down, but the starting point for US households is very strong

*With jobs plentiful and inflation falling, consumer confidence has bottomed, although it is still historically weak
Simply put, as long as the Fed is seen keeping its policy in restrictive territory (“higher for longer”) because growth is at or above trend, real rates will rise (as inflation falls but nominal yields do not), acting as a weight on P/E multiple expansion. Given the uncertainty around earnings growth and still somewhat optimistic forecasts there, any forward equity returns will likely continue to be driven by multiple expansions, as seen in Q1, as investors look past the expected second-half slowdown toward 2024. However, given the Fed’s reliance on lagged inflation readings and questionable labor data (JOLTs and Household Survey), as well as their still optimistic view of the effects of its cumulative policy actions to date on the overall economy, the current hawkish tone that is reemerging, following the recent banking turmoil, worries us. As we see it, there is certainly a path to a soft landing, but the obsession with core service ex-shelter and job openings levels increases the likelihood of a policy error (of overtightening). As a result, the risk-reward for being bullish risk here is not favorable. This view is bolstered further by the fast-coming debt ceiling showdown and generally still negative geopolitical backdrop.

*March data showed a cooling of activity, potentially indicating a more broad cooling of the economy is beginning

*Financial conditions have recovered all the tightening that occurred following the collapse of SVB, while Fed hiking expectations have risen again too
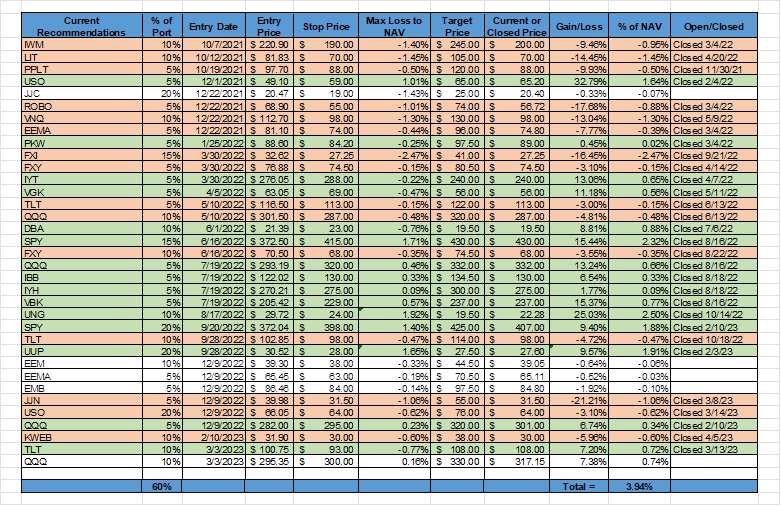
*We were stopped out of our $KWEB long as Chinese ADRs continue to be hurt by deteriorating U.S.-China relations despite stronger-than-expected growth in China
Policy Talk:
We had a lot of Fed officials speaking this week before the May FOMC meeting blackout period starts next week. The message has mainly remained the same, with “more work to do” still being the main message but a more cautious outlook on growth due to the recent financial instability. Overall, it looks like most officials are comfortable raising rates one more time by 25bps at the May FOMC meeting, given where the economic data has been and the re-easing of financial conditions. Hawkish voices like Bullard, Mester, and Waller continue to see Q1 data as too strong and measures to contain financial instability as working, bringing into question whether significant credit tightening is coming, which would negate the need for further policy tightening. As a result, the need for further hikes following May’s FOMC meeting was teased by the Hawks, with Bullard going as far as to say he wanted to see three more hikes, but of course, that would be dependent on incoming data. On the other side, more dovish-leaning members such as Goolsbee took a more cautious tone, highlighting that everyone is forecasting a slowdown in economic growth, but how “intense that will be is going to depend a lot on the financial part.” Several officials also noted that they saw further indications of a gradual cooling in the labor market. Steeping back, it seems most Fed officials continue to be more two-sided in their risk assessment of future policy actions. The recent labor and inflation data certainly re-trended in a more favorable fashion, but favorite measures of looking at inflations breadth, such as median and trimmed-mean index approaches, moved sideways in March despite a slowing in core-services ex-shelters monthly growth. This continues to leave the Fed in a tough position, with the risk of policy error only growing as economic momentum slows, but official inflationary data remains sticky and labor markets remain tight.
“We are much closer to the end of the tightening journey than the beginning, and how much further tightening is needed will depend on economic and financial developments and progress on our monetary goals.” – Cleveland Fed President Mester
"Wall Street's very engaged in the idea there's going to be a recession in six months or something, but that isn't really the way you would read an expansion like this." - St. Louis Fed President Bullard
“One more move should be enough for us to then take a step back and see how our policy is flowing through the economy, to understand the extent to which inflation is returning back to our target.” – Atlanta Fed President Bostic
“My message is to be prudent, be patient. If banks are pulling back, it behooves us to pay attention to the data and ask how much of our normal monetary policy job is getting done for us by the credit conditions.” – Chicago Fed President Goolsbee
“So far, tighter monetary policy from the Federal Reserve and central banks around the world is helping to bring a better balance between supply and demand. Inflation has declined in a number of sectors, particularly for many categories of commodities and goods.” – New York Fed President Williams

Yesterday’s H.4.1 Fed Balance Sheet report showed discount window and Bank Term Funding loans in the week ending April 19 rose for the first time since mid-March by a combined $4.1 bln to a total of 143.9 bln. The Fed's loan to the FDIC for resolving SVB and Signature held at $173b, central bank liquidity swaps remained negligible ($480 million), and FIMA repo fell a further $10bln.

The Fed’s April Beige Book showed that economic activity had little changed since early March, with nine districts reporting little to no change while three indicated modest growth. Future outlooks were also little changed, although two districts saw outlooks deteriorate.

Consumer spending was generally flat to down slightly, with auto sales steady while travel and tourism picked up across much of the country. Manufacturing activity was reported as weaker even as supply chains continued to improve due to logistic volumes falling. Residential real estate sales and new construction activity softened while construction activity elsewhere was little changed while sales and leasing activity fell. Lending volumes and loan demand have declined across consumers and businesses since early April, with several districts noting that banks tightened lending standards amid increased uncertainty and liquidity concerns.

There was a slower pace of employment growth. A small number of firms reported mass layoffs, and those were centered at a subset of the largest companies, while firms still hiring were more selective and experiencing better retention, leading contacts to report that the labor markets were becoming less tight. As a result, wage increases have shown some moderation but remain elevated.

The rate of price increases appears to be slowing, with contacts noting modest-to-sharp declines in the prices of nonlabor inputs and significantly lower freight costs, but producer prices for finished goods still rose. Selling price pressures eased broadly in the manufacturing and services sectors, but consumer prices increased due to still-elevated demand. Finally, prices for homes and rents leveled out in most districts but remained near-record highs.
“Regional banks continued to report widespread declines in loan demand, ongoing credit tightening, and modestly rising mortgage delinquency rates. Amid heightened uncertainty, most businesses do not expect economic conditions to improve in the coming months.” – NY District
“Consumer demand appeared to tick down, as contacts detailed slower traffic and smaller purchases by customers. Inflation and higher interest rates continued to weigh on demand for big-ticket items, including homes and autos.” – Philadelphia District
“Concerns about developments in the banking industry reportedly had limited impact on recent business activity, though a small share of contacts reported a modest decrease in credit availability. However, many contacts indicated that these developments had increased uncertainty.” – Clevland District
“Overall payrolls rose modestly, though hiring slowed sharply in the service sector. Wage growth remained elevated while price pressures eased notably. Outlooks worsened, and uncertainty surged, partly due to heightened apprehension about the recent banking sector issues and high-interest rates, and their spillover effects on the broader economy.” – Dallas District
Econ Data:
The NAHB/Wells Fargo Housing Market Index increased for a fourth month to 45 in April, a fresh high since September of 2022 and beating market forecasts of 44. The gauge for Current Sales Conditions rose to 51 from 49, Sales Expectations in the Next Six Months increased to 50 from 47, and Traffic of Prospective Buyers was unchanged at 31.
Why it Matters: At 45, the index still points to a contraction in housing market activity but at a slower rate, with overall activity readings being weighed down solely by prospective buyer's traffic. With one-third of housing inventory now newly constructed, compared to historical norms of a little more than 10%, buyers in 2023 are increasingly looking at new homes which are offering better sales incentives. The survey shows that the share of builders reducing home prices continues trending down, as 30% said they reduced prices in April, compared to 31% in March. The average price reduction in April was 6%, the same as in February and March. The share of builders using incentives to bolster sales edged up to 59% in April. The report noted that while AD&C loan conditions are tight, there is no significant evidence thus far that pressure on the regional bank system has made this lending environment for builders and land developers worse. Finally, “the industry continues to be plagued by building material issues, including lack of access to electrical transformer equipment," NAHB Chairman Alicia Huey said.

*A reading below 50 indicates housing market activity is contracting, but 2 of the three sub-indexes are now at 50 or above
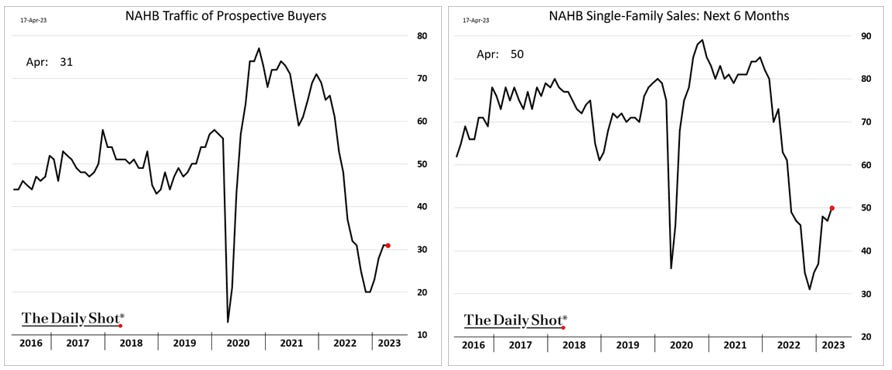
*Foot traffic continues to remain deeply in contractionary territory, while current and expected sales have recovered to more neutral levels
Existing home sales fell by -2.4% in March to a seasonally adjusted annual rate of 4.44, compared to market forecasts of 4.5 million. Sales declined in three out of the four major U.S. regions, with only the Northeast remaining steady. On a non-seasonal adjusted basis, sales in March were -21.1% lower annually. Total housing inventory was 980K units, higher by 1% from February and 5.4% from one year ago. This is the equivalent of 2.6 months' supply at the current monthly sales pace. The median existing-home price for all housing types was $375,700, an annual decline of -0.9%. 65% of homes sold in March were on the market for less than a month, and first-time buyers were responsible for 28% of sales, up from 27% in February. Finally, Distressed sales (foreclosures and short sales) represented 1% of sales in March, nearly identical to last month and one year ago.
Why it Matters: Existing home sales gave back some of the gains seen in February, where sales rose at a downwardly revised 13.8% MoM rate, the biggest surge since July 2020. Sales are now lower by -22% year-over-year compared to February 2022, the nineteenth consecutive month with sales down year-over-year. However, demand continued to stabilize, with properties typically remaining on the market for 29 days in March, down from 34 days in February but up from 17 days in March 2022. "Home sales are trying to recover and are highly sensitive to changes in mortgage rates," said NAR Chief Economist Lawrence Yun. "Yet, at the same time, multiple offers on starter homes are quite common, implying more supply is needed to fully satisfy demand. It's a unique housing market," said NAR Chief Economist Lawrence Yun. Finally, unsold inventory was unchanged from February but is higher than in 2022.

* Sales declined 22% year-over-year compared to February 2022

* Inventories increased slightly to 0.98 million in March from 0.97 million in February

* NAR Median house prices increased 3.3% from February to March and have declined 9.2% from the peak in June 2022 (NSA).
Housing starts fell by -0.8% month-over-month to 1.42 million SAR in March, following a downwardly revised jump of 7.3% in February and slightly beating market forecasts of 1.4 million. Multi-unit starts fell by -6.7% to 542K, while single-family housing starts increased by 2.7% to a three-month high of 861K. Starts fell in the Midwest (-23.6% to 133K) and the West (-28.1% to 258K) but rose in the South (6.8% to 848K) and soared in the Northeast (72.4% to 181K). Building permits fell by -8.8% to 1.41 million after jumping 15.8% in February and missed market expectations of 1.45 million. Permits for multi-units tumbled by -22.1% to 595K, while single-family authorizations increased by 4.1% to a five-month high of 818 thousand. Permits were only higher in the Northeast (25.2% to 144K) and down in the South (-11.8% to 761K), West (-16.5% to 314K), and Midwest (-1.0% to 194K). Housing completions fell by -0.6% in March to 1.54 million SAR.
Why it Matters: The drop in housing starts and more significant fall in new permits was due to a slowdown in multi-units, which had been booming over the last few months. The rise in both single-family starts and permits, which is a larger part of the overall housing market, means despite weaker headline readings, the housing market's recent strength is likely still intact, and drops in March’s multi-unit readings are more a payback after February historically large jumps in both starts and permits than a broad cooling in activity. However, with mortgage applications declining by -8.8% last week, reversing a 5.3% rise in the previous week, higher interest rates may again increasingly impact demand. The average contract interest rate for 30-year fixed-rate mortgages rose to 6.43%, the first increase in six weeks. “Affordability challenges persist, and there is limited for-sale inventory in many markets across the country, so buyers remain selective on when they act,” Joel Kan, MBA’s chief economist, said.

*NSA Housing starts and building permits remain historically high as inventory remains low

*Increases in single-family starts and permits on the month countered a cooling in multi-unit activity
The New York Fed’s Empire State Manufacturing Index jumped to 10.8 in April from -24.6 in March, beating market forecasts of -18. New Orders (25.1 vs. -21.7 in March) rebounded to a one-year high, while Shipments (23.9 vs. -13.4) also increased dramatically. Unfilled Orders (0 vs. -6.7) returned to a neutral reading after being in contractionary territory for around a year. Delivery Times (0 vs. -7.6) also increased to a neutral reading, while Inventories (8.2 vs. -1.9) moved well into expansionary territory. Price readings were mixed, with Prices Paid (33 vs. 41.9) falling while Prices Received (23.7 vs. 22.9) were little changed. Finally, labor readings improved as the Number of Employees (-8 vs. -10.1) and Average Workweek (-6.4 vs. -18.5) rose, but both remained in contractionary territory. Forward-looking readings generally improved with the overall General Business Conditions (6.6 vs. 2.9) rising. Both expected price measures and hiring intentions increased. Capex intentions also rose further into the expansionary territory; although IT spending declined slightly, but also remained expansionary.
Why it Matters: The reading pointed to the first expansion in manufacturing in the NY region in five months and the strongest headline number since July last year. Given the massive rise in new orders, shipments, and broad increases elsewhere, it's hard to know if this report is more of a payback from recent weakness or indicates a sustainable shift in sentiment by manufacturing firms. The general improvement in the six-month-ahead future outlook does seem to reinforce the move higher in the current picture. However, decreases in expected future unfilled orders and shipments countered increases in future employment intentions and continued expansion in Capex intentions, indicating a still cautious, albeit mixed, outlook despite the significant improvement in respondents’ current views.

*A historically sizeable move higher in the headline reading due to large jumps in new orders and shipments

*Forward-looking indicators generally improved, with expected price readings also rising; however, demand and activity indicators were more negative
The New York Fed’s Service Sector Business Leaders Survey improved slightly to -9.8 in April from -10.1 in March. The Business Climate (-47.7 vs. -38.8 in March) worsened, falling below the levels seen in Q4 ’22. Labor readings cooled with the Number of Employees (0 vs. 6.7) moving to neutral, indicating flat hiring, while Wages (41 vs. 49.7) fell but remained highly expansionary. Price pressures fell with Prices Paid (59.5 vs. 64.8) and Prices Received (22 vs. 33.1), dropping somewhat notably. Finally, Capex Spending (6.9 vs. 7.9) remained expansionary. Forward-looking indicators weakened with the General Business Activity (-0.6 vs. 6.8) moving into negative territory for the first time this year. Every six-month-ahead sub-index declined, except capex spending intentions.
Why it Matters: The business climate index continues to suggest the business climate remains historically bad for service sector firms in the New York region. The employment index indicated that firms did not increase employment for the first time in two years, while the wage index indicated further moderation. However, it remains in historically high expansionary territory. Looking ahead, firms do not expect conditions to improve over the next six months, expect employment and price pressures to contract but continue to expect increased capex investment.

*Business activity remains in contractionary territory with expected conditions now also negative

*Price measures continue to drop fast
The Philadelphia Fed Manufacturing Index fell to -31.3 points in April, the lowest since May 2020, from -23.2 in March, missing market expectations of -19.2. Demand and activity readings improved, but remained contractionary, as seen in rises in New Orders (-22.7 vs. -28.2 in March), Unfilled Orders (-11.1 vs. -21.3), and Shipments (-7.3 vs. -25.4). Delivery Times (-25 vs. -24.3) continued to shorten, while Inventories (-17.9 vs. -11.2) contracted further. Employment reading improved with the Number of Employees (-0.2 vs. -10.3) moving to neutral, while the Average Workweek (-8.4 vs. -22) was shortening at a reduced rate. Both Prices Paid (8.2 vs. 23.5) and Received (-3.3 vs. 7.9) declined to their lowest levels since mid-2020. The six-month ahead future general business outlook moved closer to neutral thanks to improved expectations for new orders and shipments. However, future labor and Capex readings weakened while price measures were mixed.
Why it Matters: Despite the drop in the headline number, the overall guts of the report showed an improving picture both on the demand/activity front and regarding inflation, with prices received now outright contracting. Further, although higher on the month, employment readings still averaged to a contractionary picture. The future outlook also generally improved, although employment measures there weakened while price readings were little changed when combined. The further contraction in Capex intentions also supports the slightly negative general business activity outlook. Finally, this month’s special questions asked about changes in wages and compensation over the past three months, as well as expectations for changes in various input and labor costs for the current year. Around 55% of the firms indicated wages and compensation costs had increased over the past three months, while 45% reported no change. Most firms (58%) reported not needing to adjust their 2023 budgets for wages and compensation since the beginning of the year. However, almost 33% noted they plan to increase wages and compensation more than initially planned. The firms still expect cost increases across all categories of expenses in 2023, indicating a median expected increase of 3 to 4% for wages, down slightly from 4 to 5% from January, and of 4 to 5% for total compensation (wages plus benefits), unchanged from January.

*The current general activity reading moved further into contractionary territory, while future expectations moved higher to neutral

*Despite the weaker current headline reading, sub-indexes indicated a better picture, with sharp moves lower in price readings being the biggest takeaway of the report

*Cost increase expectation moved lower for 5 of the seven categories, with only energy cost expectations for the rest of the year rising
Technicals, Positioning, and Charts:
The Russell is outperforming the Nasdaq and S&P with Low Volatility, Growth, and Value factors, as well as Consumer Discretionary, Consumer Staples, and Health Care sectors all outperforming on the day. This week had a more defensive and yield-focused tilt regarding sectors, with Staples, Real Estate, and Utilities outperforming. Low Volatility and Growth, two often opposing factors, were the outperforming factors on the week.

@KoyfinCharts
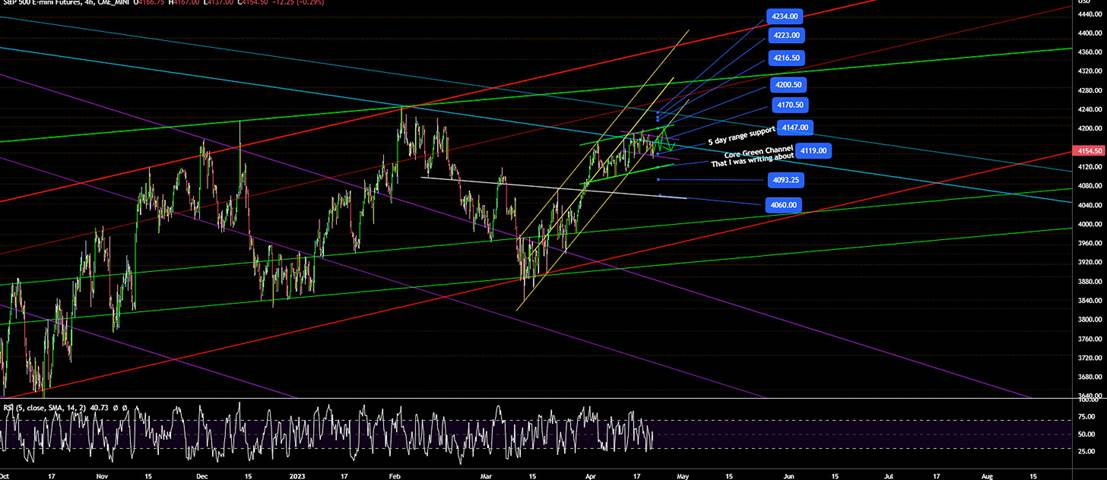
S&P optionality strike levels have the Zero-Gamma Level at 4106 while the Call Wall is 4150 and Put Wall is 4000. Today's OPEX is call-weighted, which removes positive gamma that suppresses volatility. Its reduction may lead to larger market swings next week with some mean reversion both in equity prices (lower) and implied vol (higher). Over the past week, the S&P has held a very tight range from 4110 ($SPY 410) - SPX 4160 ($SPY 415), so "larger market swings" should not be much of a challenge. This very tight trading range has helped drive implied volatility to major lows, as shown by the VIX reaching 16. After today’s OPEX, this range should become much weaker, and Spotgamma looks for a break to the downside into next week.

@spotgamma
S&P technical levels have support at 4145, then 4120, with resistance at 4165, then 4190. Daily price action has been very similar for the last week, with the S&P starting the day with a good flush lower to flip sentiment bearish, but then the dip has always promptly been bought, typically in the morning, to rally back to the 4170 zone, which has been h a magnet area all week. However, yesterday saw a breaking of the rising channel that had supported dip buying, and today’s close needs to recapture that channel, or a breakdown out of the recent range is likely.
@AdamMancini4
Treasuries are higher, with the 10yr yield at 3.57%, higher by 3 bps on the session, while the 5s30s curve is slightly flatter by .5 bps on the session, moving to 11 bps.

Four Key Macro House Charts:
Growth/Value Ratio: Value is higher on the day and week, with Small-Cap Growth the best-performing size/factor on the week.

Chinese Iron Ore Future Price: Iron Ore futures are lower on the day and the week.

5yr-30yr Treasury Spread: The curve is flatter on the day and week.

EUR/JPY FX Cross: The Euro was stronger on the day and the week.

Other Charts:

Market pundits are split on interpreting the weak breadth currently being seen. Bears note that only a few mega-cap names drive the rally, while Bulls see it as a contrarian indicator.

“The take on the Fed is that futures now see an almost 90% chance of another quarter-point rate hike next month, with prior assumptions of a reversal of that move by September now being pushed out to November and year-end rates nudging up past 4.50%.” - @PriapusIQ

The BofA’s Global Fund Manager Survey this month, which captured sentiment for the first time after the March mini-banking crisis, was the most bearish survey so far this year. It highlighted how investors still worry about high inflation, despite concerns about a financial disaster that would normally be considered deflationary. Fund managers had trimmed their stock allocation to 29% as sentiment dipped and growth expectations worsened to levels not seen since December 2022, with a net 63% of participants now expecting a weaker economy.
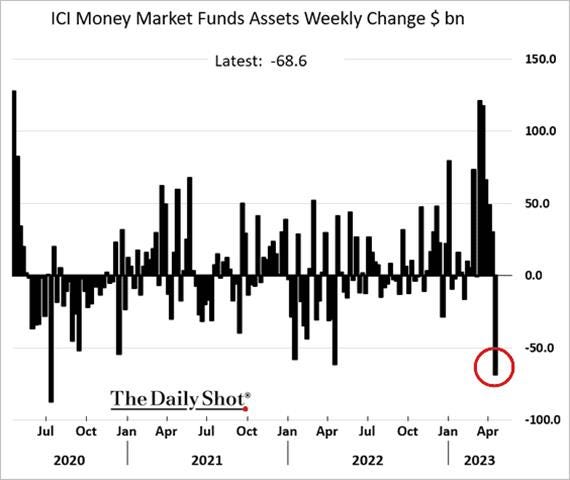
However, despite a still bearish tilt to investor sentiment, money markets saw a notable outflow this week.

The consensus outlook for earnings still expects a recovery in the second half of this year into next despite growing signs that profit margins will fall and growth is slowing.
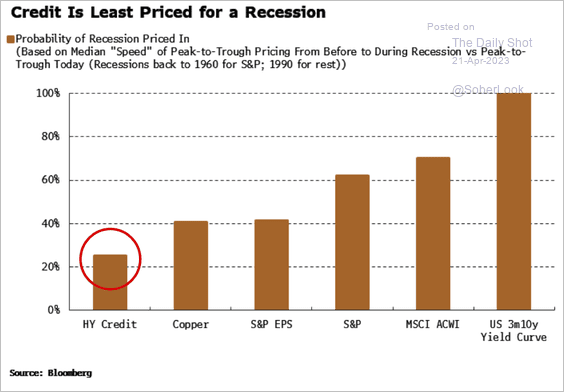
Credit markets are not pricing in a high probability of a recession based on a model used by Bloomberg.

“Hotel demand has slowed down in recent weeks, occupancy rates, RevPAR, and daily rates have started moving lower.” - Slok at Apollo

Consumers are not maxing out their credit cards and, in fact, are purchasing less on credit cards now than in 2019, according to data from BofA - @SamRo

The drag from housing is fading. The NAHB Housing Market Index improved to 45 in April, the fourth consecutive monthly gain. Changes in the NAHB HMI tend to mirror the broad ups and downs of real residential investment. Don't be surprised if housing lifts GDP in H1 '23. - @RenMacLLC
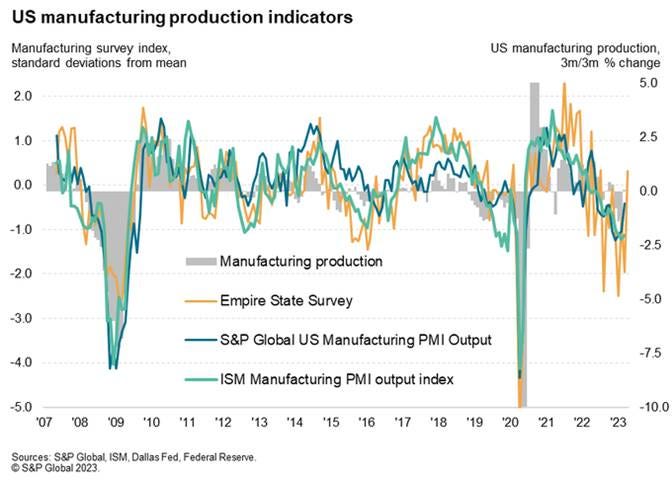
This week’s Empire State survey bodes well for US manufacturing in April. The volatile survey adds weight to the March rise in the S&P PMI for US factory output. - @WilliamsonChris

Continuing jobless claims came in at 1.865m for the week of Apr 7, above the est of 1.825m. These are now in line with pre-pandemic levels and where they were before the Fed retired transitory in Nov 2021. - @LizYoungStrat

The amount of money the US government has on hand to pay its bills jumped just $108.47 billion yesterday to $252.6 billion, a level last seen on March 20. That new figures suggest the drop-dead rate may be pushed back to sometime in late July or early August for the debt-ceiling to be reached.
Articles by Macro Themes:
Medium-term Themes:
China’s Post-Pandemic Life:
Stronger-Than-Expected: China’s economy expanded 4.5% in the first quarter, a better performance than the 4.0% pace expected by economists polled by the WSJ. Growth was driven by Chinese consumers, who began shopping, eating out, and traveling again after almost three years of stringent restrictions on daily life. The economy also benefited from government investment in infrastructure and a surprise pickup in exports in March. IMF Managing Director Kristalina Georgieva said China is likely to contribute around one-third of global economic growth this year. The fund expects China to expand by 5.2% in 2023, a recovery that should offer some support to trading partners, energy producers, and tourist destinations that flourish with healthy Chinese demand. - China’s Economy Rebounds After Three Years of Zero-Covid Isolation – WSJ

Longer-term Themes:
Cyber Life and Digital Rights:
End of End-to-End?: WhatsApp, Signal, and other messaging services have urged the U.K. government to rethink the Online Safety Bill (OSB). They are concerned that the bill could undermine end-to-end encryption, ] which means the message can only be read on the sender and the recipient's app and nowhere else. The bill would enable Ofcom to make companies scan messages - text, images, videos, and files - with "approved technology" in order to identify child sexual abuse material. WhatsApp and Signal said they would rather be blocked in the UK than weaken the privacy of encrypted messaging. - WhatsApp and other messaging apps oppose 'surveillance' - BBC

Energy’s Midlife Crisis:
Changing Exports: Australia sees its booming lithium sector matching thermal coal’s importance within five years as the world increasingly shifts from fossil fuels to clean energy. The data show the growing role the metals vital to global electrification, such as lithium and copper, are set to play in Australia, one of the world’s biggest fossil fuel exporters. Mining and energy account for almost 14% of the economy in the nation, which is currently the biggest shipper of lithium and the second-biggest provider of thermal coal. Australia has no existing industry that could fill the gaps left by the declining values of fossil fuels, as coal exports are expected to drop -70% in the next five years but will likely increase green energy endeavors such as hydrogen production. - Australia Sees Lithium Exports Matching Thermal Coal by 2028 - Bloomberg

Supply Gap: A lack of new copper mining activity has added to worries that there won’t be enough of the red metal for the energy transition, a popular topic at this week’s World Copper Conference in Santiago, Chile. South America currently dominates copper production, and Chile is the largest mined producer. Increasing mine output has proved a challenge, prompting a wave of deal-making in the industry and warnings of a serious supply shortfall over the next decade. “The market overall is pretty tight,” said Robert Edwards, a copper analyst at CRU. “Longer term, there’s a narrative around resource scarcity and the green transition with EVs and renewables as well as the build-out of electricity grids. On paper, it’s quite a substantial supply gap opening up over the next ten years,” he added.- Copper Shortage Threatens Green Transition – WSJ

Food: Security, Innovations, and Climate Change Implications:
The Threat of Shutdown: Kyiv on Monday said Russia had blocked inspections of vessels under a key safe-passage deal, the second time in a week that the corridor has ground to a halt. That’s happening as Poland, Hungary, and Slovakia recently banned imports of Ukrainian grain over concerns the supplies are hurting their domestic markets. It’s a setback for Ukraine, which, when faced with difficulties shipping by the sea in the wake of Russia’s invasion, had been sending some cargo by rail, truck, and river through its EU neighbors. Port-export and EU transit issues would make it much harder for Ukraine to supply developing nations and get vital foreign currency income while also threatening to push up global crop prices. - Ukraine Grain Is Snarled Again With Blockages Now on Two Fronts – Bloomberg

Resistance: Italy’s government introduced a draft law that, if approved, will ban the production and sale of cultivated food and meat. The draft “is based on the precautionary principle because there are no scientific studies yet on the effects of synthetic foods,” Health Minister Orazio Schillaci said in a press conference Tuesday. “We want to protect citizens’ health and to safeguard our nation’s heritage and our agri-food culture based on the Mediterranean diet.” While plant-based proteins are widely available, cultivated meat still has a long way to go before it hits supermarket shelves. Most startups are yet to scale up the technology before they even obtain regulatory approval. So far, only Singapore has permitted sales of cultivated chicken, while two companies have just cleared the first regulatory hurdle in the U.S. - Italy Wants to Ban Lab-Grown Meat to Protect Culinary Heritage - Bloomberg

Perilous Conditions: Russia’s invasion of Ukraine triggered a food crisis, leading to rising hunger and soaring food prices even as the international community cooperated to prevent a full-blown meltdown of the world’s food system. Although commodity prices have npw stabilized, global food stocks are still tight. In February, the USDA estimated that global exports of wheat in the past six months were approximately 37% lower than the year prior. While bumper crops of powerhouse suppliers such as Australia have helped, there have been poor harvests in other countries, such as Argentina. Furthermore, while Europe has largely been able to import enough fertilizer, Africa has not. African countries are stuck in a cycle of depending on humanitarian aid rather than increasing local production and thus helping to stabilize the global food system. All these factors are set to have a significant impact on hunger moving forward. Those people on the precipice in 2022 remain perilously close to severe food insecurity in 2023. - How to Prevent a Meltdown of the Global Food System – Foreign Policy

Authoritarianism in Trouble?:
Student Obstacles: Alarmed over young people increasingly proving to be a force for Democrats at the ballot box, energized by issues like abortion, climate change, and the Trump presidency, Republican lawmakers in several states have been trying to enact new obstacles to voting for college students. Attempts to cordon off out-of-state students from voting in their campus towns or to roll back preregistration for teenagers have failed in New Hampshire and Virginia. Even in Texas, where 2019 legislation shuttered early voting sites on many college campuses, a new proposal that would eliminate all college polling places seems to have an uncertain future. However in Idaho, Republicans used their power monopoly this month to ban student ID cards as a form of voter identification. - Republicans Face Setbacks in Push to Tighten Voting Laws on College Campuses - NYT

Happens Even in the U.S.: “Money is accountability,” announced Stephen Shackelford, a lawyer for the voting machine company Dominion, moments after a Delaware superior court judge announced that the company had settled its lawsuit against Fox News. Along with another voting technology company, Smartmatic, Dominion quickly became a major villain to the “right” due to the “big lie” that news networks like Fox News told its viewers. Dominion alleges that Fox did so as part of an editorial decision by Fox to feed conspiracy theories about the 2020 election to win back its viewers from competitors. Dominion argued in its motion for summary judgment Fox decided to commit to selling election lies, “caring more about protecting its own falling viewership than about the truth.” During the pretrial discovery process, Dominion unearthed an enormous amount of material damaging to Fox. The documents, which received extensive attention in the press, showed Fox hosts, producers, and leadership repeatedly expressing doubts about the conspiracy theories around Dominion before the network went on to air more of those claims anyway. We highlight this to show that even in our “advanced” nation, democracy is not as safe as often thought since much of the voting population can be swayed through lies and propaganda to believe the election process is rigged. Defamation suits will be increasingly used to fight back against people who knowingly spread lies, hopefully limiting the ability of politicians to abuse their power and spread falsehoods. - Dominion v. Fox Is Just the Beginning - Lawfare

ESG versus the World:
Tale of Two Continents: U.S. sales of ESG bonds are plunging amid pressure from investors and Republican politicians. Companies sold about $6 billion of ESG bonds last quarter, down more than 50% from the same time last year. The slump in issuance comes amid a political assault on ESG investing by some of the biggest names in the Republican party. Further, almost half of North America’s biggest investors worry that the politics around ESG securities exposes them to legal risks, according to a global survey of firms overseeing $27 trillion published last month. In Europe, the world’s leading market for ESG bonds, the story is different. ESG bond sales made up 39% of total corporate issuance in the first quarter, up from about 33% during the same period last year. And global sales of green bonds, the largest category of sustainable debt by amount, posted the busiest quarter since green bonds first emerged in 2007. - US ESG Bond Market Chokes on Republican Backlash, Investor Angst - Bloomberg

Cold Places (Deep Sea, Artic, and Space Colonization):
FOC: U.S. Space Command is on track to reach full operational capability before the end of 2023. As it prepares for full operational capability, Spacecom has done a lot of work to create “initial capability documents” that identify what capabilities the combatant command needs and send those demand signals to the rest of the Defense Department. The command currently has four of those documents focused on space domain awareness, space combat power, joint space command and control, and the joint space communications layer, with more on the way. The ICDs are extensively reviewed by the Pentagon’s joint chiefs of staff and have to be validated so funding can be requested and justified in DoD budget proposals. They have to consider global military needs for satellite services like communications, GPS navigation, and early warnings of missile launches. These requirements documents also are shaped by security concerns driven by the proliferation of anti-satellite weapons. - Spacecom to reach full operational capability by end of year, commander says - DefenseScoop

Other Articles of Interest:
Emerging Powers: Perceived threats to the dollar’s role in the global financial system are nothing new. However, for any BRICS (or BRICS-Plus) member to pose a strategic challenge to the dollar, it would have to permit foreign and domestic savers and investors to decide when to buy or sell assets denominated in its currency. That means no capital controls of the kind that China has routinely deployed. Until the BRICS and potential BRICS-Plus countries can find a credible alternative to the dollar for their own savings, the greenback’s dominance will not really be in doubt. Further, the fact that a US-excluding group of emerging powers has higher aspirations for itself does not necessarily mean anything for the US-centered financial system. - A BRICS Threat to the Dollar? – Project Syndicate – Jim O’Neill

Getting Closer: According to a classified U.S. intelligence report, Russia’s quest to sabotage Ukrainian forces’ internet access by targeting the Starlink satellite operations appears to be more advanced than previously known. Moscow has experimented for months with its Tobol electronic warfare systems to try and disrupt Starlink’s transmissions in Ukraine. Starlink has proved vital to Ukraine’s military, which relies on the small portable terminals to communicate across the battlefield and relay intelligence. Russian forces have had success disabling the Ukrainians’ ability to use other communications equipment, including radios and cellphones, but the satellite signals are harder to disrupt. - Russia unveils secretive weapon to target SpaceX’s Starlink in Ukraine – Washington Post

Securing Chips: European Union negotiators agreed on a final version of a €43 billion plan to make Europe a key player in a global race to ramp up the production of semiconductors. While Europe has ASML, one of the most valuable tech companies in the world with a monopoly on equipment needed to produce the most advanced chips, the Eurozone currently produces about 10% of the world’s semiconductors, primarily mature chips for the automotive industry. The EU has an ambitious goal of manufacturing 20% of the world’s semiconductors by 2030, focusing on cutting-edge chips. Politicians and experts, however, have raised concerns that the amount the EU is investing is still not enough to meet the 20% goal, especially as the industry becomes increasingly cautious about expensive investments thanks to decreased demand for chips and higher energy prices in Europe. - EU Advances €43 Billion Plan to Make More Semiconductors - Bloomberg

Podcasts:
VIEWS EXPRESSED IN "CONTENT" ON THIS WEBSITE OR POSTED IN SOCIAL MEDIA AND OTHER PLATFORMS (COLLECTIVELY, "CONTENT DISTRIBUTION OUTLETS") ARE MY OWN. THE POSTS ARE NOT DIRECTED TO ANY INVESTORS OR POTENTIAL INVESTORS, AND DO NOT CONSTITUTE AN OFFER TO SELL -- OR A SOLICITATION OF AN OFFER TO BUY -- ANY SECURITIES, AND MAY NOT BE USED OR RELIED UPON IN EVALUATING THE MERITS OF ANY INVESTMENT.
THE CONTENT SHOULD NOT BE CONSTRUED AS OR RELIED UPON IN ANY MANNER AS INVESTMENT, LEGAL, TAX, OR OTHER ADVICE. YOU SHOULD CONSULT YOUR OWN ADVISERS AS TO LEGAL, BUSINESS, TAX, AND OTHER RELATED MATTERS CONCERNING ANY INVESTMENT. ANY PROJECTIONS, ESTIMATES, FORECASTS, TARGETS, PROSPECTS AND/OR OPINIONS EXPRESSED IN THESE MATERIALS ARE SUBJECT TO CHANGE WITHOUT NOTICE AND MAY DIFFER OR BE CONTRARY TO OPINIONS EXPRESSED BY OTHERS. ANY CHARTS PROVIDED HERE ARE FOR INFORMATIONAL PURPOSES ONLY, AND SHOULD NOT BE RELIED UPON WHEN MAKING ANY INVESTMENT DECISION. CERTAIN INFORMATION CONTAINED IN HERE HAS BEEN OBTAINED FROM THIRD-PARTY SOURCES. WHILE TAKEN FROM SOURCES BELIEVED TO BE RELIABLE, I HAVE NOT INDEPENDENTLY VERIFIED SUCH INFORMATION AND MAKES NO REPRESENTATIONS ABOUT THE ENDURING ACCURACY OF THE INFORMATION