


Macro Headwinds vs. Micro Tailwinds: Half-Empty / Half-Full Risk Sentiments Continue – 4/28/2023
Color on Markets, Economy, Policy, and Geopolitics

Macro Headwinds vs. Micro Tailwinds: Half-Empty / Half-Full Risk Sentiments Continue – 4/28/2023
Daily/Weekly Price Action and Headlines:
Equities are higher on the day and the week, with a GDP report-driven short-covering rally moving the S&P back into its April range after weakness earlier in the week as stronger domestic final sales demand and a slew of better-than-expected earnings came forth
Treasuries are higher on the day and the week, with two-year yields hovering around 4% while the curve flattened as traders await to see what next week’s May FOMC meeting’s decision and April’s payroll report
WTI is higher on the day but lower on the week, with the risk-off tone earlier in the week driving prices to $74, but domestic inventory drawdowns and a more positive outlook on the U.S. consumer/demand are supporting prices today

Market’s Weekly Narrative:
The S&P and Nasdaq moved back into their April ranges after briefly breaking channel support earlier in the week as positive earnings and somewhat mixed data improved risk sentiment more generally. The drama surrounding First Republic Bank continued to weigh on the Russell, making small caps the worst-performing factor on the week as large-cap value outperformed thanks to continued pricing power from firms there, as seen in recent earnings reports. The Q1 GDP report had a misleading headline miss but showed a pick up in domestic spending after one looked through a large inventory drag. Elsewhere housing data was more mixed this week, indicating still tight inventory levels were problematic for activity, while core durable good orders fell for a second month and regional Fed manufacturing surveys contracted further, indicating a growing problematic picture for that sector. Treasuries rallied on the risk-off tone during the beginning of the week but also ended the week higher with the ten-year yield at 3.45%. Oil managed to stabilize and rally a little today, as inventory levels fell and a better picture of the U.S. consumer slightly negated increased supplies abroad from Russia and a still mixed view on China’s reopening. Industrial metal also recovered after a rough start to the week, but copper remains at the bottom of its recent range. Despite increased uncertainty over Ukraine’s grain corridor, the core of the agg complex continues to trend lower, reducing food price pressures. Finally, the dollar was little changed on the week, with Euro higher and the Yen lower on the week, keeping the $DXY around 101.5.
Deeper Dive:
This week brought a plethora of new information on both the macro and micro levels, with economic data releases and earnings results having something for everyone. At the highest level, it is clear we still have a historically tight labor market, although things look to be finally cooling, while the consumer continues to remain resilient, supported by rising real disposable incomes and stable household balance sheets. However, investment is slowing, albeit unevenly, and uncertainty remains high across all economic actors. As discussed last week, inflation is also a mixed picture depending on how you want to dissect it. Today’s PCE report didn’t change that picture much, while the employment cost index also remained unchanged from last quarter, giving the Fed enough “economic data ammo” to justify a 25 bps rate hike next week easily. Further, the deterioration in this week’s regional Fed manufacturing surveys, declining core capital goods orders, and more mixed housing picture negated improvements seen last week in regional surveys and S&P PMIs as well as stronger housing market readings. Earnings continued to come in better than expected this week, with expectations for Q1 earnings now projecting around a -2.5% YoY drop for the S&P verse the -5 to -7% decline expected at the start of the season. But the bar was set low going into the quarter, and guidance is still very defensive. Q1 performance instead looks like either a margin defense story due to pricing power or cost-cutting back to pre-pandemic levels exercise. In combination, the macro and micro-story continue to warrant a cautious approach to risk-taking, and we still see a rangebound tactical environment (sorry, we know we are a broken record here). This week served as a good reminder of that, with the breakdown of recent ranges earlier in the week eliciting a loud chorus of bears coming out of hibernation again. Unfortunately for them, sentiment quickly improved following a Q1 GDP report that showed stronger-than-expected final domestic consumption and, alongside an accumulation of better-than-expected earnings results, caused a short-covering rally yesterday. All in all, next week’s jobs report will likely determine whether equities and rates can move out of their April ranges in a sustainable fashion. Despite increases in claims and continued layoff headlines, we believe there is a greater chance it comes in line or beats expectations, sparking worries of another rate hike in June and materially weighing on risk sentiment as markets, already increasingly focused on the coming debt ceiling showdown and a weaker growth outlook, finally lose their October rally momentum.
The resilience of the consumer is a little frightening, especially if you are the Fed. Today’s personal income and spending data, as well as yesterday’s GDP report, confirmed that although the consumer is running out of excess savings, rising real disposable incomes should keep them spending as financial positions still remain generally healthy. Recent earnings reports confirm this strength, with firms maintaining pricing power beyond expectations. McDonald’s said diners shrugged off higher prices, and more U.S. customers visited the burger chain, boosting same-store sales by more than 12% in the first quarter. PepsiCo raised its full-year revenue forecast after demand remained strong despite raising prices by about 13% in Q1. Even as Americans pulled back on higher-cost items, General Motors bucked the trend, saying consumers’ willingness to spend big on high-end models prompted the automaker to raise its profit outlook for the year. However, April’s data shows more cautious consumer spending. “So far, in April... It's probably a little lower than it was for the month of March… the total spending year-over-year increases have slowed down. And I think that means it's a precursor to the economy being a little bit slower than we're seeing, and then frankly, consumers being more careful in the use of their cash," reported BoA President of Global Commercial Banking Alastair Borthwick.

*Consumers are employed with generally higher wages and continue to have strong account balances and good access to credit

*Cashholdings or savings, or however you want to classify them, are still above pre-pandemic levels

*Consumers are not maxing out their credit cards and, in fact, are purchasing less on credit cards now than in 2019, according to data from BofA

*but delinquencies are rising, especially among younger cohorts
Shifting away from the consumer, the manufacturing sector is starting to look like the canary in the coal mine regarding the coming slowdown in growth. With aggregate demand for goods continuing to fall and a further contraction in business equipment spending underway as well as cooling capex expectations, as seen in PMI surveys, the manufacturing sector will likely contract further. This may be a positive for inflationary pressures, although following back-to-back months of softening cost pressures in February and March, April’s data indicated a pick-up in input costs and prices received. Firms stated that more accommodative demand conditions allowed them to continue passing through higher interest rates, staff wages, utility bills, and material costs to clients. Of course, with numerous regional Fed manufacturing and the ISM PMI surveys showing demand contracting, the ability to pass on cost increases will likely weaken. As a result, the supply-side impairments that constrained capacity in manufacturing and ended up driving overall cost-push inflation out into the service sector are effectively gone. Of course, labor shortage also played a role in service cost pressures, but we believe wage pressures have also peaked. As a result, if manufacturing is cooling in both activity and inflation terms, then the service sector will follow. We don’t see the recent pick-up as a reversal in the disinflationary trend. Instead, we highlight the weakness in softer data as seen in regional Fed surveys and PMIs, and are closely watching the harder data, such as industrial production and durable goods, for indications of further real weakness after the strong start to the year, something we think is coming.

*Real spending on core capital goods has been declining for sometime

*Next week’s ISM Manufacturing PMI report will likely remain in contractionary territory, given what April’s regional Fed surveys have shown

*The strong start to the year in manufacturing production is increasingly looking like it will continue to reverse in April
In summary, we are in this period right now where there is still a tight labor market and a resilient consumer. The Fed’s still fighting inflation which remains sticky by official measures. It’s unknown what the cumulative impact of the Fed’s tightening will be on second-half economic and corporate profit growth this year. Until that is resolved, markets are stuck in a trading range, and we believe we are near the high of that range for yields and equities. Looking forward, manufacturing activity has historically led the service sector in indicating where overall economic growth is going, just as PPI leads CPI in dictating where inflation goes, and there is increasing evidence that manufacturing activity and price pressures there are slowing down. As a result, although we have low conviction in our outlook, we believe a period of below-trend growth is currently upon us due to lower levels of investment (both actual and through inventory channels) but also remain in the “soft landing” camp due to the resilience of the consumer. We look for a change of tune out of the Fed before we would increase our risk allocation given the risk that further hikes are coming and believe it's too early for markets to truly price forward any coming pick-up in growth (likely only in mid-’24). As a result, any further move higher in equities will be mainly driven by multiple expansions and not earnings growth, something dependent on real rates and, ultimately, Fed policy, which, as stated, is still unknown.

*The word recession is useless, as the degree of the slowdown or contraction is much more critical when making investment decisions, and many still don’t see it…

*…however, other recession models and historical indicators show a high probability of a recession soon

*The market continues to price in deep rate cuts over the next 18 months amid concerns about how banking sector weakness and the debt ceiling may affect growth and the Fed
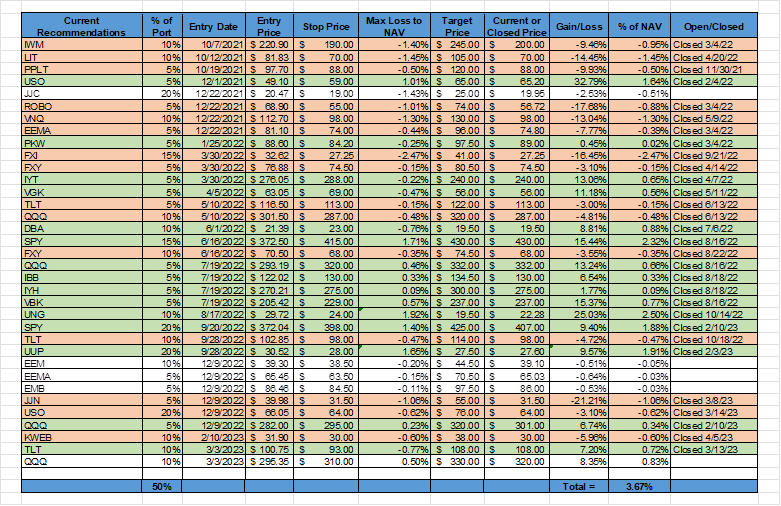
*We have again moved up all stops with the hope that an early May rally will see us hit our Nasdaq target before more hawkish Fed worries come forward. We are willing to be more patient with our copper and EM longs
Econ Data:
The U.S. economy grew by an annualized 1.1% in Q1, slowing from a 2.6% expansion in the previous quarter and missing market expectations of a 2% QoQ growth rate, a preliminary estimate showed. The GDP deflator rose to 4.0%, putting nominal GDP up 5.1% in the quarter. Real PCE rose at an annualized rate of 3.7% (vs. 1% in Q4), while real business fixed investment fell to an increase of 0.7% (vs. 4%), as equipment spending fell by -7.3% (vs. -3.5%). Intellectual property investment also cooled in the quarter to 3.8% (vs. 6.2%), while nonresidential structures investment remained strong, rising 11.2% (vs. 15.8%). Real residential investment fell by -4.2%, recovering from a -25.1% decline last quarter. Inventories were liquidated in the first quarter, subtracting 2.3% points from first-quarter GDP growth, while a slight narrowing of the trade gap added 0.1% points.
Why it Matters: The headline number would indicate that Q1 saw the weakest pace of expansion since Q2 2022, as business investment growth slowed down, inventories declined, and residential investment contracted for the eighth consecutive quarter. However, private domestic sales accelerated, and the inventory drag was the largest one in two years. When combining consumption and investment (C+I), demand rose 7.3% over the quarter and at a 6.4% annualized rate. Price pressures came in ahead of expectations as core PCE prices rose by 4.7% over the last four quarters, and the GDP deflator is 5.3% on the same basis. As a result, the Fed did not see a meaningful slowing in excess demand or inflationary pressures in Q1.

*Without the drag from inventories, there would have been a near 4% QoQ real growth rate in the U.S. economy
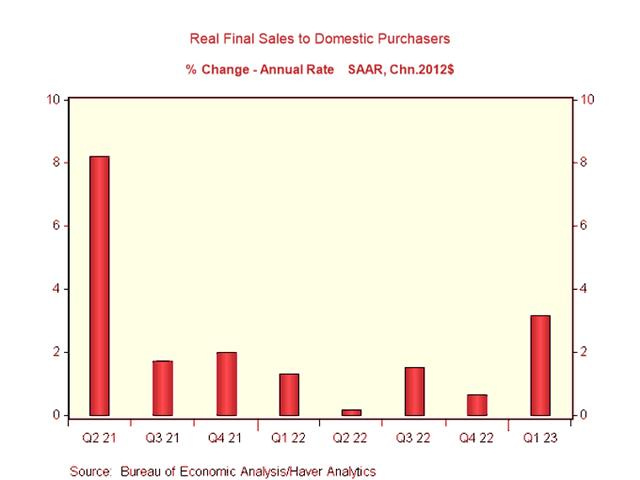
*Real GDP ex-inventories and trade (final sales to domestic purchasers) advanced 3.2% SAAR, the fastest pace since Q2 2021

*Business investment is slowing, with equipment spending moving further into negative territory, while residential investment rebounded after three very weak quarters

*Much of the increase in consumer spending was negated by inventory liquidation; however, total private domestic sales rose by 2.9% QoQ (vs. 0% in Q4)
The headline personal consumption expenditure price index increased 0.1% in March, easing from a 0.3% rise in February, moving the annual rate to 4.2% from 5.1% YoY in the prior month. Core PCE rose 0.3% in March, the same pace as the prior month, moving the annual rate to 4.6% from 4.7% YoY in the prior month. The cost of goods fell by -0.2% MoM (vs. 0.1% MoM in February), and services inflation slowed to 0.2 % MoM (vs. 0.4% MoM). Food prices declined by -0.2% MoM, while energy prices dropped by -3.7% MoM.
Why it Matters: March was the smallest increase in headline PCE inflation since July 2022. However, core PCE has risen at a 4.9% annualized rate over the last three months, faster than the year-over-year rate of 4.6%. Prices for core services PCE prices excluding housing, which Fed officials are now focused on, rose by 0.2% in March. Both January and February were also revised higher, making the annualized three-month rate 4.6% versus a 4.4% rate over the last year. Hence the Fed can’t take comfort that a meaningful deceleration is occurring, given the short-term inflation rates have moved above year-on-year ones.

*There has been a slowing in monthly gains after the hot start to the year, but its too early to tell if this is a sustainable trend

*A deceleration in the headline PCE rate is occurring fast as, and coming monthly comparables will support this until July

*The annualized three-month rate is above the year-on-year and annualized six-month, showing the Fed that core inflation is not yet meaningfully slowing down
Compensation costs increased 1.2% in the first quarter, following a 1.1% rise in the previous period and above market expectations of 1.1%. Both wages and salaries and benefits costs rose by 1.2% from the last quarter. On an annual basis, the NSA ECI slowed from 5.1% in December to 4.8% in March. However, private sector wages showed no slowing on that basis, gaining 5.1% over the prior year, which was the same increase as recorded in December.
Why it Matters: The Employment Cost Index is a Powell favorite, and wages and salaries for private sector workers excluding incentive-paid occupations showed no meaningful deceleration in Q1. Further, the increases were broad-based, with the fastest gains seen in other services (1.7%), accommodation and food services, professional and business services, credit intermediation, and construction (all 1.5% in the quarter).

*There were little changes in the quarterly ECI increases, keeping annual levels sticky
Personal income rose by 0.3% in March, maintaining the same growth pace as in February and slightly exceeding market expectations of a 0.2% rise. The increase was driven by a 0.3% MoM increase in compensation, led by private wages and salaries. Additionally, personal income receipts on assets and rental income of persons grew by 0.5% MoM and 1.4% MoM , respectively. However, proprietors' income saw a -0.1% decline due to falling farm income. Meanwhile, personal current transfer receipts remained unchanged, mainly due to a decrease in "other" government social benefits as pandemic-related emergency benefits for the Supplemental Nutrition Assistance Program ended. Personal spending was unchanged in March, following a downwardly revised 0.1% increase in February and compared with market forecasts of a -0.1% decline. Consumption of services saw a 0.4% increase, driven by higher spending on housing and utilities as well as healthcare services. In contrast, consumption of goods decreased by -0.6%, with lower spending on motor vehicles and parts as well as gasoline and other energy goods. The personal saving level was $1 trillion in March, and the personal saving rate was 5.1%.
Why it Matters: Real disposable personal income increased by 0.3% in March, while real personal consumption expenditures were flat, helping the savings rate move from 4.8% to 5.1%, maintaining a positive trend for almost a year now. Further, Real incomes less transfer payments by 3.6% MoM and are higher by 2.1% over the last year showing consumption is still broadly supported by incomes. Spending favored services over goods again, something that is now a common theme. Goods spending is now lower by -21.5% annually, while services spending has risen by 13% YoY. This will eventually have to correct to a more historically normal relationship, and despite recent drops/stability in consumer confidence, there is no sign this is happening yet.

*Rising income and flat spending are supporting the households balance sheet
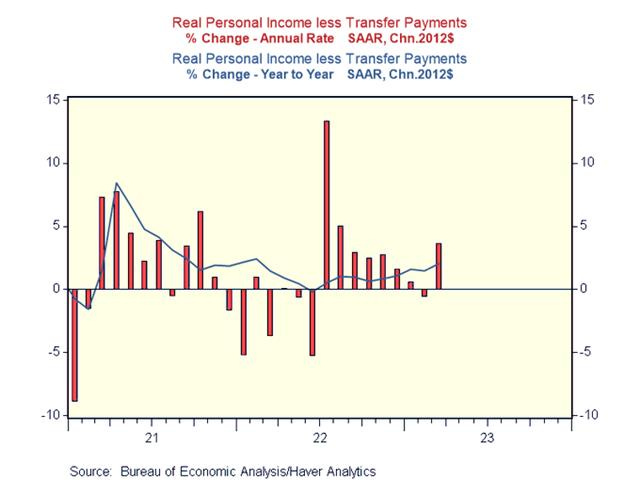
*Personal income less transfer payments is showing no signs of a stretched consumer yet
New orders for manufactured durable goods rose by 3.2% in March, recovering from a revised -1.2% decline in February and beating market expectations of a 0.7% increase. A 9.1% increase in demand for transportation equipment drove the headline increase after two consecutive months of decreases there, boosted by orders for both civilian (78.4%) and defense aircraft (10.4%). New orders of vehicles were down by -0.1%, while demand was up for computers and electronic products (1.9%) and electrical equipment, appliances, and components (0.8%), but was little changed for machinery (0.1%), fabricated metal products (0.1%). Orders for non-defense capital goods, excluding aircraft, a closely watched proxy for business spending plans, were down by -0.4% in March, following a -0.7% drop in February. Overall shipments rose 1.1%, but excluding transports, fell by -0.2% MoM.
Why it Matters: Despite the drop in core capital goods orders, the underbelly of the report saw new demand for most categories higher in March on a non-inflation-adjusted basis. Slightly positive increases for machinery and larger monthly increases for computers and electoral equipment and appliances show some resilience in demand for larger ticket items outside transports. As a result, despite the headline beat being driven by outsized increases in the often volatile aircraft category, broader increases/stabilization elsewhere shows that a second month of declining core capital goods is not yet too alarming. Finally, manufacturing with unfilled orders jumped 4.5% on the month after notable declines over the last two months, with total unfilled orders increasing by 0.4% MoM.

*It was all about transports, with nondefense aircraft orders higher by 78.4% MoM after large declines in previous months

*Core capital goods were lower, leading to weaker investment readings in this week’s GDP data
The U.S. trade deficit in goods narrowed to $84.6 billion in March from the upwardly revised $92 billion in the previous month. Exports grew by 2.9% to $172.7 billion, supported by strong demand for industrial supplies (6.4%), consumer goods (2%), and automotive vehicles (4.3%). Imports contracted by -1% to $275.3 billion due to lower purchases of capital goods (-2.9%) and industrial supplies (-2.7%). Wholesale inventories increased by 0.1% in March, the same pace as in the prior month. Inventories were up 0.4% for nondurables after a -0.5% drop in February, while durable inventories fell by -0.1% MoM, following a 0.5% rise in the prior month. Compared to a year earlier, wholesale inventories advanced 9.3%. Retail Inventories increased by 0.7% MoM and when excluding autos, increased by 0.4% in March, following a revised -0.1% decrease in the prior month and above market forecasts of a 0.1% rise.
Why it Matters: The U.S.’s exports of goods are higher by 2.7% YoY, mainly due to increases in capital (6.6%) and consumer (10.5%) goods. This trend continued in March, after a weak February, showing external demand still remains, and a weaker dollar is likely helping. Interestingly, imports of goods are down -12.3% YoY due to broad declines but mainly from industrial supplies (-24.1%) and consumer goods (-20.6%), falling notably over the last year. Finally, wholesale durable goods inventories took a breather on the month, effectively flat in March but still higher by 12.8% on an annual basis. This countered the increase in retail inventories, which was driven higher by motor vehicle inventories that rose by 1.5% in March after rising 1.4% in February.

*The trade deficit continues to trend lower as only consumer goods and foods & beverages were higher on the month

*On an annual basis, exports are still expanding while imports are now lower by 12.3%

*Growth in wholesale inventories continues to cool while retailers have maintained positive momentum throughout ‘23

*As with all things not reported in real terms, actual inventory levels are much lower when adjusted for inflation
Sales of new single-family houses jumped by 9.3% to a seasonally adjusted annualized rate of 683K in March, the highest in a year, and beating forecasts of 630K. Sales jumped 170.8% to 65K in the Northeast, rose 29.8% to 161K in the West, and 6% to 71K in the Midwest but fell by 5.4% to 386K in the South. The median price of new houses sold was $449.8K, while the average sales price was $562.4K, compared to $435.9K and $511.8K, respectively, a year ago. There were 432K houses left to sell, the lowest since April of 2022, corresponding to 7.6 months of supply at the current sales rate.
Why it Matters: New home sales are now back/close to pre-pandemic average levels after the pick-up in February. There was a notable decrease in the months of supply; however, there is still a historically high number of homes in the pipeline, with 267K under construction and 94K not started. This works out to 1.25 months of completed supply, 4.7 months of homes under construction, and 1.7 months of potential inventory that has not been started but has been permitted, according to data provided by Bill McBride at Calculated Risk. In summary, there is still a poor existing homes inventory story which is supporting demand for new homes. However, the large number of homes under construction suggests we might see a further increase in completed inventory over the next several months, potentially putting further pressure on prices already lower due to affordability challenges.

*New home sales picked up to more historically average levels while the months of supply continued to trend lower

*Completed inventory rose to a more normal level while inventory “not started” and “under construction” fell

*New homes fell slightly to 34% of the total housing inventory
Pending home sales fell by -5.2% in March, missing market expectations of a 0.5% MoM increase. Pending home sales declined in the Northeast (-8.1%), in the Midwest (-10.7%), and in the West (-8%) but rose slightly in the South (0.2%). On an annual basis, pending home sales are now lower by -23.2%.
Why it Matters: “The lack of housing inventory is a major constraint to rising sales," said NAR Chief Economist Lawrence Yun. "Multiple offers are still occurring on about a third of all listings, and 28% of homes are selling above list price. Limited housing supply is simply not meeting demand nationally." He forecasts that mortgage rates will drop to 6.0% in 2023 and 5.6% in 2024. "Sales in the second half of the year should be notably better than the first half as job gains continue and more favorable mortgage rates are expected," said Yun. "Sales of new homes are already matching 2019 pre-COVID activity and are expected to increase in 2023, largely due to plentiful inventory in this segment of the market." Although we don’t see plentiful inventory anywhere, as highlighted above, increasing amounts of new homes are coming to market. This will reduce pressure on pending home sales which clearly still have historically poor inventory.

*March is usually a strong month for pending home sales, but limited inventories are hurting activity even as demand seems to be strong
The S&P CoreLogic Case-Shiller 20-city Home Price Index rose by 0.2% NSA in February, moving the annual rate to 0.4% YoY, the smallest increase since 2012, compared to a 2.6% rise in January, and market forecasts of a flat reading. The National Home Price NSA Index, covering all nine U.S. census divisions, reported a 2.0% annual gain in February, down from 3.7% in the previous month. Miami, Tampa, and Atlanta again reported the highest year-over-year gains among the 20 cities in February. Separately, the average price of single-family houses with mortgages guaranteed by Fannie Mae and Freddie Mac rose by 0.5% from a month earlier in February, picking up from the downwardly revised 0.1% increase in the previous month and compared to market expectations of a -0.1% decline.
Why it Matters: Housing prices increased slightly in February, partly due to falling mortgage rates supporting demand and continued low inventory, after seven months of declines. “Negative home price trends moderated in February 2023,” says Craig J. Lazzara, Managing Director at S&P DJI. “The moderation we observed nationally is also apparent at a more granular level. Before seasonal adjustment, prices rose in 12 cities in February (versus only one in January). Seasonally adjusted data showed nine cities with rising prices in February (versus five in January). With or without seasonal adjustment, most cities’ February results showed improvement relative to their January counterparts.” However, Lazzara went on to say that the results pre-date the banking turmoil in March, with expectations that tighter mortgage financing and the expectations of economic weakness are likely to remain a headwind for housing prices for some time.

*Both Case-Shiller and the FHFA housing price indexes increased in February after half a year of negative or little increases.

*Housing price leadership has remained the same, while the last ten months (in black above) show a shift in the normal historical relationship between prices (which have fallen) and low levels of inventory
The Conference Board’s Consumer Confidence Index fell to 101.3 in April, down from 104.0 in March. The Present Situation Index increased to 151.1 from 148.9 last month; however, the Expectations Index fell to 68.1 from 74.0. Consumers’ “assessment of current business conditions” and “appraisal of labor markets” improved somewhat in April. Consumers became more pessimistic about their outlook on short-term business conditions as well as their labor market outlook, but short-term income prospects were more favorable. Consumer inflation expectations over the next 12 months remained essentially unchanged from March at 6.2%.
Why it Matters: The April survey was fielded from April 3 to 19, about three weeks after the recent bank failures. “While consumers’ relatively favorable assessment of the current business environment improved somewhat in April, their expectations fell and remain below the level which often signals a recession looming in the short-term,” said Ataman Ozyildirim, Senior Director, Economics at The Conference Board. “Consumers became more pessimistic about the outlook for both business conditions and labor markets. Compared to last month, fewer households expect business conditions to improve, and more expect worsening of conditions in the next six months. They also expect fewer jobs to be available over the short term. April’s decline in consumer confidence reflects particular deterioration in expectations for consumers under 55 years of age and for households earning $50,000 and over.” Finally, the Expectations Index has remained below 80, the level associated with a coming recession, every month since February 2022, with the exception of a brief uptick in December 2022.

*Present employment views are the only positive contributing factor to the headline index, with future employment, income, business, and present business all negative for three months now

* The difference between “jobs plentiful” and “jobs hard to get” edged higher, indicating a still strong labor market, while buying big-ticket items such as appliances remains poor
The Chicago Fed National Activity Index came in at -0.19 in March, the same as in February, worse than forecasts of -0.02. Production-related indicators fell to a contribution of -0.08, down from +0.04 in February, and the contribution of the personal consumption and housing category became more negative, moving to -0.10 from -0.05 in February. On the other hand, the contribution of the sales, orders, and inventories category improved to -0.02 from -0.09, and employment-related indicators became positive contributors, rising to +0.01, up from -0.09 in February. The CFNAI Diffusion Index, a three-month moving average, increased to +0.14 in March from +0.10 in February.
Why it Matters: The CFNAI indicated steady but below-trend growth in March economic readings. Three (production-related, consumption & housing, and sales & inventories) of the four broad categories of indicators used to construct the index made negative contributions in March, and two categories (production and consumption & housing) deteriorated from February. The weighted average of the 85 indicators used in the index summarized what we have been seeing in individual data releases, a cooling but still somewhat steady economy. This will give Fed officials comfort that growth is now below trend while changes in supply and demand balances continue to indicate inflation will trend back to target.

The Dallas Fed’s Manufacturing General Business Activity Index for the Texas region declined to -23.4 in April from -15.7 in March, its lowest reading in nine months and below market expectations of -14.6. Activity and demand measures were generally stronger, with Capacity Utilization (3.9 vs. 2.3 in March), Shipments (-2.8 vs. -10.5), New Orders (-9.6 vs. -14.3), and Growth Rate of Orders (-11.1 vs. -15.2) improving while Production (0.9 vs. 2.5) and Unfilled Orders (-11.3 vs. -9.4) weakened. Delivery Times (-0.1 vs. 0.6) and Inventories (-3.7 vs. 6.6) moved into near-neutral contractionary territory. Labor market measures suggest moderate Employment (8 vs. 10.4) growth, but there was a slight decline in Hours Worked (-2.7 vs 2.6). Price pressures were little changed on the Prices Paid (19.5 vs. 20.3) and Prices Received (8.4 vs. 7), while Wages and Benefits (37.6 vs. 30.5) did jump higher into expansionary territory. Capital Expenditures (2.8 vs. 2.9) were little changed, remaining slightly expansionary. The company outlook index remained negative, ticking down two points to -15.6. The six-month ahead General Business Activity (-16.6 vs. -11.2) further contracted, with a broad decline in subindexes, although expectations for new orders, employment, hours worked, and general company outlook improved.
Why it Matters: Declines in broader business conditions countered somewhat improved production, demand, and employment sub-index readings. An also still expanding, yet near neutral, capital expenditure reading indicates that firms remain committed to growing their business despite a negative company and general activity outlook and high level of uncertainty. Combined with a weaker six-month general business outlook but also expanding expectations for new orders and employment sub-index readings, its clear firms remain highly uncertain and generally negative but still expect business to expand, albeit at a slower pace. Finally, the significant drop in future price readings and lower expected wages bodes well for the Fed, showing a weaker level of entrenchment in inflation expectations at the firm level in the Texas region.

*The move lower in the general business activity index was not mirrored by production, demand, and labor sub-indexes

*Inflationary-related readings were mixed at the current level but fell notably for six-month ahead expectations, while new orders and employment readings increased for both

*Selected comments from the 82 manufacturing firm respondents were notably more negative this month as recessionary talks continue to have a self-reinforcing effect
The Richmond Fed’s Manufacturing Index fell to -10 in April from -5 in March. Local Business conditions (-19 vs. -12) worsened. Activity and demand measures, seen in Shipments (-7 vs. 2 in March), Capacity Utilization (-14 vs. -10), New Orders (-20 vs. -11), and Backlog of Orders (-31 vs. -14), all contracted further. Inventory measures moved further into expansionary territory, indicating that firms had too much inventory, while Vendor Lead Times (-13 vs. -18) moved higher but remained contractionary. Spending on Capital Expenditures (-2 vs. 2), Equipment and Software (-2 vs. -1), and Services (-16 vs. -10) all worsened. However, the first two are still near neutral levels. Employment Measures were mixed with the Number of Employees (0 to -5) moving to neutral while Wages (25 vs. 27) and Availability of Skills Needed (-12 vs. -3) weakened. On the price front, both Prices Paid (7.57 vs. 6.24) and Prices Received (5.63 vs. 5.59) edged higher. Expectations also worsened at the sub-index level, with demand measures moving into contractionary territory and activity expected to cool. Price pressures were also mixed, changing little on aggregate, while employment measures saw expected headcount to increase but some relief to wage pressures.
Why it Matters: The April headline index decline was matched by broad weakness at the subindex level at both the current and future levels. It is clear that manufacturing activity is contracting in the fifth district. Firms find themselves with too much inventory and a more neutral desire to expand capacity, given their falling utilization of existing capacity, contracting new orders, and existing backlogs of orders. Increases in inflationary pressures were also notable at the prices paid level, although wage measures fell. Finally, the continued worsening view of local business conditions reinforce the general negative tone of the report.

*There is a broad cooling in manufacturing activity in the 5th district with little positives in April’s report

*Price pressure remerged in April while wage pressures weakened, although they remained at still highly elevated levels

*The majority of sub-indexes weakened, and the ones that didn’t were mainly due to inflationary pressures or increased inventory levels
The KC Fed’s Manufacturing Index fell to -10 in April from 0 in March and below market expectations of 3. Activity and demand measures all softened with Production (-21 vs. 3), Shipments (-13 vs. 6), New Orders (-21 vs. -13), New Orders for Exports (-13 vs. 3), and Backlog of Orders (-26 vs. -18) all contracting, with the last two now being notably in deceleration mode. Employment (-1 vs. 18) also moved notably lower to a more neutral reading, although there was an improvement in the Average Workweek (1 vs. -10) length. Inventory measures also moved into contractionary territory after being near neutral readings last month, while Supplier Delivery Times (-3 vs. -6) moved modestly back towards neutral. Inflationary measures increased, with Prices Received (21 vs. 13) and Prices Paid (32 vs. 30) increasing. Six-month ahead expectations were slightly better, with more stable and expansionary readings from activity and demand, while hiring and Capex intentions remained positive. Inflation expectations fell slightly on aggregate but remained historically high.
Why it Matters: The current situation in the 10th district for manufacturing firms is not good. The April report showed a broad deceleration in activity and demand, a neutral hiring situation, and increased price pressures. The six-month ahead outlook was a little better but is generally neutral. With flat Capex intentions and shrinking inventory levels, expectations for expanding new orders and positive hiring intentions are neutralized. Selected comments also still indicated problematic input cost increases and shortages of skilled labor, although a few respondents noted improvement in both areas. The month’s special question asked about job openings and the availability of credit. A majority of firms reported the number of job openings has stayed the same or changed only slightly from the beginning of the year, while most firms that have sought financing for desired short-term uses have reported no difficulty obtaining credit.

*Notable drop in the overall index back into contractionary territory from neutral last month due to broad drops in production and demand measures

*The majority of current sub-indexes contracted in April, with price measures being the unfortunate exception

*The majority of firms have seen no difficulty obtaining financing for desired short-term uses such as paying workers and acquiring inventories of material or supplies or have not needed such credit
Technicals, Positioning, and Charts:
The Russell is outperforming the S&P and Nasdaq with Small-Cap, High Dividend Yield, and Value factors, as well as Energy, Financials, and Materials sectors all outperforming on the day. This week saw tech and communication sectors, as well as the growth factor, outperform as yields/real rates fell. Stronger-than-expected earnings also supported these areas. However, short covering saw energy and real estate sectors also outperform, while earnings out of staples showed better pricing power and earning results, helping that sector rise on the week.

@KoyfinCharts
S&P optionality strike levels have the Zero-Gamma Level at 4111 while the Call Wall is 4200 and Put Wall is 4000. Yesterday's rally was very "chasey," particularly in tech, as an initial negative delta response at 4100 brought on by traders selling calls and/or buying puts reversed. However, around 1:30 PM ET, several large waves of call-driven positive delta flows occurred, driving the 1.9% move higher and crushing implied vols. Call volumes were relatively elevated, indicating real buyers were at work, increasing the chance of a positive follow-through in price action into May. With the VIX now near 16 again and next week’s FOMC and payrolls report the next catalysts, there is a bullish tilt to market optionality currently, but the call wall needs to move higher.

@spotgamma
S&P technical levels have support at 4160, then 4130, with resistance at 4200, then 4225. The S&P remains in a dip-buying regime. The dips vary in size and length, but an underlying bid always exists. Since the March low, there have been two 100+ point dips: March 22nd, which was 130 points, and the current leg, which was also 130 points, and then bought. The S&P is back in its green upsloping channel, with support around 4120-30 and resistance 4200-4205, and this has been the real April story. The purple channel inside it is now resistance, currently 4180 or so, where markets faded today, and has support at the 4145 area. This is technically a bull flag, and a breakout would target 4200-05. The uptrend channel from the March low, seen in yellow, is the ultimate support and resistance, and a break below that would indicate a bear market has likely started.

@AdamMancini4
Treasuries are higher, with the 10yr yield at 3.48%, lower by around 8 bps on the session, while the 5s30s curve is slightly flatter by 1.5 bps on the session, moving to 14.5 bps.

Four Key Macro House Charts:
Growth/Value Ratio: Value is slightly higher on the day and week, with Large-Cap Value is the best-performing size/factor on the week.

Chinese Iron Ore Future Price: Iron Ore futures are slightly lower on the day and the week.

5yr-30yr Treasury Spread: The curve is flatter on the day but steeper on the week.

EUR/JPY FX Cross: The Euro was stronger on the day and the week.

Other Charts:
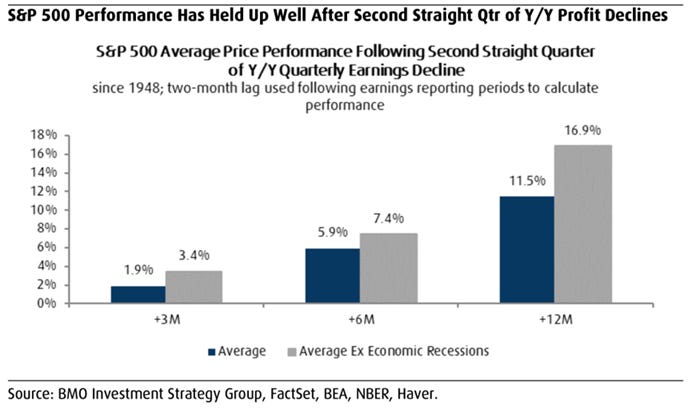
Stocks often rally after two consecutive quarters of negative earnings growth. During the 16 profit recessions since 1948, the S&P 500 rose 5.9%, on average, six months after the second consecutive annual earnings decline, with gains occurring 75% of the time. The average price return improved to 7.4% when stripping out periods when an economic recession also occurred. Gains were also common throughout the duration of these earnings recessions, with the S&P 500 only posting losses four times and the average annualized price return being 21.7%. - Brian Belski, chief investment strategist at BMO Capital Markets

The above chart shows how the market has traded after making a major low without making a new low within the subsequent six months (which Oct 2022 low qualifies for). General drift upwards, with a couple of exceptions. - @bespokeinvest via @RyanDetrick

Falling Conference Board Consumer Expectations correlated well with real future consumption prior to the pandemic, currently signaling a further slowdown is coming.
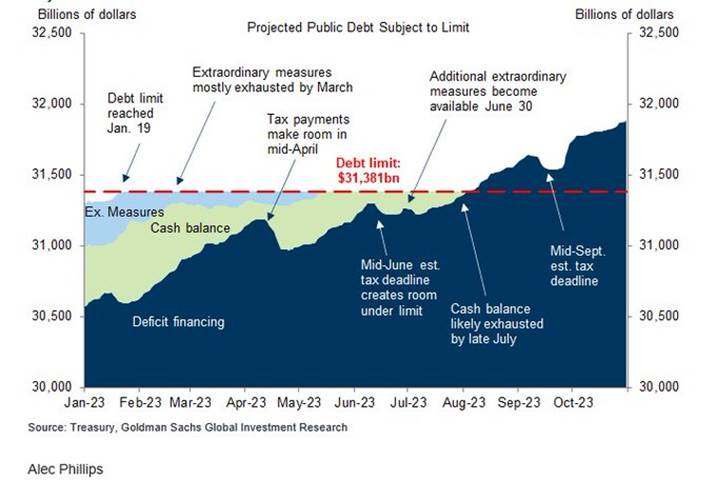
Following the US Treasury taking in a large amount of tax receipts on Apr 25, GS sees the debt limit timeline to be late July. Some were predicting early June. One month T bills have moved in response. @kit_lowe on GS Research
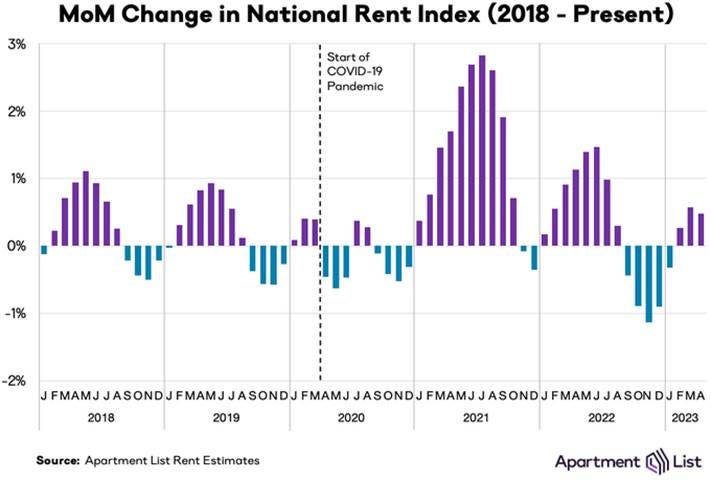
Nationwide rents increased another 0.5% in April, but even as the busy season picks up, rent growth is coming in slower than in previous years. When prices skyrocketed during the pandemic, April rent growth clocked in at 1.1% in 2022 and 1.7% in 2021. - @ApartmentList
Articles by Macro Themes:
Medium-term Themes:
Labor Markets Loosening:
Growing List: BuzzFeed, Lyft, Whole Foods, and Deloitte all recently announced layoffs affecting thousands of U.S. workers. They join a growing list of companies cutting back on their workforce this year amid concerns about economic uncertainty, as well as the need to rightsize after going on a hiring spree during the pandemic. Around 89,703 layoffs were announced in March, a 15% gain from February, according to a report from global outplacement firm Challenger, Gray & Christmas. U.S. employers added 236K jobs in March, below expectations and a sign that the Federal Reserve’s yearlong rate-hiking campaign to chill inflation is now also cooling the labor market. CNN has created a web page to monitor the large firm’s layoffs. - 2023 layoff tracker: The latest on which companies have announced job cuts - CNN

China’s Post-Pandemic Life:
Uneven Recovery: With China’s economic recovery well on track, top leaders will likely turn their policy focus now to boosting business confidence, increasing jobs, and strengthening the property market without adding extra stimulus. “The People’s Bank of China could switch to a wait-and-see mode once the economy is back on track and prepare for policy normalization,” said Yu Xiangrong, chief China economist of Citigroup. With local governments keen to “restore fiscal resilience,” there are reduced chances for generous tax and fee cuts, an upward revision to the quota for special local bonds, or a further expansion in financing tools from state policy banks, he also added. However, the recovery is fairly uneven. The job market remains subdued, with youth unemployment climbing to a near-record high. Property investment continued to contract, and the rebound in exports in March may be short-lived given declining foreign demand and heightened geopolitical tensions. - China’s Politburo Likely to Shift Focus From Stimulus to Reforms - Bloomberg

Good Demand = Weak: Profits at industrial firms in China continued to plunge in the first three months of the year. A pick-up in factory production failed to offset producer deflation, as factories are unable to boost prices, which is weighing on their profits. Industrial profits in the January-March period declined by -21.4% from a year earlier. There were some positive signs. Car industry profits grew by 9.1% in March from a year earlier, driven by recovering car demand and rebounding sales. That reversed a -41.7% plunge in the January-February period. Several consumer product manufacturing sectors also saw improvement, with the alcohol, beverage, and refined tea industry recording a 39.9% jump in profits last month. - China’s Industrial Profits Keep Plunging as Prices Decline – Bloomberg

Longer-term Themes:
Cyber Life and Digital Rights:
Data-Sharing Concerns: The state of Washington has implemented a first-of-its-kind state law with sweeping safeguards for consumer health data collected by companies, from telehealth platforms to period-tracking apps, as well as location records that could reveal visits to abortion clinics and other healthcare facilities. Washington’s new privacy law seeks to protect consumer location data and restrict the gathering and sharing of health data for advertisements or other purposes without proper permission from consumers. It also gives consumers privacy rights over personal health data that companies collect about them, including the ability to ask for its erasure. - Washington Shields Abortion Data in First-in-Nation Privacy Law - Bloomberg

Energy’s Midlife Crisis:
Materials Needed: Powering the world with renewable energy will take a lot of raw materials. The good news is, when it comes to aluminum, steel, and rare-earth metals, there’s plenty to go around, according to a new analysis. However, actually mining and processing them can be a challenge. To better understand the material demands of reaching climate targets, the researchers looked at 17 of the key materials needed to generate low-emissions electricity. They estimated how much of each of those substances would be needed to build cleaner infrastructure and compared them to estimates of how much of those resources (or the raw materials needed to make them) are available in geologic reserves. The article breaks down the supply and demand situation and economic and environmental considerations. - Yes, we have enough materials to power the world with renewable energy – MIT Tech Review

Leasing Conflict: Prime real estate the Interior Department last year earmarked for offshore wind project leases off the coasts of North Carolina, Virginia, Maryland, and Delaware conflicts with military operations, according to the Department of Defense. The breadth of the Pentagon’s opposition could imperil President Biden’s bid to install 30 gigawatts of offshore wind power by the end of the decade. The clash represents the latest threat to the fledgling industry that is already grappling with supply chain challenges, inflation-stoked prices, and opposition from coastal communities. The ocean energy bureau expressed confidence it could resolve the dispute. The agency “has a long working relationship” with the Defense Department, “and together we have successfully deconflicted and identified areas that have resulted in 27 leases along the Atlantic coast, covering over 2.1 million acres,” it said in its statement. - Pentagon Sounds Alarm Over Biden Plan for Offshore Wind Sites - Bloomberg

Path to Profit: Fusion developers mostly in the U.S., Canada, and Europe, have been riding a wave of investor interest and actual achievement momentum since August 2021, when scientists at Lawrence Livermore National Laboratory came close to achieving more energy in a fusion reaction than was put in with lasers, a goal known as net gain. Industrial firms, major oil companies, and sovereign-wealth funds are backing efforts along with the Department of Defense, which is in search of a toaster-sized power system for satellite propulsion. “There’s a reasonable probability at least one, maybe two companies will demonstrate fusion conditions in this decade,” said Ernest Moniz, the chief executive of the nonprofit research group Energy Futures Initiative and a former U.S. Energy Secretary. - Tech Billionaires Bet on Fusion as Holy Grail for Business - WSJ

Food: Security, Innovations, and Climate Change Implications:
‘Fake It Till You Make It’: Prospects for lab-grown meat to land on American dinner plates got a boost last fall when the Food and Drug Administration, for the first time, declared cultivated chicken, grown by Upside Foods, safe to eat. While Upside and others have long been able to grow small amounts of meat from cells, making larger volumes at low cost is proving much harder, according to interviews with current and former Upside employees, industry officials, investors, and outside scientists. Upside says lab-grown meat has the potential to feed an expanding global population while saving animals from slaughter and exacting a smaller environmental toll on the planet than traditional meat. - Inside the Struggle to Make Lab-Grown Meat – WSJ

Cold Places (Deep Sea, Artic, and Space Colonization):
Significant Progress: China is building sophisticated cyber weapons to “seize control” of enemy satellites, rendering them useless for data signals or surveillance during wartime, according to a leaked U.S. intelligence report. The U.S. assesses that China’s push to develop capabilities to “deny, exploit or hijack” enemy satellites is a core part of its goal to control information, which Beijing considers to be key in the “war-fighting domain.” China aims to mimic the signals that enemy satellites receive from their operators, tricking them into either being taken over completely or malfunctioning during crucial moments in combat. - China building cyber weapons to hijack enemy satellites, says US leak - FT

VIEWS EXPRESSED IN "CONTENT" ON THIS WEBSITE OR POSTED IN SOCIAL MEDIA AND OTHER PLATFORMS (COLLECTIVELY, "CONTENT DISTRIBUTION OUTLETS") ARE MY OWN. THE POSTS ARE NOT DIRECTED TO ANY INVESTORS OR POTENTIAL INVESTORS, AND DO NOT CONSTITUTE AN OFFER TO SELL -- OR A SOLICITATION OF AN OFFER TO BUY -- ANY SECURITIES, AND MAY NOT BE USED OR RELIED UPON IN EVALUATING THE MERITS OF ANY INVESTMENT.
THE CONTENT SHOULD NOT BE CONSTRUED AS OR RELIED UPON IN ANY MANNER AS INVESTMENT, LEGAL, TAX, OR OTHER ADVICE. YOU SHOULD CONSULT YOUR OWN ADVISERS AS TO LEGAL, BUSINESS, TAX, AND OTHER RELATED MATTERS CONCERNING ANY INVESTMENT. ANY PROJECTIONS, ESTIMATES, FORECASTS, TARGETS, PROSPECTS AND/OR OPINIONS EXPRESSED IN THESE MATERIALS ARE SUBJECT TO CHANGE WITHOUT NOTICE AND MAY DIFFER OR BE CONTRARY TO OPINIONS EXPRESSED BY OTHERS. ANY CHARTS PROVIDED HERE ARE FOR INFORMATIONAL PURPOSES ONLY, AND SHOULD NOT BE RELIED UPON WHEN MAKING ANY INVESTMENT DECISION. CERTAIN INFORMATION CONTAINED IN HERE HAS BEEN OBTAINED FROM THIRD-PARTY SOURCES. WHILE TAKEN FROM SOURCES BELIEVED TO BE RELIABLE, I HAVE NOT INDEPENDENTLY VERIFIED SUCH INFORMATION AND MAKES NO REPRESENTATIONS ABOUT THE ENDURING ACCURACY OF THE INFORMATION