


The Fed Sees a Pathway to the Soft-Landing Promised Land as Growth Persists While Disinflation Grows – Midday Macro - 7/28/2023
Color on Markets, Economy, Policy, and Geopolitics

The Fed Sees a Pathway to the Soft-Landing Promised Land as Growth Persists While Disinflation Grows – Midday Macro - 7/28/2023
Market’s Weekly Narrative and Headlines:
Stocks, bonds, and commodities are ending the week on a more positive note as today’s PCE inflationary data and spending and income results complemented better-than-expected Q2 GDP results yesterday. Throw in lower employment costs as seen in the Fed's favorite quarterly released ECI metric and stronger new orders of durable goods (with core capital goods also rising), and things are looking almost too rosey, keeping the risk-on rally alive during a heavy week of earning results that skewed more positively than expected, with 80% of companies beating consensus expectations so far (Q2 earnings still being -8% lower than a year ago). However, there were still plenty of mixed results and reactions on that front. For example, Google and Meta got a warm reception to their earnings, while Microsoft, on the other hand, didn’t impress as it reported lower cloud revenues and slower income from AI (apperently you can say AI too much on your call). Despite all the noise around releases, analysts raised their total S&P year-ahead earnings estimates every day this week. Turning to Treasuries, yields are still near recent highs, with the 10yr touching above 4% yesterday, while the curve steepened slightly on the week. Oil continues to benefit from increased second-half supply deficit concerns, with expectations for the Saudi’s to keep cuts in place longer, while increased stimulus views for China and official projections saw demand expectations rise. These more optimistic views toward China and global growth also benefitted copper, which is now at the top of its post-June range. The agg complex retraced some of its recent “grain corridor” closing-driven strength, but there remains a number of idiosyncratic stories playing out there, with weather concerns also a major factor in specific regions (as always). Finally, the dollar got a big helping hand from a more dovish-than-expected ECB July meeting message despite the Fed not materially being more hawkish the day before. Stepping-back, there was generally a lot of central bank activity this week, with the BoJ taking the cake and changing its YCC policy. As a result, the $DXY is ending the week at 101.6, with a mix of performance across the major crosses.

Deeper Dive:
The U.S. economy continues to show “resilience” as preliminary Q2 GDP data showed an annualized increase of 2.4%, almost a full percentage point stronger than expected. The growth was driven by still robust consumer spending and increased business investment, while durable goods orders separately showed a fourth straight month of growth. Initial jobless claims also continued to fall, suggesting next week's jobs report may be an upside surprise. A soft landing is now the base case for most of Wall Street and the Fed, with Powell acknowledging at this week’s July FOMC meeting that the Fed’s staff’s projections no longer forecast a recession. Further, the PCE Price Index came in better than expected, echoing the progress seen in June’s CPI report, with median and trimmed mean readings as well as annualized three-month measures showing a broadening and accelerating disinflationary picture. Clearly, the Fed must see more progress, as we are told at nauseam, but at the margin, June’s progress reduces the likelihood of any further rate hikes. This lower inflation is also a benefit to the health of workers who have seen wage and salary income rise at a 6.6% annualized rate over the last three months, while PCE prices have only risen at a 2.5% rate, helping sustain real consumer spending growth at a robust 2.9% pace from March to June. It has also kept the current more positive risk sentiment tone and market rally going, with momentum continuing to broaden during the current earnings season. We continue to want to be more defensive as it feels like this is as good as it gets, favoring the supply deficit stories in commodities such as oil and copper over longs in equities, where we are now net short, as an expression of risk given our view that a slowdown is coming and earning estimates are now too optimistic. We also believe the Fed will keep rates in restrictive territory for longer than other developed nations, favoring the dollar. However, with that said, we see a faster-than-expected global rate cut cycle commencing in 2024 due to inflation finally meaningfully trending back to target right as the cumulative effects of tighter policy increasingly weigh on growth. We wanted to give this broad macro overview, in line with recent writings, before going on to discuss views on home builders and further thoughts on Chinese stimulus actions below.

*Consumers, on aggregate, continue to be off their long-term trends for spending on goods (too high) and services (too low)

*The labor market is loosening and normalizing demand, and increased supply, due to rising participation, will ensure wage-spiral inflationary pressures don’t become engrained

*It looks like we may have exited our EM longs too soon, while our new shorts are also weighing on performance. However, copper and oil longs are making solid gains.
Thoughts on Homebuilders…
We wanted to take some time and elaborate on our newly added short positions, discussing homebuilders this week. Homebuilder stocks have enjoyed a strong rally since bottoming last summer, with the $XHB SPDR Homebuilders ETF back to all-time highs. Several things have benefited homebuilders. Higher mortgage rates have trapped existing homeowners and reduced existing home sales, and with input costs falling and inventory levels low, lack of supply is still driving housing activity despite poor affordability weighing on overall demand. It is estimated that only 1% of the nation’s homes have swapped hands this year, the lowest share in a decade, with the scarcity most pronounced in entry-level housing. As a result, the construction pipeline for single-family and multi-units is historically very high. However, we believe things are about as good as they can get for homebuilders, even if faster construction times increasingly occur. As highlighted in other writings, we believe consumers will move from resilient to pragmatic over the coming quarters due to greater uncertainty over future income and household wealth. Consumer sentiment surveys already show a lower desire to purchase homes, while falling job turnover reduces cyclical demand. Structural demand is also seeing headwinds from reduced immigration and household formation moving sideways. On top of that, the existing large pipeline of “shelter units” under construction will put downward pressures on prices more generally, especially rents, giving would-be home buyers more options and leverage. Finally, tighter credit standards are increasingly weighing on mortgage availability, with higher rejection rates hurting new-home and lower-income home buyers the most, the demographic driving much of the current demand.

*Still strong housing start levels have decoupled from parabolic stock price performance

*Homeowners are reluctant to take on a new mortgage given how high rates have gone, reducing the availability of would-be supply if rates were lower
This leaves us with a U.S. housing market dominated by existing homeowners who can afford new houses but aren’t necessarily motivated to do so, creating a tight supply dynamic. This two-tiered dynamic between current homeowners and would-be ones is also reflected in affordability measures. While total affordability remains close to the worst level on record, it conceals a big difference between those who already own a house and those who don’t, favoring rental options over ownership. Housing supply will likely not increase significantly until existing inventory is unlocked, potentially by aging Baby Boomers who now own a sizable chunk of America’s housing stock. So far, there’s little sign that the older generation is planning to sell, given most own their homes outright and are insulated from economic downturns, reducing the need to become a forced seller. As a result, with no signs of supply ramping up or affordability meaningfully improving, this may be one of the weirdest housing cycles ever. This means that from a housing activity perspective, sales perspective, and starts perspective, last year’s weakness is behind us, and things move sideways from here. However, sentiment for homebuilders is more optimistic than the fundamentals dictate, and a period of payback is warranted in their stock prices given our belief that demand will fall and increasing levels of shelter supply (both single-homes for sales and multi-family rentals) will change the inventory shortage narrative into year-end. We also see this as an area that, despite what Fed officials think, is still going to be weighed on by the increasingly heavier-hitting, lagged, and variable effects of tighter policy. Many homes being constructed were paid for with lower than current borrowings rates, and with the Fed continuing to insist they will keep rates in restrictive territory for longer than markets expect, we see new demand being more rate sensitive moving forward. Finally, we also see the rally technically stretched both overall and particularly in this sector, and as a result, want to be tactically short this higher beta area.

*Mortgage applications continue to chop sideways despite NAHB Builder confidence improving
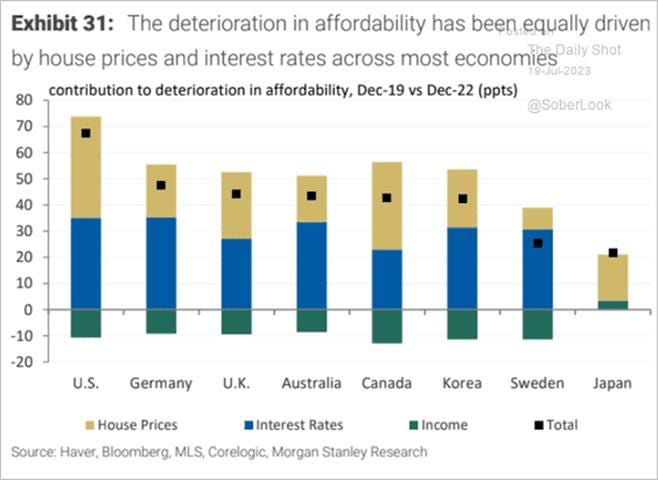
*Housing affordability is far worse in the U.S. than in other developed nations
Turning to China…
Watching for further stimulus actions out of Beijing continues to be a little like Chinese water torture, with an increasingly constant drip of tweaks and additions to existing policies coupled with changes in rhetoric and posturing by Xi and others indicating a more supportive tone towards private enterprise, but no big and bold actions. As a result, near-term market sentiment around China is more stable even though the economic data remains soft, with Q2 GDP falling short of expectations, service PMIs declining, and inflation potentially becoming outright deflation. With policymakers stepping up easing measures and Treasury Secretary Yellen’s trip, as well as other events viewed as successful steps toward putting a floor under the US-China relationship, foreign investors' inflows into China have recently increased. This was further supported by recent speeches by Xi and other top party brass who walked back common-prosperity crackdown positions and redefined the virtues of investing in real estate. This sentiment was echoed in state-run financial newspapers, which reported the implementation of more supportive policies aimed at improving growth and boosting business confidence is coming.

*Geopolitical relations and policy uncertainty have grown in importance for reasons to de-risk supply chains away from China

*Falling lending activity and tighter credit channels…

*…have led to a current negative credit impulse
China signaled that more economic support measures are imminent toward supporting the ailing property market. Sales in the real estate sector have reversed the strength seen early in the year. Distress is increasingly spreading from private developers to state-owned entities and from smaller cities to top-tier ones, where “secondary markets are suffering from a glut of eager sellers despite plummeting sales,” Nomura’s Lu Ting wrote. The State Council discussed a broad package of property-related stimulus. At the same time, regulators issued a 16-point plan to financial firms, putting pressure on banks to ease terms for property companies by encouraging negotiations to extend outstanding loans. The People’s Bank of China and the National Financial Regulatory Administration said that the aim is to ensure the delivery of homes that are under construction. This coincides with reductions of down payments in some non-core neighborhoods of major cities, lowering agent commissions on transactions, and further relaxing restrictions for residential purchases, increasingly in core cities. Further, authorities said separately in a public statement that they’re allowing developers to access more money from home pre-sales, the industry’s biggest source of funds.

*Problems in the property sector have a negative multiplier effect on growth generally…

*With the Chinese property sector having a particularly high multiplier effect verse other nations

*The real estate sector underwent forced deleveraging in recent years. According to Gavekal, this is mainly because of tighter financial regulation, although private developers have accumulated non-debt liabilities via pre-sales

*Supply and demand are moving into better balance as developers’ completions are rising verse starts
China’s recent Politburo meeting shifted permissions, giving the green light to pro-growth policy changes but still not at a significantly urgent level. As a result, the goal is to support growth but in a responsible manner, targeting stimulus only to specific disadvantaged groups or industry sectors. The overarching policy goals are for a “harmonious society,” according to the Politburo statement. “Employment should be raised to a strategic height” indicates that young urban unemployed and the unemployed generally will receive the administration’s full attention. As discussed above, the focus also shifted to supporting the property sector with the removal of “housing is for living, not for speculation” and a structural change to how to address the “housing supply problem” and enacting supportive real estate policies. Finally, one of the biggest changes to the statement was a nod to investing, with a desire to “make the capital market more active and boost investor confidence.” Long-term Beijing watchers noted that this is the first time that the Politburo has used the word “investor,” as they did not exist in the past lexicon of the Politburo, and investor concerns were not a priority. All in all, the July statement was a more growth-friendly edict.

*Rising youth unemployment is weighing on growth, social stability, and has Beijing concerned

*High levels of uncertainty due to the past zero-Covid policy and common prosperity crackdown policies have uncertainty high among consumers

The PBoC will likely further ease policy, with an article in the China Securities Journal speculating that the reserve requirement ratio will be cut again soon. Will that be enough? Likely not. There are three main problems with China’s economy; its property sector, Xi’s Wolf Warrior and Common Prosperity Crackdown policies scaring foreign investors off, and finally, the inability of the government to jump-start the economy following the crippling zero-Covid lockdowns. Until recently, the CCP has stuck to its normal stimulus playbook of supporting manufacturers and FAI injections. What is really needed is direct support to the consumer. Chinese families are cutting back and waiting it out, having low confidence due to a high level of uncertainty about what is next. This is weighing on aggregate demand and causing deflation. With about 70% of China's household savings tied up in real estate, a weakening property sector means that households' net wealth shrinks. As a result, we take increased property sector support as potentially having a larger policy multiplier effect on the economy than many expect. Unfortunately, a structurally driven lower demand for urban housing moving forward will weigh on activity, and stimulus directed toward the sector may yield less productive results than if it was targeted elsewhere. However, local governments' fiscal reliance on land sales and the outsized role the property market plays in household balance sheets and consumer confidence means it is essential for any sustainable growth path and must be protected.

*Growth readings continue to be weaker than expected after the initial reopening thrust…

…with the service sector now following manufacturing activity lower

*With consumers pulling back, deflationary forces are building, especially in core goods

*Local governments are still in poor fiscal shape, reliant on the new property sector activity to service existing debt
Of course, as we wrote about a while back, if Xi wants to cement his legacy, he needs to unlock the full potential of the Chinese consumer, the country's greatest asset. This means increasing the social safety net by reducing medical, retirement, and education costs, the main reasons people keep large savings. Of course, there is no magic wand to do this, and although drips of tweaks and additions to existing policy are supportive, markets await the restructuring of fundamentals. The bigger issues are long-term and are controlled by domestic and geopolitical policies as well as demographics. If Beijing truly wants a bipolar world where it has equal weight to the West, and America specifically, it will need to expedite the expansion of its middle class to support a more organically insulated economy. This, of course, is a tricky task as the middle class is notorious for wanting more freedoms, which is often not compatible with the currento governance structure, to say it nicely. Towards that point, the replacement of Qin Gang by Wang Yi sends an interesting message during what should be a time of easing tensions domestically and internationally. While the shakeup probably won't have much of an impact on China's foreign policy, which, like everything, is stage-managed by Xi himself, it might embolden wolf warrior rheotric by other diplomats, and there clearly is still political infighting occurring even under Xi’s tighter and tighter control. The Eurasia Group recently summarized it best by saying the main dangers of "Maximum Xi” is that there are few checks and balances left to constrain him and no dissenting voices to challenge his views, leaving Xi's ability to make big mistakes unrivaled.

*China still has a lot of consumption potential, something it is increasingly seeing as a way to buffer its economy from external pressures

*Chinese consumers are becoming increasingly more pessimistic with falling spending intentions
Where does this all leave us regarding Chinese financial assets? With Beijing seemingly drawing a line in the sand regarding where it wants to see the yuan, the FX risk to the market is reduced. Equities saw recent highs for inflows from institutional investors, and certain sectors look to be regaining momentum. Further, government yields are trending lower, reducing rises in real rates despite increasing deflationary pressures. However, the property sector and other areas of high yield are still too volatile and dangerous for most investors to stomach. As a result, we are sympathetic to being long equities through ADRs ETF like $FXI and $KWEB, something we had partially expressed with our EM long basket, and something we may regret taking profit on too soon. Of course, buyers beware, as sell-offs are always one bad geopolitical headline away, and it will take time for stimulus to hit meaningfully. As a result, we are happier playing an improving Chinese growth story through copper and oil longs.

*Chinese equities have significantly underperformed…

*…and either we are looking at a massive value trap, or there needs to be a catch-up

*Variant Perception’s leading excess liquidity index for China is signalling stocks should go higher

*Investors do believe that growth should increase but are underweight because of geopolitics and policy uncertainty

*Several sell side shops, such as BCA and MRB Partners, believe a further improvement in growth will support equity performance
Please share our newsletter and feel free to reach out with any questions or comments.
Thank you for reading! - Mike Ball
Policy Talk:
The Federal Reserve raised interest rates by 25 bp at the July FOMC meeting in a unanimous decision, moving the Fed funds target range to 5.25% - 5.5% after pausing in June. The official statements' language changed very little. Powell started his prepared remarks by noting the Fed has covered a lot of ground and that the full effects of tightening have yet to be felt. He continued to insist that future decisions would be data-driven, stressing the number of job reports and inflation readings between this meeting and the next. In his assessment of the economy, he still sees the labor market as tight but “coming into a better balance,” helped by an increasing labor market participation rate. This has slowed nominal wage growth, but there remains a mismatch with demand exceeding the availability of workers. He was reluctant to put too much weight on recent declines in inflation readings but noted that inflation expectations remained well anchored.

*No major changes to the FOMC’s official statement

*The Fed has now raised rates 525 bps in a little over a year
Powell does believe the “most-interest rate sensitive” parts of the economy were feeling the effects of the tighter policy but highlighted that it would still take time for the cumulative effects of tighter policy to weigh on economic activity fully. This uncertain lagged effect is what the committee was closely watching in determining future policy actions, leaving each future meeting live and uncertain, something Powell reiterated multiple times in the Q&A part of the press conference (making it a particularly painful one to watch). Overall, Powell saw the data since the June meeting as being in line with expectations, with resilient economic activity, cooling labor markets, and slightly greater progress than expected on the inflation front. He stressed that the committee continued to look at the “whole broader picture,” with the progress being defined by a better balance of supply and demand across the entire economy. Of course, this could mean the broadly consistent progress across growth, labor, and inflation readings still means the Fed will stick to its June SEP Fed fund projections, indicating a further hike is still coming.

*Powell's more dovish tone saw the expected terminal rate fall following his presser
However, Powell repeated he believes policy is well into restrictive territory. Finally, even with this belief and the idea that restrictive territory would slow the economy to a below-trend growth level, the staff upgraded their economic forecast and no longer saw a recession. Finally, in our opinion, there was little new information, and the real question is how much the SEPs will move in September, given how things have and potentially will evolve into that meeting. As we have long written, we see inflation as mainly supply-side driven, and as a result, only minimal demand destruction will be needed to rebalance things back into a non-price-accelerating dynamic. We believe that is loss of demand is underway while supply impairments continue not only to normalize but, due to reduced capacity utilization demands, are now increasingly become outright deflationary, leading us to believe there will be no further rate hikes and the September’s SEPs will reflect a higher end of year growth level, lower UER, lower headline/core PCE, and 25bp lower Fed funds projection.
“I would say that the intermeeting data came in broadly in line with expectations, economic activity remained resilient, job creation remains strong while cooling a bit. And the June CPI report actually came in a bit better than expectations for a change. And the June CPI report, of course, was welcomed, but it's only one report, one month's data.”
“I would just say the historical record, we have to be honest about the historical record, which does suggest that when central banks go in and slow the economy to bring down inflation, the result tends to be some softening in labor market conditions. And so that is still the likely outcome here. And you know, we hope that that's as little as possible. We have to be honest, that that is the likely outcome.”
“The broader picture of what we want to see is we want to see easing of supply constraints and normalization of pandemic-related distortions to demand and supply, we want to see economic growth running at moderate or modest levels to help ease inflationary pressures, we want to see continued restoration of supply and demand balance, particularly in the labor market, and all of that should lead to declining inflationary pressures.”
“I think it's not an environment where we want to provide a lot of forward guidance. There's a lot of uncertainty out there, we just want to keep moving at what we think is the right pace, and I do think it makes all the sense in the world to slow down as we now make these finely judged decisions, and so that's what we did. And so, I think it's possible, I mentioned before it's possible that we would move at consecutive meetings, we're not taking that off the table, or we might not. It's really going to depend on what the data tell us. That's the best we can do.”

*Pick your fighter with three camps emerging, hawks, doves, and the middle
U.S. Bank regulators (FDIC, OCC, and Fed) released plans tied to the Basel III global framework initiative to impose stricter standards on larger banks, requiring a higher capital ratio across most of the industry.Banks with at least $100 billion in assets would have to boost the amount of capital set aside by an estimated 16%. The eight largest banks face about a 19% increase, with lenders between $100 billion and $250 billion in assets seeing as little as 5% more. The overhaul of bank capital rules proposed by regulators would require changes to how banks calculate their risk-weighted assets, including changes to requirements for residential mortgage holdings. Banks would need to set aside higher levels of capital for riskier mortgages and first-time buyers, something that goes beyond international standards and would increase borrowing costs for low-income and first-time buyers. Further, under the proposal, midsize banks would now have to include unrealized gains and losses from some securities in their capital ratios. The banking industry has opposed the rules, arguing that banks would crimp lending, which would have harmful effects on the U.S. economy. Six of the top U.S. banks (JPMorgan, BoA, Citi, Wells Fargo, Morgan Stanley, and Goldman Sachs) are sitting on an estimated $118 billion in so-called excess common equity tier 1 capital which would be nearly erased under the new proposed standards. Governors Waller and Bowman also oppose the tougher rules. The proposed regulatory changes won’t be implemented for years, and companies, consumer advocates, and others will have a four-month public comment period.
“One clear message was that regulatory requirements, including capital requirements, must be aligned with actual risk so that banks bear the responsibility for their own risk-taking. The proposal takes an important step toward better-aligning capital requirements with risk.” - Fed Vice Chair for Supervision Barr
“The proposed revisions under consideration have not been directed by Congress and are not compelled by a new evolution or identified weakness in the U.S. banking system.” - Governor Bowman
“We must recognize that, at some point, well-intended actions to improve financial resiliency can undermine the indispensable role banks play in providing financial intermediation.” - Governor Waller

U.S. Economic Data:
Advance estimates showed that real gross domestic product increased at an annual rate of 2.4% in the second quarter, higher than 2% in Q1 and above market expectations of 1.8%. The second quarter increase raised year-over-year growth to 2.6% from 1.8%. The GDP deflator was higher by 2.2%, putting nominal GDP growth at 4.7% in the quarter. Consumer spending rose by 1.6% QoQ, down from 4.2% in Q1, with spending on goods slowing to 0.7% QoQ, verse 6% in Q1, while spending on services remained strong at 2.1% QoQ, verse 3.2% in Q1.Real business fixed investment increased by 7.7% QoQ due to a 10.8% QoQ increase in equipment spending, specifically on a 55.8% surge in business transportation equipment. In comparison, intellectual property products investment rose by 3.9% QoQ, and structures investment increased by 9.7% QoQ. Residential investment was again negative, declining by -4.2% QoQ after a decrease of -4% in Q1. Private inventory changes added 0.14 percentage points to growth, significantly improving from the negative -2.14 percentage point drag it had on Q1 growth. Government expenditures increased at a much softer pace (2.6% vs. 5%), and net trade weighed down on the growth by subtracting 0.12 percentage points as exports were down 10.8%, and imports dropped at a smaller 7.8%.
Why it Matters: The upturn in private investment, whether fixed business investment or increases in inventories, was the main reason Q2 surpassed Q1, partly offsetting the deceleration in consumer and government spending, as well as a worsening trade deficit. However, despite being down from last quarter, consumer consumption results were still better-than-expect due to rises in both goods and services, with goods seeing increased spending on recreational goods and vehicles, gasoline, and other products. Increases in service spending were broader. There were notable increases in nonresidential fixed investment. Business investment in equipment had a large quarter-over-quarter change, rising over 10% this quarter after falling nearly -9% last quarter. Investment in structures decelerated from 15.8% last quarter to a still healthy 9.7% this quarter, with the fiscal impulse-driven construction frenzy of new manufacturing cooling but still firm. Finally, the cumulative rise in business and consumer spending has led real final sales to domestic purchasers, or “core” GDP to have a second quarter of notable increases.

*Stronger business investment and inventory builds helped the overall initial Q2 GDP QoQ change come in stronger-than-expected

*Real final sales to domestic buyers or “core GDP” saw another quarter of strong gains

*Despite the better-than-expected results, the majority of categories are cooling, although still generally expanding
The Headline PCE Price Index increased by 0.2% in June following a 0.1% rise in May, in line with market expectations and moving the annual headline increase to 3%. Core PCE also increased by 0.2%, following a 0.3% rise in the prior month and moving the annual rate to 4.1% YoY. The “supercore” PCE sub-index rose 0.2% MoM, the lowest monthly increase since August, moving the annual rate to 4.1% YoY, down from 4.5% in May on the same basis.
Why it Matters: June’s PCE price index results showed progress in all three buckets of core prices that the Fed has focussed on. Three-month annualized rates for core goods, core services, and housing are now 1.6%, 3.3%, and 6.2%, respectively, bringing the overall three-month annualized rate for core PCE to 3.4%. The Dallas Fed trimmed mean PCE inflation slowed to 4.2% YoY in June from 4.6% in May. The one-month annualized trimmed mean PCE inflation rate in June was 2.5%, the lowest since April 2021. 33% of the detailed components rose at a one-month annualized rate of 5% or faster in June, the smallest share showing rapid price gains since July 2021. There is further evidence here of easing in underlying inflation, and although the Fed will continue to site the need for more progress, June PCE price data was a step in the right direction.

*Progress continues to be made, with annual measures falling on weaker monthly gains and more favorable comparables

*Three-month averages annualized are increasingly showing a broadening deceleration in inflationary pressures

*"Supercore" PCE rose by 0.2% MoM, the lowest monthly reading since last August
Personal spending rose by 0.5% in June following an upwardly revised 0.2% MoM increase in May and beating market expectations of a 0.4% MoM increase. Spending on services increased by 0.1% MoM, while goods rose by 0.9% MoM, driven by a 1.7% MoM increase in spending on durables. Among services, the largest contributors to increased spending were financial services and insurance, housing utilities, and recreational services. Goods saw notable spending increases were seen for motor vehicles and parts, gasoline, and other energy goods. Personal income rose by 0.3% in June, easing from a 0.5% increase in May and falling short of market expectations of a 0.5% advance. Compensation of employees increased by 0.5% MoM, driven by a 0.6% MoM growth in wages and salaries and a 0.4% MoM rise in other costs. In contrast, personal income receipts from assets dropped by -0.2% MoM, primarily due to a 1.2% MoM decline in personal dividend income.
Why it Matters: Consumer spending was stronger than expected, but total personal income rose by a smaller-than-expected amount, although May’s increase was revised higher. However, workers have seen wage and salary income rise at a 6.6% annualized rate over the last three months, while PCE prices have only risen at a 2.5% rate on the same basis. This is leading real disposable incomes to rise and supporting the stronger consumer spending growth rate of 2.9% from March to June. Powell has gone out of his way to say rising real wages is a positive in FOMC press conferences, and along with lower trending inflation, certainly supports the soft landing camps narrative.

*Spending on goods saw some upside payback after a weaker prior month, while services continue to trend higher at a more stable rate

*Personal Income came in lower-than-expected due to declines in dividend income

*The overall BEA’s PCE and Income & Outlays report should encourage the Fed that inflation is cooling while consumers remain resilient due to rising real disposable incomes
Compensation costs for civilian workers increased by 1% during the second quarter, easing from a 1.2% rise in Q1 and slightly missing market expectations of a 1.1% advance. Wages and salaries were up by 1% QoQ, compared to 1.2% in Q1, while benefit costs increased by 0.9% QoQ, compared to 1.2% in Q1. Compensation costs for private industry workers and state and local government workers both increased by 1% QoQ. Year-on-year, compensation costs are higher by 4.5% in the April to June period, down from a 4.8% annualized increase in the first quarter.
Why it Matters: A falling employment cost index bodes well for the Fed, as Powell has cited it as a critical gauge of labor market tightness. However, at a 1% QoQ increase, it is still too high, with a more normal range for a non-accelerating inflationary ECI being between 0.5% to 0.75% quarterly gains. Finally, worth noting that goods-producing industries (0.8% Q2 vs. 1.2% Q1) saw a more meaningful deceleration than service industries (1.0% Q2 vs. 1.1% Q1).

*Quarterly increases are slowly trending lower, but annual increases are still historically very high

*As seen in the PCE report, real wages are increasing when using ECI measures verse CPI
New orders for durable goods jumped 4.7% in June, the most since July 2020, following an upwardly revised 2% rise in May and easily beating market expectations of a 1% MoM increase. The volatile transportation equipment category increased by 12.1% MoM, boosted by non-defense aircraft and parts (69.4% MoM) and, to a lesser extent, an increase in motor vehicles (0.3% MoM). Excluding transportation, new orders increased by 0.6% MoM. Excluding defense, new orders rose by 6.2% MoM. Demand increased for capital goods (11.2%), namely non-defense ones (16.9%). Gains elsewhere were seen in computers and electronics (1.5%), electrical equipment (1.5%), and primary metals (0.9%). Orders for non-defense capital goods, excluding aircraft, a closely watched proxy for business spending plans, rose by 0.2% MoM after a downwardly revised 0.5% rise in May. Shipments rose 0.3% MoM in June verse 2% MoM in May. Unfilled orders rose 1.8% MoM compared to 0.8% in May, while inventories increased by 0.1% MoM verse 0.2% in the prior month. The inventory-to-shipments ratio remained at 1.84.
Why it Matters: It was the fourth straight month the headline durable goods orders rose, driven by gains in transportation equipment. This has helped the year-on-year optics of overall durable goods increase, but when excluding aircraft orders, monthly gains slowed in June from May, with core capital goods decelerating for their third month, however, this was off of high levels, with the 3-month annualized rate of change still at a high level of 5.8%, while shipments there are up 3.3% on the same basis. It’s also worth highlighting that motor vehicles & parts slowed to 0.3% MoM in June from 2.6% in May, although the 3-month annualized rate is still an impressive 6.6% verse the actual annual rate of 3.8%. As a result, given lower demand, activity, and capex intentions coming across in manufacturing business surveys and the decline in industrial production readings, we see the general demand for durable goods trending weaker despite notable upticks in aircraft orders.

*New aircraft contracts again drove new orders for durable goods higher on the month

*However, core capital goods continue to trend lower in monthly gains

*The underbelly of the report shows a more mixed picture in month-to-month changes, with new orders for motor vehicles notably decelerating
The S&P CoreLogic Case-Shiller 20-city home price index increased by 1.5% in May, following an increase of 1.7% MoM in April, keeping the annual rate at -1.7% YoY.. The Midwest (+2.7%) unseated the Southeast (+2.1%) as the country’s strongest region, while the West (-6.9%) remains the weakest. Seattle (-11.3%), San Francisco (-11%), Las Vegas (-7.8%) and Phoenix (-7.6%) booked the biggest decreases while Chicago (4.6%), Cleveland (3.9%) and NY (3.5%) reported the top gains. Separately, the average prices of single-family houses with mortgages guaranteed by Fannie Mae and Freddie Mac rose by 0.7% MoM in May, well above market expectations of a 0.2% increase. For the nine census divisions, monthly price changes ranged from -0.5 percent in the New England division to +1.7 percent in the Pacific division. Year-on-year, house prices are now higher by 2.8%, the lowest since April 2012.
Why it Matter: This was the fourth straight month of increases "which could be truncated by increases in mortgage rates or by general economic weakness. But the breadth and strength of May’s report are consistent with an optimistic view of future months”, says Craig J. Lazzara, Managing Director at S&P DJI. There was an even split of 10 cities reporting lower prices and those reporting higher prices on an annual basis in May. “U.S. house prices increased moderately in May, continuing the trend of the last few months,” said Dr. Nataliya Polkovnichenko, Supervisory Economist in FHFA’s Division of Research and Statistics. “However, house prices in some regions of the country remained below the levels seen one year ago.”

*Housing prices look to have now bottomed from last year's weakness, but regional differences are persistent
The Conference Board’s Consumer Confidence Index rose to 117 in July from 110.1 in June. The Present Situation Index improved to 160.0 from 155.3 last month, while the Expectations Index improved to 88.3 from 80.0. Greater confidence was evident across all age groups and among both consumers earning incomes less than $50K and those making more than $100K. The spread between consumers saying jobs are ‘plentiful’ versus ‘hard to get’ widened further. Readings on current family financial conditions saw the share of respondents citing “good” situations rise. Expectations for future incomes ticked down slightly, while the “family financial situation - six months ahead” also softened somewhat in July.
Why it Matters: Consumers are more upbeat, likely reflecting lower inflation and a still historically strong labor market, despite higher interest rates and expectations for slower wage growth compared to a year ago. However, despite the considerable headline rise, due to broad improvements in present and expected readings across all income cohorts, the proportion of consumers saying recession is “somewhat” or “very likely” to occur also ticked up in July. Further, “in our periodic survey of services, consumers continued to report intentions to spend less on discretionary services, including travel, recreation, and gambling, in the future. By contrast, they anticipate spending more in the months ahead on necessary services like health care, as well as cheaper services like streaming services from home,” according to Dana Peterson, Chief Economist at The Conference Board. With that said, consumers also saw jobs as more plentiful, so despite the improvement in the majority of sub-readings, consumers are still indicating a high level of uncertainty.

*Headline readings have now retraced the majority of their post ’21 loses

*Present business conditions were the only negative contributor this month
The Richmond Fed Manufacturing Index moved to -9 in July from -8 in June, recording the seventh consecutive result in the negative territory. Demand and activity measures all contracted further, with Shipments (-6 vs. -5), New Orders (-20 vs. -16), and Backlog of Orders (-20 vs. -16) weakening further, although Capacity Utilization was unchanged. Vendor Lead Times (-8 vs. -18) shortened at a reduced rate, while Finished (8 vs. 20) and Raw Material Inventories (12 vs. 22) fell notably. Employment (5 vs. -1) moved back into expansionary territory, while Wages (19 vs. 17) rose further. However, readings on the Availability of Skills Needed (-12 vs. -4) worsened. Price trends continued to moderate, with Prices Paid (4.07 vs. 4.56) and Received (4.01 vs. 4.56) both seeing solid declines. Readings on expectations somewhat echoed the current readings, with demand and activity measures worsening, although shipments and new orders were still expected to expand. Future hiring intentions fell slightly. Finally, current and expected Investment readings generally improved, with capital, IT, and service expenditures expanding on net.
Why it Matters: July’s survey brought a more pessimistic reading of current and future demand and activity measures, contrasting a headline index that was little changed. Local business conditions continue to be unsupportive as well. This was countered by an expanding investment and hiring picture. As a result and overall, the manufacturing index, although still contracting, looks to be more stable given the overall message portrayed at the sub-index level. Regarding inflation, the decrease in current price readings continued a positive deflationary trend and, when coupled with wages also trending lower despite stickiness this month, shows firms continue to experience reduced cost pressures.

*Overall activity looks to be bottoming while prices continue to trend lower

*There was a broad decline in both current and expected demand and activity readings
The Chicago Fed National Activity Index decreased to -0.32 in June from a downwardly revised -0.28 in May, missing market expectations of 0.03. Production-related indicators contributed -0.27, down from -0.20 in the previous month, while the contribution of the sales, orders, and inventories category edged down to -0.05 from -0.01. Also, the personal consumption and housing category contributed -0.02 compared with -0.01 in May. On the other hand, employment-related indicators contributed +0.03, up from -0.06. The index’s three-month moving average, CFNAI-MA3, increased to -0.16 in June from -0.21 in May.
Why it Matters: Despite the common narrative of economic growth improving, the CFNAI diffusion index has weakened for a second month in a row, although the three-month average moved slightly higher but remained in negative territory. The largest negative contribution came from production-related indicators, followed by a decline in sales, orders, and inventory categories, which moved further into negative territory. Not surprisingly, personal consumption and housing were little changed, while employment-related indicators turned positive after a notable move into negative territory last month.

Technicals, Positioning, and Charts:
The Nasdaq is outperforming the Russell and S&P on the day, with Growth and Small-Cap factors, as well as Communications, Consumer Discretionaries, and Technology outperforming on the day. Leadership on the week at the sectorial level was in the Communication sector due to Meta’s performance/weighting there, while Materials and Energy also performed well. Regional Banks and Semiconductors also had outsized gains, tilting the outperformance on the week towards core technology and cyclicals. Growth and, to a lesser extent, Small-Cap factors outperformed the S&P on the week, but all other factors were lower, with Low Volatility the worst performing.

@KoyfinCharts
S&P optionality strike levels have the Zero-Gamma Level at 4511 while the Call Wall is 4600 and Put Wall is 4500. Spotgamma sees equities and volatility mean reverting at current levels due to a mild positive gamma position, with a break below 4500 being where this would change due to increased negative gamma hedging flows that could drive markets lower. They predict a VIX at 20 if the S&P falls to 4400.

@spotgamma
S&P technical levels have support at 4585, then 4570, with resistance at 4608, then 4625. As said last week, the S&P is still in a strong uptrend, where dips have been bought, favoring longs. Yesterday’s price action was complicated with an eventual sharp sell-off, mainly reversing with today’s retracement, setting up a fake break-down rally off the original bearish BoJ news price actions. The S&P is now hitting resistance from its new triangle consolidation formation around current levels (4610), with the first major support at 4570. A break below this likely led to a retest of the top of the prior triangle formation at 4500.

@AdamMancini4
Treasuries are higher on the day, with the 10yr yield lower by 4 bps to 3.97%, while the 5s30s curve is steeper on the session, moving to -17 bps.

Four Key Macro House Charts:

Growth/Value Ratio: Growth is higher on the day and the week, however Small-Cap Value the best-performing size/factor on the week.
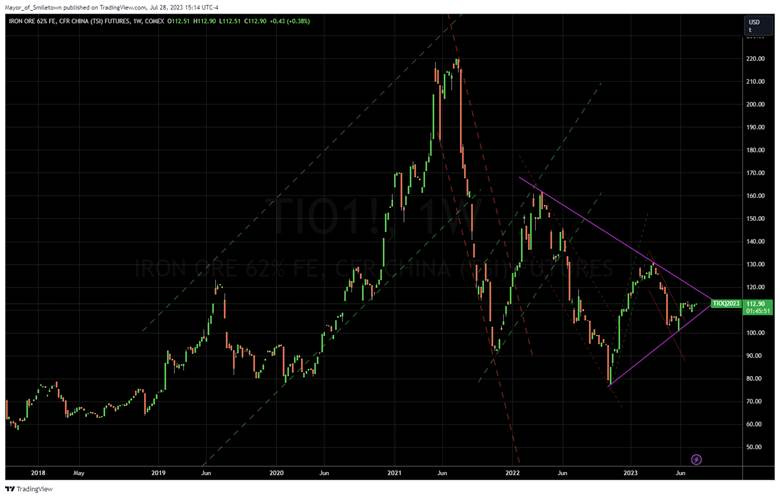
Chinese Iron Ore Future Price: Iron Ore futures are higher on the day and the week.

5yr-30yr Treasury Spread: The curve is steeper on the day and the week.

EUR/JPY FX Cross: The Yen was weaker on the day but stronger on the week.
Other Charts:

Still early in earnings reporting season, but for first time since 4Q20, companies that beat estimates are not being rewarded vs. S&P 500 - @lizannsonders

Call volumes have been rising again, helping keep the rally going.

Retail investors are much more upbeat than institutional investors.

Despite better-than-expected growth in Q2 and increased soft-landing beliefs, Factset still sees profit margins moving back to pre-pandemic levels.

Americans locked in ultralow rates on debt such as mortgages and auto loans in the decade-plus that followed the 2008 financial crisis. As of the first quarter, only 11% of outstanding household debt carried rates that fluctuated with benchmark interest rates, according to Moody’s Analytics. That metric has hovered around this historically low level for over a decade.

Normally in a tightening cycle, corporates (huge net borrowers) suffer a big rise in net interest payments. But not this time which has boosted profits and also helps explain the delayed recession – Albert Edwards @albertedwards99

New data released yesterday showed the median new home price in June was $415,4K, a hair underneath the existing-home median price of $416K, released last week. With mortgage rates still hovering around 7%, homeowners are holding onto homes financed at low rates, squeezing the supply and keeping prices at nosebleed levels. Meanwhile, homebuilders are more willing to sell affordable smaller houses to tap into demand from frustrated buyers.The bottom line: Prices for older houses and newer ones are converging in a remarkable way. – Axios Markets

Business loan demand in Europe down by a record amount. With European econ data getting weaker and some countries like Germany almost certainly in recession, the ECB might have a tougher time justifying many more hikes. – Liz Young @LizYoungStrat
Articles by Macro Themes:
Medium-term Themes:
Labor Markets Loosening?:
Greater Participation: Americans between 25 and 54 years of age are either employed or looking for jobs at rates not seen in two decades, a trend helping to counter the exodus of older baby boomers from the workforce. In the first months of the pandemic, nearly four million prime-age workers left the labor market, pushing participation in early 2020 to the lowest level since 1983. Prime-age workers now exceed pre-pandemic levels by almost 2.2 million. That growth is taking a little heat out of the job market and could help the Federal Reserve’s efforts to tamp down inflation by keeping wage growth in check. - Americans in Their Prime Are Flooding Into the Job Market – WSJ

Baby Boomers Sticking Around: By 2031, workers 55 and older will comprise 25% or more of the workforces in G7 countries, a nearly 10% jump from 2011, according to a July 13 report from global consultancy firm Bain. Across the world, 150 million jobs will shift to older workers by the next decade, a figure almost equal to the entire working population of the U.S., the report found. Financial security may be front of mind for workers who want to keep working past retirement age. However, 6 in 10 of retirement-age workers in the U.S. say they’ve kept working because they are still healthy and able, according to a recent survey. - By the next decade, 25% of US workforce may be 55 or older – HR Drive

Longer-term Themes:
Cyber Life and Digital Rights:
First Hurdle: Legislation championed by crypto advocates that sets clearer rules for the nascent industry was approved by a key US House panel on Wednesday. Clearing that first step is a win for crypto advocates who have said existing rules aren’t clear and are seeking to stymie the US Securities and Exchange Commission, which has ramped up its enforcement against the industry following the collapse of high-profile companies, including FTX.The legislation would establish rules for when crypto firms must register with the SEC or the CFTC. It lays out a process for digital-asset issuers to certify to the SEC that a blockchain network is sufficiently decentralized, which would allow related tokens to be classified as commodities overseen by the CFTC. The bill would also require the two agencies to engage in joint rulemaking and would mandate studies on issues, including nonfungible tokens and decentralized finance, or “DeFi.” Even if the full House votes in favor of the bill, it faces long odds in the Democrat-led Senate, where Banking Chairman Sherrod Brown of Ohio has been a skeptic of the crypto industry. - Crypto Regulatory Framework Bill Endorsed by House Financial Services Committee - Bloomberg

A.I. All Day:
Voluntary Commitments: Seven leading artificial intelligence firms enact new voluntary safeguards to minimize abuse of and bias within the emerging technology. Under the agreement, companies will put new artificial intelligence systems through internal and external testing before their release and ask outside teams to probe their systems for security flaws, discriminatory tendencies, or risks to Americans’ rights, health information, or safety. The firms are also making new commitments to share information to improve risk mitigation with governments, civil society, and academics and report vulnerabilities as they emerge. And leading AI companies will incorporate virtual watermarks into the material they generate, offering a way to help distinguish real images and video from those created by computers. - Amazon, Meta Among Firms to Unveil AI Safeguards After Biden’s Warning - Time

Energy’s Midlife Crisis:
3% to 4%: Extrapolating from data earlier this year suggests that global oil demand recently exceeded the pre-Covid peak.Expressed in barrels a day, the fresh record high in global oil consumption totals about 102.5 million, likely hit in the last few weeks in July and above the 102.3 million of August 2019. Ironically, gasoline, the fuel that’s first to suffer from the rise of electric vehicles, is playing a leading role in boosting demand. Only a few months ago, the conventional wisdom said that 2019 marked the peak in gasoline consumption. Now, it increasingly looks like gasoline demand will, at the very least, match the pre-pandemic high. No matter what happens next with autos, what’s clear is that under current trends, global oil demand will increase a further 3% to 4% the next five years, before settling at a high plateau. - The Harsh Truth: We're Using More Oil Than Ever - Bloomberg

Our Reserves: As minerals that feed electric-vehicle batteries become the new oil, the highest-value battery metal is lithium and the nation with the most of it is Chile. That’s why Chile’s new approach to lithium, one that tips the balance away from private companies and toward government control, is of keen global interest. The government of President Gabriel Boric wants the state to take a controlling stake in operations considered strategically significant, with twin goals of making lithium production more sustainable and generating more money for the country. His left-leaning government is readying a bill to establish the new national lithium company. But getting that through Congress and implemented could take much of the remainder of Boric’s four-year term, which runs through March 2026. The new model got a conditional endorsement from the United Nations and has been generally well received by companies that will have to broker deals with state agencies. To ease market fears, authorities reiterated their intention to respect existing arrangements with incumbents and opened the door to private companies getting controlling stakes in areas not considered strategically important. - Why Chile’s New Approach to Lithium Matters Globally - Bloomberg

Authoritarianism in Trouble?:
Removing Checks and Balances: After winning an unexpectedly large electoral victory in November 2022, Benjamin Netanyahu went on to form the most right-wing government in Israel’s history. Its ultranationalist and ultra-Orthodox members don’t agree on everything, but they are united on one objective: weakening Israel’s judiciary and strengthening government control over both the courts and the civil service. Last month, Netanyahu’s government unveiled plans to do just that, pushing through a bill that erodes almost all institutional checks and balances, concentrating immense power in the hands of the executive branch. This would, in turn, enable further steps already agreed upon by the coalition to push the nation in the direction of authoritarianism, both in Israel and in the territories it occupies. Netanyahu claims that these reforms are necessary to restore the balance of power between the legislature and the judiciary. Many Israelis disagree, and mass protests continue daily. - The End of Israeli Democracy? – Foreign Affairs

Cold Places (Deep Sea, Artic, and Space Colonization):
Increasing Spending: The global space economy grew 8% to $546 billion in 2022 and is projected to climb another 41% over the next five years. Companies are seeing continued revenue growth from commercial space assets and governments around the world are boosting expenditures, according to a report from the Space Foundation. The analysis considered spending from 51 governments, as well as commercial revenue from companies in 11 space industry sub-sectors. “Commercial space is the vital growing sector of the overall space economy,” Lesley Conn, director of research and digital programming at the Space Foundation, said in an interview. “Within five years, certainly, you’re going to see a real acceleration and an expansion of space and space assets.” The US dominated civil and defense spending in space, comprising nearly 60% of total spending. China followed in second place, accounting for 14%, according to the Space Foundation’s analysis. - The commercial space industry, led by Elon Musk’s SpaceX, is expected to blast off with 41% growth over the next 5 years - Fortune

28th: Argentina signed the U.S.-led Artemis Accords outlining best practices for space exploration, part of a recent surge of countries joining the agreement. Argentina is the 28th country to sign the Accords and the fifth to do so in the last three months. The Czech Republic and Spain signed the document in May, followed by Ecuador and India in June. The Accords, started in 2020, outline best practices and norms of behavior for space activities, building upon the Outer Space Treaty and other agreements. They extend to additional topics, such as the exchange of scientific data and the utilization of space resources. “The unprecedented momentum that the Accords are enjoying is a tribute to the global desire for norms of behavior in space,” said Mike Gold, chief growth officer at Redwire and a former NASA official who spearheaded the development of the Artemis Accords in 2020. - Argentina signs Artemis Accords - SpaceNews

Other Articles of Interest:
Go Time: The main thrust of Ukraine’s nearly two-month-old counteroffensive is now underway in the country’s southeast, two Pentagon officials said on Wednesday, with thousands of reinforcements pouring into the grinding battle, many of them trained and equipped by the West and, until now, held in reserve. For more than seven weeks, Ukrainian troops have fought along three main fronts across several hundred miles in the country’s east and southeast, pressing to find a weak spot in the heavily dug-in Russian defenses to burst through. They have been making plodding but steady progress clearing a path through dense Russian minefields and other fortifications. Ukrainian artillery barrages have been steadily attacking Russian artillery, ammunition depots, and command posts in areas well behind the front lines, creating a vulnerability to exploit if advancing Ukrainian forces can punch through the Russian defenses, and cause havoc in the rear. “The Russians are stretched,” a Western official said on Wednesday. “They are still experiencing problems with logistics, supply, personnel, and weapons. They’re feeling the pressure.” - U.S. Says Main Thrust of Ukraine’s Counteroffensive Has Begun - NYT

Deflation: Commerce Secretary Gina Raimondo says that a combination of export controls and domestic incentives will be needed for the US and its allies to fight a glut of semiconductor chips she warns will come with China’s aggressive industry subsidies. “The amount of money that China is pouring into subsidizing what will be an excess capacity of mature chips and legacy chips, that’s a problem that we need to be thinking about and working with our allies to get ahead of,” Raimondo said Wednesday at a panel hosted by the American Enterprise Institute. The United States needs to invest in its capacity to produce high-end chips, she said, while preventing the most advanced technology from reaching China. The Biden administration is working with industry leaders and coordinating with allies on a narrowly tailored set of new export controls, she said, while declining to provide an update on the time line. - Commerce Secretary Warns of Semiconductor Glut Due to China’s Subsidies – Bloomberg

Nowhere to Go: Russian President Vladimir Putin set as his objectives the “denazification” and “demilitarization” of Ukraine. By the first, he presumably meant regime change, in which case the war has clearly been a failure. Ukrainian President Volodymyr Zelensky’s position is as strong as ever. As for demilitarization, Ukraine is on its way to becoming the most militarized country in Europe. Even if Ukraine’s current offensive falters, Russia lacks for now the combat power to seize the advantage and take more territory. Putin is not close to achieving any of his war aims while the price of his gambit grows ever steeper.All trends—military, economic, diplomatic—continue to point in the wrong direction, and Putin has no convincing explanation for how the situation can be salvaged. The Russian president finds himself boxed in with no good options. - Putin Is Running Out of Options in Ukraine – Foreign Affairs

Podcasts and Videos:
For Fun:
VIEWS EXPRESSED IN "CONTENT" ON THIS WEBSITE OR POSTED IN SOCIAL MEDIA AND OTHER PLATFORMS (COLLECTIVELY, "CONTENT DISTRIBUTION OUTLETS") ARE MY OWN. THE POSTS ARE NOT DIRECTED TO ANY INVESTORS OR POTENTIAL INVESTORS, AND DO NOT CONSTITUTE AN OFFER TO SELL -- OR A SOLICITATION OF AN OFFER TO BUY -- ANY SECURITIES, AND MAY NOT BE USED OR RELIED UPON IN EVALUATING THE MERITS OF ANY INVESTMENT.
THE CONTENT SHOULD NOT BE CONSTRUED AS OR RELIED UPON IN ANY MANNER AS INVESTMENT, LEGAL, TAX, OR OTHER ADVICE. YOU SHOULD CONSULT YOUR OWN ADVISERS AS TO LEGAL, BUSINESS, TAX, AND OTHER RELATED MATTERS CONCERNING ANY INVESTMENT. ANY PROJECTIONS, ESTIMATES, FORECASTS, TARGETS, PROSPECTS AND/OR OPINIONS EXPRESSED IN THESE MATERIALS ARE SUBJECT TO CHANGE WITHOUT NOTICE AND MAY DIFFER OR BE CONTRARY TO OPINIONS EXPRESSED BY OTHERS. ANY CHARTS PROVIDED HERE ARE FOR INFORMATIONAL PURPOSES ONLY, AND SHOULD NOT BE RELIED UPON WHEN MAKING ANY INVESTMENT DECISION. CERTAIN INFORMATION CONTAINED IN HERE HAS BEEN OBTAINED FROM THIRD-PARTY SOURCES. WHILE TAKEN FROM SOURCES BELIEVED TO BE RELIABLE, I HAVE NOT INDEPENDENTLY VERIFIED SUCH INFORMATION AND MAKES NO REPRESENTATIONS ABOUT THE ENDURING ACCURACY OF THE INFORMATION