


Markets Will Transition from Optimistic to Cautious into Year-End as Consumers Shift from Resilient to Pragmatic - Midday Macro - 7/21/2023
Color on Markets, Economy, Policy, and Geopolitics

Markets Will Transition from Optimistic to Cautious into Year-End as Consumers Shift from Resilient to Pragmatic - Midday Macro - 7/21/2023
Market’s Weekly Narrative and Headlines:
The S&P is ending the week on a more neutral setting on this large OPEX Friday, with earnings dictating a more idiosyncratic price action feel. The bar is certainly high this earnings season, given the recent gains in some names, and price action following results has been somewhat outsized depending on the sector/stock. Of course, next week will bring even more earnings results, a Fed rate decision that seems set, a preliminary Q2 GDP look, as well as June’s PCE inflation data. This week’s data was more mixed, with core retail sales beating expectations while manufacturing activity fell and housing data came in weaker despite supply shortages persisting. Regional Fed surveys showed a cooling in current business activity readings but increased optimism regarding the future outlook. There was little new news out of the Fed, given we are in the pre-July meeting black-out period, but the NY Fed’s SCE Consumer Credit Access survey showed reduced availability, in line with tightening credit standards seen elsewhere. The Treasury curve bear flattened on the week, with front-end yields retracing half of their recent declines. Oil continued its July rally as second-half supply deficit fundamentals continued to drive the narrative. Copper was little changed on the week, with further indications of support for the Chinese property sector coming out of Beijing. The agg complex rose and saw increased volatility due to the closure of the Ukrainian grain corridor and India banning certain rice exports. Finally, the dollar regained some of its recent losses, with the $DXY moving back above 101, as weaker inflation elsewhere and other factors drove certain key pairs to reverse recent trends.

Deeper Dive:
With additional sell-side shops raising their end-of-year S&P price targets and increased soft-landing beliefs echoing through the chamber, we are increasingly wary of the current rally continuing much further. We don’t want to be contrarian just to be contrarian, but the economic headwinds are building as the full effects of tighter policy increasingly weigh on economic activity moving forward. As a result, the resilient consumer narrative that is driving current optimism seems founded more on hope than fundamentals, given our more sober outlook. Unfortunately, it's still a “tale of two cities,” as we wrote about several weeks back, with conflicting signals from both new economic data releases and market price action regarding where things are going. We still maintain the view that we are near the end of the current rally in U.S. stocks, but investors are “seeing what they want,” keeping sentiment skewed positively as a FOMO herd-like behavior has developed, stopping any meaningful sell-off so far. Despite this highly bullish sentiment, we are closing our Russell Index and EM longs. With seasonals becoming more negative, our belief that labor markets will continue to cool (but not crash), and, despite a broader and faster fall in inflation into year-end, a Fed that will continue to keep a hawkish stance as long as possible, all leading to risk assets facing greater headwinds. We also see these developments supporting real rates and reversing the recent weakness in the dollar, adding another headwind to risk assets. As a result, we are adding a dollar-long position to our mock portfolio through the $UUP Invesco Dollar Index Fund. With the Russell close to our target and our EM basket never really gaining the ground we hoped for due to the underperformance of China’s reopening, our closure of these longs is more an exercise in risk management and a desire to stay tactical, as is our addition of a dollar-long position.

*Stock indexes are increasingly looking overbought
*The markets look to be pricing in a perfect scenario for growth and earnings

*Greed is clearly back in charge, and although the timing is always uncertain, it usually indicates the rally is in its later innings

*For what it's worth, we forecast an end-of-year level of 4300 on the S&P
To be clear, we are far from believing a full-out recession will be upon us this winter, and as a result, expect only a moderate pullback in equity indexes, likely to the tune of -10%. We have long been in the soft-landing camp, given the strength of consumer and business balance sheets as well as labor market dynamics supporting aggregate demand through rising real disposable income levels. However, earning expectations will again trend lower as Q3 data shows a weakening economic backdrop, while earning multiples are pressured by higher real rates even as nominals remain range-bound. As a result, it seems the overbought conditions in stocks will need to cool, and bull-flag formation may form during the historically seasonally weaker part of the year over the next months. This leads us to add two short positions in the $IYT iShares Transport Index ETF and $XHB SPDR Homebuilder ETF. There is a lot to say here, and we plan to produce a more in-depth analysis and reasoning in next week’s writing, but we wanted to get the positions in the books now, given how we see things developing. We continue to hold the rest of our book as is, moving the stop up for our oil long to lock in profits. We see oil and copper both being in a structural supply deficit situation, and despite weaker growth concerns, this will drive prices higher. Again we expect a slowdown in global growth, not a crash. We also see China and India providing greater support to oil demand than expected while green initiatives globally more broadly drive copper higher even as FAI stagnates in China.

*Leading economic indicators, especially outside of stock prices, look to indicate a slowdown in activity is coming

*Credit tightening continues to occur and will increasingly weigh on final domestic demand

*While labor markets remain historically tight, rising continued claims, falling quits rates, and survey-based readings show a cooling is likely to continue
We are keeping this week’s Midday Macro’s Deeper Dive on the shorter side today. We continue to watch the increasing drip of stimulus out of China, something we will summarize further in future writings giving its importance to global growth and risk sentiment. Looking further out, we believe there is an opportunity for the U.S. and China to have above-trend growth in the second half of 2024. We have a long way to go to get there, and we never like to forecast that far out. Still, it is something we potentially foresee, and as a result, we hope to re-enter an EM-long position in the future based on this view and further drops in EM inflation, allowing for a meaningful and broad loosening in monetary policy. However, with our current belief that the dollar will tactically strengthen and a worry that a general risk-off tone will emerge, we are looking for a better entry then current levels. Again, we will further detail the reasoning behind our two new short positions next week. Finally, turning back to the bigger picture, our views expressed in last week’s writing were further reinforced with this week’s data, and we encourage those who did not have a chance to read them to please do so.

Please share our newsletter and feel free to reach out with any questions or comments.
Thank you for reading! - Mike Ball

RIP, Johnny Guitar. You were a great cat and will be missed.
Policy Talk:
The NY Fed released its quarterly SCE Credit Access Survey, which provides insights into the demand and availability of credit for consumers. The latest survey showed a decline to 40.3% in the total application rate over the last year, its lowest reading since October 2020, with auto and credit card limit requests falling but increasing for credit cards, mortgages, and mortgage refinances. The overall rejection rate for credit applicants rose to 21.8%, the highest level since June 2018, with the increase broad-based but highest in lower FICO-scored would-be borrowers. The rejection rate for auto loans increased to 14.2% from 9.1% in February, a new series high. The percentage of respondents reporting they would apply for any type of credit over the next year rose slightly to 26.4%.
Why it Matters: More Americans have been getting rejected for loans as banks tighten credit conditions. The rejection rate stood at 17.3% in February, a month before the failure of Silicon Valley Bank and other regional lenders. Since February, when the previous survey was published, the jump has been broad-based across age groups and highest among those with credit scores under 680. In another sign that higher rates are working their way into the real economy, the rejection rate for auto loans exceeded the application rate for the first time since the Fed's SCE Credit Access Survey started in 2013. Furthermore, the survey logged sharp increases in reported expectations that applications for new mortgages (46.1%), mortgage refinancing (29.6%), or increases in credit card limits (42.4%) would be rejected.

*Tighter credit conditions are increasingly reducing credit availability to the consumer

*Data elsewhere is showing auto loan delinquencies are rising notably
U.S. Economic Data:
Retail sales rose by 0.2% in June, following an upwardly revised 0.5% increase in May, but below forecasts of a 0.5% MoM rise. The so-called core retail sales, which exclude automobiles, gasoline, building materials, and food services, rose by 0.6% MoM. The largest increases were seen in sales at miscellaneous store retailers (2%) and nonstore retailers (1.9%). The largest declines were at gasoline stations (-1.4%) and building materials and garden equipment (-1.2%).
Why it Matters: Total retail sales are higher by 1.5% YoY, led by nonstore retailers (9.4%) and food services & drinking places (8.4%). However, given retail sales are not inflation-adjusted, total real retail sales continue to be negative on an annual basis and, at best, trending sideways since the beginning of 2021. However, markets took comfort in the fact that the PCE control group, the component of this report that feeds into the calculation of non-auto consumer goods spending within GDP, increased at a stronger-than-expected 0.6% MoM rate. In addition, sales for both April and May were revised slightly higher. Thus, despite the lower headline gain, the details of this report were stronger than expected. It’s worth quickly highlighting that another (higher-frequency) measure of retail sales, the Johnson Redbook Index, is showing outright contraction (also not inflation-adjusted) on an annual basis since early July, the worst reading since September 2020.

*Nonstore retailers saved the day, given their weight/size, with results more mixed elsewhere

*Gasoline stations are down -22.7% YoY due to falling prices; however, this summer’s driving season has gasoline demand higher than last year, according to the EIA

*The PCE retail sales control group has been higher for three months in a row, reversing the notable drop in March and increasing Q2 PCE estimates in the Atlanta Fed’s GDPNOW

*Real retail sales continue to be flat, but with goods inflation falling fast, this may start to change

*The weekly Redbook Same Store Sales Index is negative on a year-over-year basis
Industrial production fell by -0.5% in June, following an upwardly revised -0.5% decline in May and compared with market expectations of a flat reading. Manufacturing output decreased by -0.3% MoM, with nondurable and durable manufacturing falling -0.6% MoM and -0.1% MoM, respectively. There were broad monthly declines within the major market groups, with final products for consumer goods (-1.3% MoM) down notably, while business equipment was flat due to a decline in transit offsetting gains elsewhere. Mining output fell by -0.2% MoM due to declines in oil and gas well drilling(-2.8% MoM) being offset by nearly equal increases in extraction. The output of utilities decreased by -2.6% MoM. Capacity utilization fell to 78.9% in June from 79.4% in May and 0.8 percentage points below its long-run average.
Why it Matters: June’s industrial production report showed the cyclical part of the economy is slowing, with manufacturing output coming in weaker than expected, falling by -0.3% in June following a -0.2% drop in May (initially reported up 0.1% MoM). For the quarter as a whole, manufactured output expanded at a 1.5% annualized rate due to the 1.0% increase in April. While the output of business equipment was flat in June and down by -0.7% at an annual rate for the quarter, construction supplies rose 0.3% in June, the third consecutive monthly increase, and higher by a 5.2% annualized rate over the last three months. The bottom line is that June’s report brought a second month of broad cooling across the report, with capacity utilization also falling.

*Total industrial production and manufacturing, more specifically, look to be slowing since April

*Capacity Utilization fell for a third month and is down by 1.6 percentage points since last June
Housing starts declined by -8% in June to a seasonally adjusted annualized rate of 1.434 million, below market expectations of 1.48 million. May’s data was also revised lower. Single-family housing starts fell by -7% to 935K, while multi-unit starts decreased by -11.6% to 482K. Starts fell in the Northeast (-2.1% to 95K), Midwest (-33.1% to 162K), South (-4.4 % to 838K), and West (-1.2 % to 339K). Building permits fell by -3.7% in June to a seasonally adjusted annual rate of 1.44 million, down from the seven-month high of 1.496 million recorded in May and below market expectations of 1.49 million, according to a preliminary estimate. Approvals for the volatile multi-unit segment fell by -12.8% to a rate of 518K, the lowest level since October 2020, while single-family authorizations increased by 2.2% to a 12-month high of 922K. Permits were down in the South (-2.6% to 801K), West (-4.0% to 336 thousand), and Northeast (-23.4% to 105 thousand) but increased in the Midwest (5.9% to 198 thousand).
Why it Matters: Total housing starts in June were below expectations and starts in April and May were revised down. Single-family units under construction peaked a year ago, likely leading to greater pricing pressure in certain regions as new homeowners continue to face a lack of choices/inventory. However, there is a record level of multi-family units currently under construction due to both increased demand for rentals but also significant construction delays. In the longer term, as these projects are completed, they should reduce rental pressures. As a result, the housing picture still continues to be one of supply shortages supporting activity and not necessarily growing organic demand due to increased household formation. These supply and demand mismatches will continue to normalize slowly, likely cooling housing activity in 2024.

*Single-family starts have retraced some of their recent strength, although permits are at a 12-month high

*Multi-family units under construction are at historic highs.
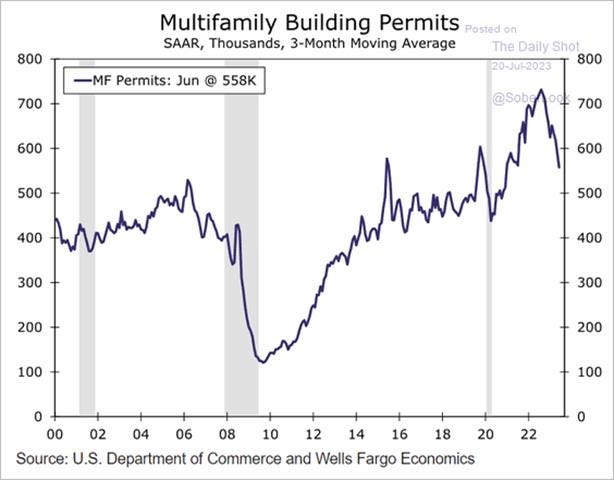
*Multi-family unit permits have peaked, and continue to fall
Existing home sales fell by -3.3% in June to a seasonally adjusted annualized rate of 4.16 million units, the lowest level in five months, compared to forecasts of 4.2 million. Sales declined in the South (-5.4%) and West (-5.1%), held steady in the Midwest, and rose 2% in the Northeast. Total housing inventory was 1.08 million units, identical to May but still down 13.6% from one year ago. Unsold inventory sits at a 3.1-month supply at the current sales pace, up from 3.0 months in May and 2.9 months in June 2022. The median existing-home price for all housing types in June was $410.2K, the second-highest price of all time and down 0.9% from the record-high of $413.8K in June 2022. Prices rose in the Northeast and Midwest but waned in the South and West. Properties typically remained on the market for 18 days in June, identical to May but up from 14 days in June 2022. First-time buyers were responsible for 27% of sales in June, down from 28% in May, while all-cash sales accounted for 26% of transactions, up from 25% in both May 2023 and June 2022.
Why it Matters: Despite the headline miss, sales varied by region in June, showing the increased role tight levels of supply have and perhaps how that is changing in varying parts of the country. Due to constrained supply/inventory and still poor affordability, existing home sales are -18.9% lower than a year ago. With inventory unchanged on the month, the supply constraints that are plaguing the industry are set to continue, propping up prices despite falling sales volumes. "There are simply not enough homes for sale. The market can easily absorb a doubling of inventory", NAR Chief Economist Lawrence Yun said. As a result, 76% of homes sold in June were on the market for less than a month.

*Existing home sales fell to the lowest level in five months

*Existing home inventory levels were stable but continued to be in a downward trend
The NAHB/Wells Fargo Housing Market Index increased to 56 in July, the highest level since June last year, matching market forecasts. The current single-family home sales sub-index rose to 62 from 61, while the prospective buyers sub-index rose to 40 from 37. On the other hand, the for home sales over the next six months decreased 2 points to 60. Builders’ use of sales incentives declined as the market has firmed and resale inventory options remain limited. Only 22% of builders reported cutting prices in July. This is down from 25% in June and 27% in May. Looking at the three-month moving averages for regional HMI scores, the Northeast increased five points to 52, the Midwest edged up two points to 45, the South increased three points to 58 and the West posted a five-point gain to 51.
Why it Matters: July’s increase was the seventh consecutive monthly increase in builders' confidence, marking the highest level since July last year. Low existing inventory is keeping demand greater than supply for new homes even as the industry continues to grapple with rising mortgage rates, elevated construction costs, and limited lot availability. “Although builders continue to remain cautiously optimistic about market conditions, the quarter-point rise in mortgage rates over the past month is a stark reminder of the stop and start the process the market will experience as the Federal Reserve nears the end of the ongoing tightening cycle,” said NAHB Chief Economist Robert Dietz. “The lack of resale inventory means prospective home buyers who have not been priced out of the market continue to seek out new construction in greater numbers,” said NAHB Chairman Alicia Huey, a custom home builder and developer from Birmingham, Ala. “At the same time, builders are troubled over rising mortgage rates approaching 7% and continue to grapple with supply-side challenges, including ongoing scarcity of electrical transformer equipment and growing concerns about lot availability.”

*The overall sentiment index continues to recover much of its 2022 losses, although future sales expectations did fall in July
The Philadelphia Fed Manufacturing Index was little changed at -13.5 in July from -13.7 in June, worse than market forecasts of -10. Demand and activity weakened, with New Orders (-15.9 vs. -11) further contracted while Shipments (-12.5 vs 9.9) notably fell into negative territory. Unfilled Orders (-15.1 vs. -18.5) did improve slightly but remained well in contractionary territory. Delivery Times (-12.9 vs. -16.1) shortened at a slower pace, while Inventories (-1 vs. -3.5) sentiment moved close to neutral. Price readings increased dramatically due to Prices Received (0.1 vs. 23) moving up significantly while Prices Paid (9.5 vs. 10.5) were little changed. Employment readings generally improved, with the Number of Employees (-1 vs. -0.4) little changed, while Average Workweek (-3 vs. -8.2) moved closer to neutral. Every six-month ahead indicator improved outside of capex intentions, which was little changed. In fact, future New Orders and Shipment readings jumped higher while expected unfilled orders moved back into expansion. Price readings did also rise, as did employment ones.
Why it Matters: It was a tale of two cities, with the relatively unchanged current general business activity reading hiding notable weaknesses in demand and activity measures as well as little progress on the inflation front. On the other hand, six-month ahead readings made it look like the future held no problems, with one of the strongest and broadest increases in readings this analyst has seen in a while, leaving one to wonder what to think about the contrast between the two. The month’s special question asked respondents about changes in wages over the last three months as well as expectations moving forward. Around 58% of the firms indicated increased labor costs over the past three months, with 42% reporting no change and none reporting decreases. Most firms (60%) reported not needing to adjust their 2023 budgets for wages and compensation since the beginning of the year; however, 30% noted they are planning to increase wages and compensation by more than originally planned. Generally, firms still expect cost increases across all categories of expenses in 2023, with the median expected increases between 3 to 4% for wages and 4 to 5% for total compensation (wages plus benefits), both unchanged from April.

*Current activity readings were weaker at the sub-index level but saw broad and strong gains for six-month ahead readings

*There was a significant jump in prices received while prices paid were little changed

*Gains in six-month ahead readings indicate firms are not too worried about the current slow down in demand and activity
NY Fed’s Empire State Manufacturing Index fell 5.5 points from a month earlier to +1.1 in July, beating market expectations of -4.3. Demand and activity measures weakened on the whole, with New Orders (3.3 vs. 3.1) little changes, slightly expansionary, while Unfilled Orders (-8.8 vs. -8) were also little changed, remaining contractionary. Shipments (13.4 vs. 22) fell from highly elevated expansionary readings but remained notably positive. Delivery Times (-6.9 vs. -1) increasingly shortened, and Inventories (-10.8 vs. -6) continued to decline. Both Prices Paid (16.7 vs. 22) and Prices Received (3.9 vs. 9) fell. Labor readings improved, with hiring intentions as seen in the Number of Employees (4.7 vs. -3.6) and Average Employee Workweek (0.3 vs. -5.8) both moving back into expansionary territory. Forward-Looking indicators for demand and activity broadly weakened, although readings remained well in expansionary territory. Inflationary expectations increased further into expansionary territory while labor readings cooled, but future hiring intentions still indicated a notable level of expansion. Finally, capex and tech spending plans both fell, moving closer to a neutral reading.
Why it Matters: The latest reading suggested business activity in the New York region was flat. However, July’s report delivered the right mix of readings for Fed officials to take comfort that inflation continued to fall, labor markets were cooling, but a soft landing scenario was still intact. However, although still expansionary at the general-business activity level, forward-looking readings for hiring and investing cooled broadly while expected inflationary readings rose.

*Demand was little changed while activity cooled in July, moving the overall index closer to neutral

*Current and future hiring readings expanded with the workweek no longer shrinking

*Price measures continue to trend lower and are now well in the pre-pandemic range

*Capex and It spending intentions fell, contrasting against increased hiring intentions as a gauge of business confidence
The NY Fed’s Business Leader Survey for service firms moved to a neutral reading (0) in July from -5.2 in June, its first non-negative reading in ten months. Readings on the current Business Climate (-28.1 vs. -35.6) rose but remained well in an area that suggests a ‘worse than normal” environment. The Number of Employees (6 vs. 8.6) moved to a slower expansion rate. Wages (33.1 vs. 35.6) also fell further, still well in expansionary territory but trending lower since February. Prices Paid (50.6 vs. 50), and Prices Received (21.8 vs. 22.8) were little changed. Current Capital Spending (0 vs. -3.5) improved to a neutral reading. Forward-Looking readings were more upbeat, with the general Future Business Activity (23.2 vs. 14.4) index expanding notably, although the expected business climate worsened. However, hiring and compensation intentions rose, while price readings skewed slightly lower and capex plans notably rose.
Why it Matters: The service sector in the NY Fed’s district returned to a more neutral level of “business activity” after almost a year of contractionary headline readings. Of course, these past contractionary readings ran counter to what had been seen in other economic data, reducing the predictive power of the survey. Improving business climate readings and lower trending wages and price readings indicate that inflationary headwinds to confidence are slowly fading despite July’s more sticky readings. Hiring activity has also been stable and slowly cooling, although intentions seem to have bottomed and are trending higher. Finally, capital spending looks to have improved on the month with better future confidence indicated by rises in six-month ahead Capex plans despite worries about worsening business climate.

*Both current and six-month ahead business activity readings rose in July

*Current inflationary-related readings continue to trend lower, although things were more sticky in July
Technicals, Positioning, and Charts:
The S&P is outperforming the Nasdaq and Russell, with Low Volatility and High Dividend Yield factors, as well as Utilities, Health Care, and Consumer Discretionaries outperforming on the day. Leadership at the sectorial level on the week favored Health Care, Financials, and Energy, with Communciation and Consumer Discretionary underperforming. High Dividend Yields and Value were the best-performing factors on the week. Earnings results helped drive performance generally, leading financials/dvd-yielders despite a backup in Treasury yields, while tech/growth was hurt by sell-offs in large caps in those sectors/factors.

@KoyfinCharts
S&P optionality strike levels have the Zero-Gamma Level at 4474 while the Call Wall is 4550 and Put Wall is 4300. Today's OPEX sees 25% of total S&P gamma and 30% of QQQ gamma expiring. This should serve to reduce overhead positive gamma, a force which, into this week, has been pushing volatility down. As a result, spotgamma sees vol rising, and with next week’s catalyst-heavy week, a shift higher in the recent daily trading ranges.

@spotgamma
S&P technical levels have support at 4560, then 4535, with resistance at 4600, then 4625. The S&P is still in a strong uptrend, where dips have been bought, favoring longs. With that said, the break below 4580 was a small back-test. 4540 is the next major support area, with a failure opening up a clearer path lower. Finally, a move below 4490, which is the major June/July resistance of the ascending triangle formation, would signal the bears are in charge, and either a chop in that area or a deeper sell leg would commence. Stepping way back and the larger rising channel in white of the march lows is the ultimate guide, with support at 4375.

@AdamMancini4
Treasuries are higher on the day, with the 10yr yield lower by 2 bps to 3.83%, while the 5s30s curve is little changed on the session, moving to -19 bps.

Four Key Macro House Charts:

Growth/Value Ratio: Value is higher on the day and the week, with Small-Cap Value the best-performing size/factor on the week.

Chinese Iron Ore Future Price: Iron Ore futures are higher on the day and the week.

5yr-30yr Treasury Spread: The curve is flatter on the day and on the week.

EUR/JPY FX Cross: The Euro was stronger on the day and on the week.
Other Charts:

Retail investors' bullish sentiment is back to levels last seen during the height of the Meme stock mania in early 2021, with high levels of inflow, although this week saw a slight slowdown there. Prime desks noted a high level of short covering from buyside clients this week, while the NAAIM investment manager index shows managers boosting equity exposure further. Everyone is chasing this rally now.

Seasonals will increasingly work against stocks in Q3, with the VIX near the bottom of its average annual range.
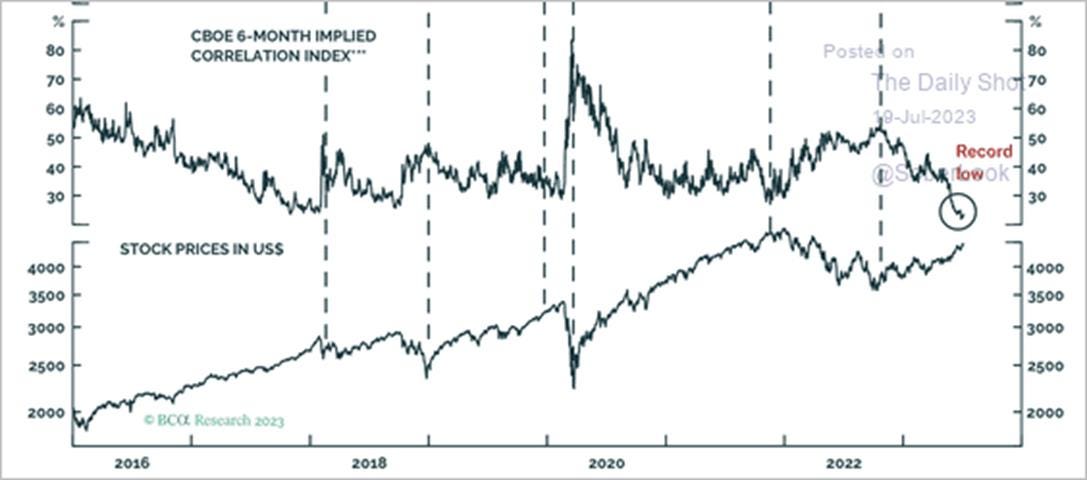
Implied correlation among stocks is at a 17 year low, something we believe will reverse in the second half, supporting the idea that the VIX is near its lows of the year.

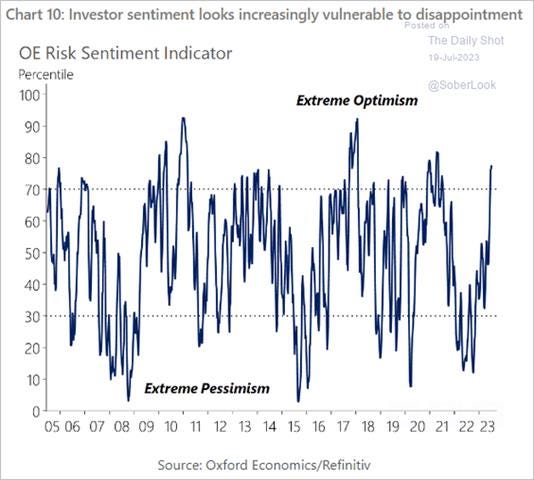
Equities look overbought relative to bonds, and with high bars set going into earnings, it seems perfection is priced in, and markets will be disappointed, as seen already in early earnings reactions.
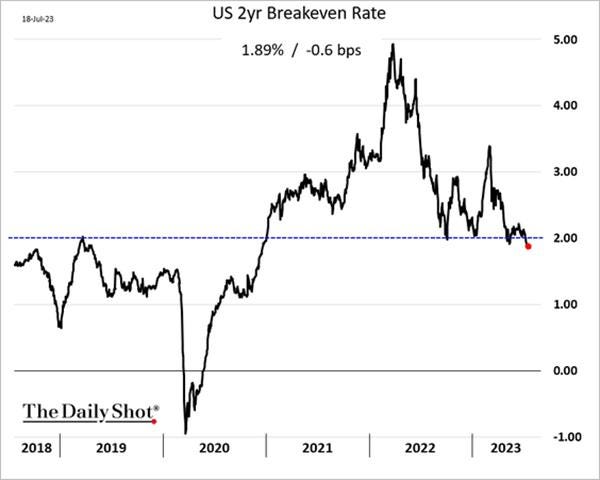
The 2-year US breakeven rate (inflation expectations) dipped below 2%. - @SoberLook

Loan volumes continue to fall, with tighter lending standards and weaker demand both contributing to the trend lower.

Spending growth among renters and homeowners used to largely move together. But starting in early 2022, a gap emerged — renters' spending growth started lagging that of owners, per Bank of America's internal card spending data. This year, renters' spending growth has gone negative. In June, it was down 1.4% from a year ago. – Axios Markets

“The credit crunch has started.” - Torsten Slok, chief economist at Apollo Global Management

Global inflation readings continue to surprise to the downside.
Articles by Macro Themes:
Medium-term Themes:
China’s Post-Pandemic Life:
Pulling Levers: The People’s Bank of China set its daily fixing on Wednesday at just under 7.15 per dollar, 680 pips stronger than expected and the largest bias since November. Further, China's major state-owned banks were seen selling dollars to buy yuan in the offshore spot market in early Asian trades on Thursday. Such state bank dollar selling is usually meant to slow the pace of yuan declines. China's central bank on Thursday also announced a relaxing of a cross-border financing rule, making it easier for domestic firms to raise funds from overseas markets and easing depreciation pressure on the yuan currency. The PBOC has plenty of other tools in its arsenal if the weakness continues. On top of the fixing, the central bank could get large lenders to sell the dollar in afternoon trading, boost the liquidity of foreign currencies in the onshore market and increase the cost of shorting the yuan with forwards. - China's state banks selling dollars offshore to slow yuan declines - Reuters

Reversing Restrictions: Chinese authorities are considering easing home buying restrictions in the nation’s biggest cities, scrapping rules that disqualify people who’ve ever had a mortgage from being considered a first-time homebuyer in major cities. Currently, homebuyers with a mortgage record who don’t own property are still subject to the higher down-payment and more restrictive borrowing limits applied to those buying a second home. Some state banks have submitted relevant mortgage data and feedback to the regulators over the past months. This change potentially removes a hurdle that has curbed demand in Beijing and Shanghai for years. The government also took a step toward supporting the ailing property market by extending loan relief for developers this month, adding to a slew of measures in a sweeping 16-point rescue package last year. - China Mulls Mortgage Easing to Spur Homebuying in Big Cities - Bloomberg

Longer-term Themes:
Cyber Life and Digital Rights:
Non-Compliance: Facebook and Instagram will soon be temporarily banned in Norway from tracking users online to target them with advertising. Meta's advertising practice on Facebook and Instagram currently involves the "processing of very private and sensitive personal data through highly opaque and intrusive monitoring and profiling operations," wrote Norway's Datatilsynet agency. The ban on so-called behavioral advertising will last three months. Facebook and Instagram will be able to show people customized ads but only based on information given by users in the "about" section of their profiles. The Norwegian regulator is the first European privacy authority to severely restrict Meta's data-driven business following the EU's top court ruling. - Facebook, Instagram face Norwegian ban from tracking users for ads - Politico

Walk-Out: The UK government is seeking to update the Investigatory Powers Act and wants messaging services to clear security features with the Home Office before releasing them to customers. The act lets the Home Office demand security features be disabled without telling the public, and hence negatively affects end-to-end encryption messaging services. WhatsApp and Signal are among the platforms to have opposed a clause in the Online Safety Bill allowing the communications regulator to require companies to install technology to scan for child-abuse material in encrypted messaging apps and other services. They will not comply with it, they say, with Signal threatening to "walk" from the UK. Apple also opposes the plan and says it will remove services such as FaceTime and iMessage from the UK rather than weaken security if new proposals are made law and acted upon. - Apple slams UK surveillance-bill proposals - BBC

A.I. All Day:
Warnings: U.S. Securities and Exchange Commission Chair Gary Gensler says the proliferation of artificial intelligence means governments will probably have to overhaul regulations to maintain global financial stability. “AI may heighten financial fragility as it could promote herding with individual actors making similar decisions because they are getting the same signal from a base model or data aggregator,” he said in remarks prepared for a speech on Monday before the National Press Club in Washington. “While current model risk management guidance — generally written prior to this new wave of data analytics — will need to be updated, it will not be sufficient.” On a more micro level, companies need to be aware of how their use of AI may implicate securities rules, he said. Whether it is used for financial fraud, juicing corporate returns or steering investors toward specific products, the SEC will be on the lookout, Gensler said. - SEC’s Gensler Warns AI Risks Financial Stability - Bloomberg

Boom Times for Tech Lawyers: The Federal Trade Commission recently opened an investigation into whether OpenAI violated consumer protection laws by scraping people’s online data to train its popular AI chatbot ChatGPT. Meanwhile, artists, authors, and the image company Getty are suing AI companies such as OpenAI, Stability AI, and Meta, alleging that they broke copyright laws by training their models on their work without providing any recognition or payment. If these cases prove successful, they could force OpenAI, Meta, Microsoft, and others to change the way AI is built, trained, and deployed so that it is more fair and equitable. As a result, as we start to see the results of lawsuits trickle in, it will be judges, not the government, forcing companies to change their practices. - How judges, not politicians, could dictate America’s AI rules – MIT Review

Energy’s Midlife Crisis:
Plugging Them Up: The U.S. shale patch is shedding rigs at the fastest pace since the height of the Covid-19 pandemic despite healthy oil prices. Behind the drop is a tale of the haves and the have-nots. Private companies, which added rigs at a breakneck pace as the pandemic abated, have drilled up many of their best-remaining wells, forcing them to decelerate. Meanwhile, their larger, public brethren aren’t tweaking their drilling programs as they sit on larger inventories of premium, undrilled wells. The number of rigs drilling for oil and gas has dropped to about 670 from around 800 at the beginning of the year, with private drillers accounting for roughly 70% of the decrease. The slowdown augurs tepid U.S. crude-production growth, with the Energy Information Administration expecting domestic growth output to increase by fewer than 300K barrels a day in 2024 from this year. - The Shale Industry Is Dropping Drilling Rigs, Fast – WSJ

Food: Security, Innovations, and Climate Change Implications:
Banned: India has banned exports of non-basmati white rice, stoking fears of further global food inflation just as Russia’s targeting of grain ships has pushed up wheat and corn prices. India is the world’s biggest rice exporter, accounting for about 40 percent of global exports. It is followed by Thailand and Vietnam, where prices for rice have also surged this year, raising costs for countries hoping to circumvent New Delhi’s ban. Higher prices for the grain, a staple for billions of people worldwide, is likely to stoke global food inflation, analysts said. India has been contending with higher food prices in recent weeks after heavy monsoon rains damaged crops and disrupted transport, raising the price of tomatoes and other staples. - Indian ban on rice exports stokes fears of global food inflation – FT

Getting it Out: Wheat prices have fallen nearly 50% from their 2022 peak, easing pressure in the Global South. However, unlike earlier in the war when blockades were initially implemented, Ukrainian shipments largely flow west into European nations and China rather than hungry countries in Africa. Meanwhile, Russia’s own wheat exports have surged to an all-time high. In another development in the past year, Kyiv is also struggling with the overland route as several Eastern European nations have imposed their own bans on Ukrainian foodstuff exports to protect domestic farmers. The de facto embargoes are in response to a flood of Ukrainian grain depressing local prices in Poland, Bulgaria, Hungary, Slovakia, and Romania. Russia isn’t the only country handicapping Ukrainian farming. - Russia Weaponizing Wheat Won’t Hurt the World - Bloomberg

Cold Places (Deep Sea, Artic, and Space Colonization):
Gaining Market Share: SpaceX accounts for just over 60% of the world's satellite launches this year. This year, as of the end of June, the company had already put more than 1,000 satellites in orbit. SpaceX has sent nearly 5,000 satellites to space since 2019 and has applied for permission to operate a total of 42,000. SpaceX's Starlink satellites can offer high-speed internet, and to get internet access, Starlink customers only need to install a 50-by-30-centimeter antenna. Starlink has grown primarily in the business-to-business segment. Starlink has also played an important role in Ukraine, where many ground communications facilities have been destroyed in Russian attacks. - Elon Musk dominates orbit with Starlink satellites - NikkieAsia

Other Articles of Interest:
In Defensive Of: Officials from the National Economic Council and Council of Economic Advisers wrote in a new paper that hundreds of billions of dollars President Joe Biden approved for infrastructure, the energy transition, and domestic semiconductor manufacturing are essential for keeping the US competitive and that those fields suffered from decades of private sector neglect. White House economic advisers wrote that “public investment can attract more private sector investment, rather than crowd it out.” The paper cited more than $500 billion in commitments from companies on new US semiconductor and electronics manufacturing and also clean energy, electric vehicle, and battery projects as evidence the approach has bolstered domestic industries. The paper also offered a defense of elements of Biden’s signature legislation, such as “buy American” and prevailing wage provisions. Critics have said those policies could hamper underlying projects and products by making them more expensive compared to their competition. - White House Economists Defend Industrial Policy in New Paper – Bloomberg

Higher Real Wages: Inflation-adjusted average hourly wages rose 1.2% in June from a year earlier. That marked the second straight month of seasonally adjusted gains after two years of the opposite. If the trend persists, it gives Americans leeway to propel the economy through increased spending, which could help the U.S. skirt a recession. Since estimates earlier this year, economists surveyed by The Wall Street Journal have lowered the probability a recession will start in the next 12 months. Raises for lower-income workers were particularly strong in early 2023. Restaurants, hotels and similar businesses hired at a brisk pace to cater to customers eager for services that were limited initially in the Covid-19 pandemic. While leisure and hospitality employment gains have slowed in recent months, workers in the industry saw their hourly pay rise faster than overall wage growth and inflation. Wages for manufacturing and business-services workers are also outpacing inflation. Pay gains have been narrower in the tech-heavy information sector, where several large companies have cut staff. - Pay Raises Are Finally Beating Inflation After Two Years of Falling Behind - WSJ

Reprieve: The U.S. and about 140 other jurisdictions agreed in late 2021 to impose a 15% minimum tax on large companies in each country where they operate. But implementation has been slow and messy. The 15% minimum tax must be calculated consistently across countries and companies, requiring clear definitions that have led to a series of technical rules, including Monday’s 91-page update. The U.S. has a 10.5% minimum tax on U.S. companies’ foreign income that was and a 15% minimum tax on large companies’ global profits that was enacted last year. Neither conforms to the global deal, however. So as the OECD hammers out the rules, the U.S. has looked for ways to make the country’s system fit the international framework. “The U.S. hasn’t done anything to adopt these rules, and yet it’s clear that they are still able to exercise some leverage over how these rules are being adjusted to accommodate U.S. considerations,” said Daniel Bunn, president of the Tax Foundation, a Washington group that favors lower tax rates and a simpler tax system. - U.S. Companies Score Partial Reprieve From Global Minimum Tax Deal - WSJ
Podcasts and Videos:
VIEWS EXPRESSED IN "CONTENT" ON THIS WEBSITE OR POSTED IN SOCIAL MEDIA AND OTHER PLATFORMS (COLLECTIVELY, "CONTENT DISTRIBUTION OUTLETS") ARE MY OWN. THE POSTS ARE NOT DIRECTED TO ANY INVESTORS OR POTENTIAL INVESTORS, AND DO NOT CONSTITUTE AN OFFER TO SELL -- OR A SOLICITATION OF AN OFFER TO BUY -- ANY SECURITIES, AND MAY NOT BE USED OR RELIED UPON IN EVALUATING THE MERITS OF ANY INVESTMENT.
THE CONTENT SHOULD NOT BE CONSTRUED AS OR RELIED UPON IN ANY MANNER AS INVESTMENT, LEGAL, TAX, OR OTHER ADVICE. YOU SHOULD CONSULT YOUR OWN ADVISERS AS TO LEGAL, BUSINESS, TAX, AND OTHER RELATED MATTERS CONCERNING ANY INVESTMENT. ANY PROJECTIONS, ESTIMATES, FORECASTS, TARGETS, PROSPECTS AND/OR OPINIONS EXPRESSED IN THESE MATERIALS ARE SUBJECT TO CHANGE WITHOUT NOTICE AND MAY DIFFER OR BE CONTRARY TO OPINIONS EXPRESSED BY OTHERS. ANY CHARTS PROVIDED HERE ARE FOR INFORMATIONAL PURPOSES ONLY, AND SHOULD NOT BE RELIED UPON WHEN MAKING ANY INVESTMENT DECISION. CERTAIN INFORMATION CONTAINED IN HERE HAS BEEN OBTAINED FROM THIRD-PARTY SOURCES. WHILE TAKEN FROM SOURCES BELIEVED TO BE RELIABLE, I HAVE NOT INDEPENDENTLY VERIFIED SUCH INFORMATION AND MAKES NO REPRESENTATIONS ABOUT THE ENDURING ACCURACY OF THE INFORMATION