A Tale of Two Markets: Equities vs. Rates - Who is Right in a Higher for Longer World? – Midday Macro - 6/30/2023
Color on Markets, Economy, Policy, and Geopolitics
A Tale of Two Markets: Equities vs. Rates - Who is Right in a Higher for Longer World? – Midday Macro - 6/30/2023
Daily/Weekly Price Action and Headlines:
Equities are higher on the day and the week, with a notable rally to end the week thanks to Tech and Discretionaries but more mixed leadership on the week thanks to a stronger growth outlook supporting cyclical sectors and real estate
Treasuries are lower on the day and week, with yields continuing to trend higher and the curve flattening, while the MOVE index was little changed, as Powell came out more hawkish in Portugal, noting that two additional rate hikes were likely
Oil is higher on the day and the week, with sentiment becoming more positive due to inventory draws, increased focus on second-half supply deficits, and continued hopes for further stimulus in China as well as Saudi Arabia starting its production cuts next week
Market’s Weekly Narrative:
The S&P is ending the week on a positive note for equities, as today’s PCE inflation data came in line, while the Univ. of Michigan’s consumer confidence report showed a further improvement in sentiment. Tech and consumer discretionaries were the clear leaders today, but the week saw a broader set of leadership/outperformance that had a cyclical tilt as growth expectations continued to improve for the second half of the year following positve GDP revisions that saw higher personal consumption expenditures. Regional Fed Business surveys also painted a more optimistic picture, while housing data was more mixed due to supply issues persisting, but also tilted positively. Treasuries reversed some strength following today’s inline inflationary readings and ended the week with yields near recent highs, with the curve further inverted. Oil saw a relief rally on the week but remains near recent lows as inventory data and supply worries began to control the narrative more than missing demand. Copper also posted a late-week rally, although it finished down on the week, continuing a weaker trend despite a positive fundamental story. The agg complex became more volatile, trending lower earlier in the week due to improved weather but moving idiosyncratically after the quarterly grain report today. The dollar ended the week slightly higher, reversing gains from hawkish Powell comments on today’s inline PCE report, with the $DXY closing near 103.
Deeper Dive:
Risk assets are having a more positive reaction to the recent stronger economic data in the U.S. despite the Fed again moving the “higher for longer” goalpost for policy in a more hawkish direction, leading nominal yields higher while real rates remain rangebound. For certain, the economy has so far proved more resilient to rate hikes than most had expected. As often covered here, pandemic-era policy support helped households and businesses strengthen their balance sheets and reduce their leverage. Coupled with tight labor markets, this supported consumption and drove higher levels of investment. Falling headline inflation is leading to higher real wage gains and improving confidence/sentiment, all of which are keeping aggregate demand healthy. Fiscal stimulus/incentives have supported an already strong private sector investment pulse, which has again gained steam in the second quarter, driving construction activity, especially for manufacturing facilities, and supporting capital goods demand more generally. Further, low levels of housing inventory have caused residential investment to reverse recent weakness and become a more positive contributor to overall growth. Many regional business surveys are now improving as activity has been stronger than expected while supply-side impairments continue to improve, reducing inflationary cost pressures. Uncertainty is high and varies by industry; nonetheless, there is a stronger-than-expected level of fixed asset investment occurring domestically currently, supporting domestic private real final sales when combined with resilient but slowing personal consumption expenditures.
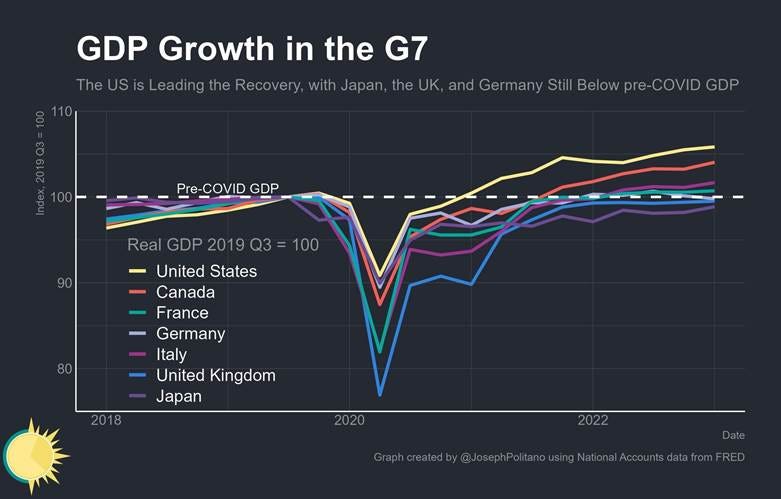
*The U.S. continues to outperform other developed markets, and we believe this will lead the Fed to stay “higher for longer” than other G7 central banks
*Headline inflation is falling the fastest in the U.S. despite higher growth as supply-side cost-push pressures are abating faster
*Real final sales were revised higher due to an upward revision to personal consumption expenditures…
*… and although projected to be lower in Q2 due to lower levels of PCE, will likely still remain highly positive due to neutral residential and higher fixed investment
However, it takes time for higher rates to filter through the economy, and these magical uncertain variable lags we keep hearing about from policymakers are going to increasingly weigh on economic activity into year-end and throughout 2024. As a result, the recent improvement in investor sentiment due to stronger growth, the continuation of the current equity market rally, and more stable credit market backdrop seems to be coming right when macro headwinds, especially from tighter monetary policy, are increasing. As a result, we see increased reason for caution moving forward. Consumer spending is slowing, especially in real terms, as seen in retail sales and today’s personal consumption data for May. PCE’s outsized contribution to Q1 GDP will not be occurring in Q2, giving us worries that recently raised earning expectations will have to fall again. Further, consumer confidence surveys may be seeing headline increases due to falling inflation and debt-ceiling drama ending. Still, respondents increasingly note intentions to pull back from non-essential purchases while sentiment regarding future job and income security is weakening. Higher frequency spending data and company and business commentary are warnings of slower activity in leisure and hospitality as the consumer may finally be burned out on post-lockdown service demand. This increasingly puts positive risk asset performance at odds with yield curve warnings. Something has to give. With the 10yr-2yr Treasury yield curve negatively inverted by the greatest amount since late 1981 and the S&P back at pre-Fed hiking levels, we are getting two very different stories about what future growth will be, and we haven’t even discussed what oil prices are saying about global growth.
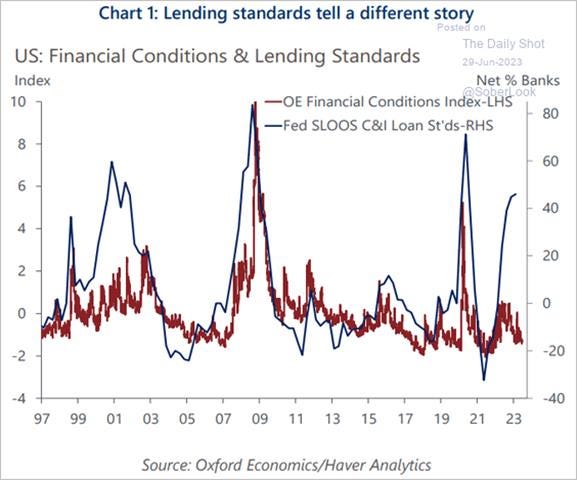
*Market-derived financial conditions look to be easing, but credit conditions continue to grind tighter, putting further weight on economic activity
*Rate insensitivity has been greater than expected in many places, but the economy is increasingly feeling the effects of tighter policy
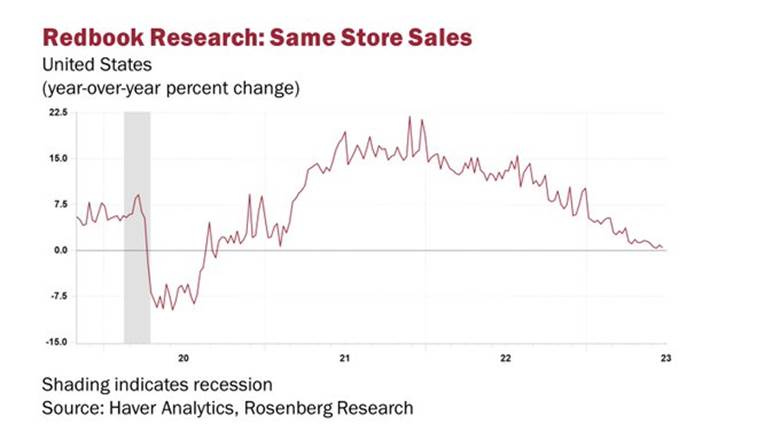
*Real retail sales may be moving sideways, but higher frequency Redbook data is consistently weakening
*Business surveys, although more stable/positive recently, still indicate a below-trend period of growth is coming, and this will pressure profit margins to fall
As a result of our worries that fundamentals will increasingly become negative in the second half of this year, we are less optimistic about our Russell Index small cap long, but positive July seasonals will drive it to hit our not-too-distant target price. Further, due to our more pessimistic view on growth and belief that the Fed is making a policy error and will be slow to recalculate its risk management priorities, we believe our long-end Treasury position will perform well in the second half of this year. We also see no reason to change our short Euro Stoxx and Silver positions, which have similar headwinds from slower growth, tighter policy, and higher real rates. Finally, we have been stuck in no man's land regarding our longs in EM, oil, and copper, a basket that is generally expressing one trade, a stronger growth pulse out of China. As a result, we want to spend some time looking at China in today’s Deeper Dive section.
*We continue to hold our positions the same but did move stops slightly lower in $IWM, $EEM, and $EEMA, given we see a positive seasonality-driven pulse in July. Our average return per position is now 4.9%.
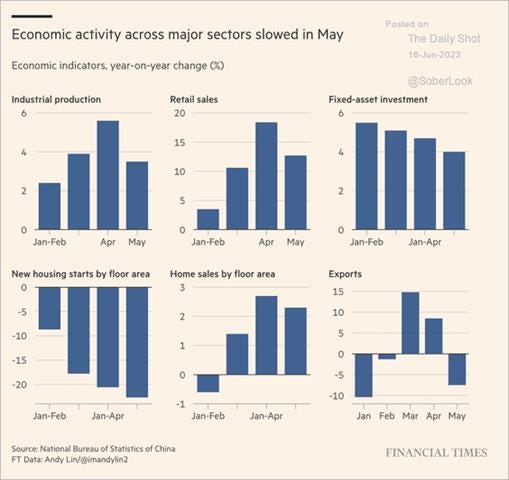
What is really going on in China? At this point, the best way to think about that is from a “what will Beijing do” perspective. This means thinking about both domestic growth goals but also national security priorities. With that said, let’s first look at where things are through these lenses. It certainly seems like much of China’s economy is in the dumps despite still high overall growth levels. Consumer spending remains weaker than expected, with May’s retail sales rising by 12.7% instead of the expected 13.6%, down from April’s 18.4% reading. During the recent holiday, domestic travel spending for the dragon-boat festival was lower than pre-pandemic levels, although box office revenues were higher. Consumer confidence is still well off pre-Covid levels. This reduces big-ticket purchases and leads potential homebuyers to be less responsive to decade-low mortgage rates. There also seems to be a changing view on whether a home is a good investment, as years of property-sector problems have finally structurally altered cultural thinking. Finally, the jobless rate among young Chinese climbed to a new high of 20.8% in May, and when coupled with a declining fertility rate, new household formation isn’t improving, a key driver of long-term growth.
*With the post-open Covid outbreak finally over, hopes were for a stronger Dragon Boat Festival period as consumer behavior normalizes, but this was not the case
*Higher youth unemployment is a worrying thing for authoritarian states, while lower fertility rates will weigh on growth more generally
Business activity is slowing more broadly, not just in manufacturing but also increasingly in the service sector. Recent China Sales Manager’s Surveys for services and manufacturers showed a continuation of declining sales and profitability in June after a more positive start to the year. Manufacturing is being weighed on by lower levels of exports as demand for goods globally continues to weaken. It’s also being reported strikes at Chinese factories have surged to a seven-year high as disgruntled workers are pressing for unpaid (or reduced) wages while others are protesting plans to shut down factories altogether. Activity in China’s automotive industry did increase in May, with production up by 9.4% from a month earlier and 21% higher year-on-year, but high levels of dealer promotions drove sales and will hurt profits. EV production was up by 53% from a year earlier, but the rate of sales growth has moderated in recent months on account of a cutback in EV subsidies. Real estate was again behind the private investment drop, with property outlays down more than -10% in May from a year before. Finally, more generally, credit is growing at a slower pace than needed. New bank loans picked up in May, with household loans, including mortgages, higher by $52 billion in May versus a contraction of $34 billion in April. Corporate loans rose to $120 billion from $96 billion in April. While all these increases are positive, they should be growing much faster at this stage of China’s recovery cycle.
*Economic data across the board in China slowed in Q2
*Car sales, and to a lesser extent retail sales, continue to grind higher while other measures of activity have turned lower from highs earlier in the year
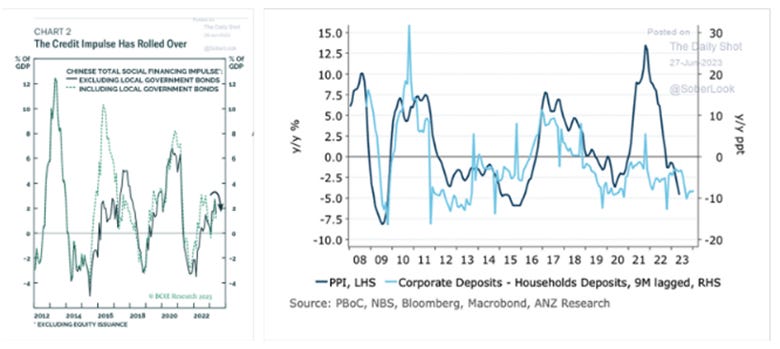
*The credit impulse turned down last month while corporate cash levels have moved lower with the PPI
Switching away from the economy, China’s wolf warrior stance and perceived geopolitical risk premium have only grown. Xi and the CCP have moved further to insulate China from foreign interference/reliance. In regards to foreign relations, both on the official and private business level, China’s new Foreign Relations Law looks to formalize the protection of Chinese foreign assets/business ventures while also gaining control over foreign companies operating in the mainland if it perceived to be in the best interest of national security. The law effectively secures supply channels while also giving leverage over foreign states by threatening control of private investments domestically. This coincides with revisions to the counter-espionage law targeting foreign businesses and new initiatives to secure resources more generally. All these policies fold under the broader dual-circulation objects Xi has used as a guiding principle for some time. A principle that calls for a more organically and domestically driven economy that foreign threats can not hurt as easily.
*“These trends, if sustained, imply that China’s FDI may turn from net inflows over the past two decades to net outflows in the coming years,” Goldman economists Hui Shan wrote.
So what now? We had a reopening at the end of last year. Everyone went out and spent money initially after literally a year of being locked down. Then everyone got Covid, millions likely died, and confidence in the system was further weakened from a low level. Already rattled by protests that forced the abrupt end of the zero-Covid policy, Beijing could not fully capitalize on the reopening as unemployment and business/consumer confidence remained weak/negative. Western pressures led by the U.S. also did not change materially, with the relationship worsening by many standards. Add in the recent events in Russia and the increased perceived weaknesses there, and Beijing is in an even worse spot. Although China has been putting some distance between itself and Moscow in recent months by warning against the use of nuclear weapons, calling for the protection of civilians, and sending an envoy to Kyiv, it is still heavily invested in the success of Putin. Whether the Putin regime has truly been weakened or not is a whole other story, but let’s assume for now, Ukraine and the West have benefited from the fake-Wagner coup. All this leads us to think that Beijing needs the Chinese economy as strong as ever for the CCP to reassert itself domestically and meet national security goals.
* Chinese imports on a volume basis are rising . Copper imports are higher than ever, imports of soybeans and crude oil have both made a low and started rising. Stocking up for winter?
*A decreasing money supply does not bode well for consumer spending moving forward, as a result the credit/money supply channels will need to become more accommodative
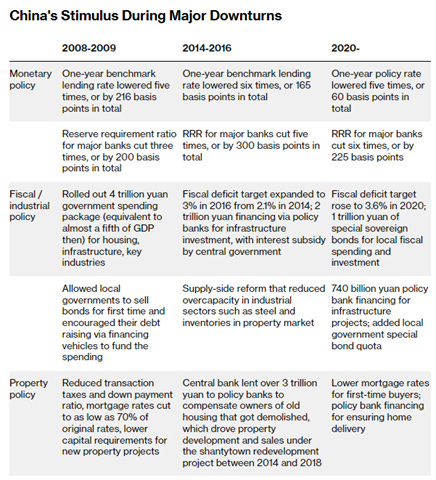
There is one problem, this national security growth priority is not being signaled by Beijing. The PBOC policy rate was only recently cut slightly and, coupled with cuts to reserve requirements, won’t have the multiplier effects due to low loan demand. Fiscal actions are seemingly not supportive enough, with deficit targets and infrastructure projects no longer returning as much in terms of growth. The property sector has only received incremental help as policymakers grapple with balancing the longer-term structural weight of too much debt versus the need to stabilize and grow homeownership levels again. Ultimately, the only real hope for a sustained fiscal-driven growth pulse is to further increase the social welfare net and free up pent-up savings. This, so far, has not been on the agenda. Instead, Premier Li Qiang recently stated China would “launch more practical and effective measures in expanding the potential of domestic demand, activate market vitality, promote coordinated development, accelerate the green transition, and promote high-level opening to the outside world.” Of course, further measures will be supportive, but until a greater social welfare state is built in the name of national security (given the Chinese consumer is a national asset needing protection), China’s consumer will not be able to take over the growth driver mantel sustainably. We should hear more about coming stimulus plans following the CCP Politburo meeting in July, leaving markets wondering what is coming until then.
*Chinese households have a very low level of consumption as a percentage of their overall economy. This is due to a number of structural reasons that the CCP has been slow to address
We want to encourage readers to share our newsletter if they like it. We continue to gain followers and are encouraged by each new reader to keep going and doing more.
Thank you for reading! - Mike Ball
Policy Talk:
Chairman Powell spoke during a Q&A setting at an ECB forum in Sintra, Portugal, while also giving prepared remarks titled “Financial Stability and Economic Developments” at a Banco de Espana Financial Stability Conference in Madrid, Spain, the next day. Powell said in Portugal that further rate hikes were coming, as projected in the June SEPs. He highlighted that policy has not been in restrictive territory for that long and believes “more restriction is coming.” This is due to the strong labor market driving demand and “really pulling the economy.” As a result, the policy may not yet be “restrictive enough for long enough.” But he highlighted that as “you get closer and closer to the goal,” the risks have become more inbalance and warrant a slower pace of tightening. He specifically noted that he would not take consecutive meetings off the table. He highlighted that the stresses to the U.S. banking system in March weighed on his decision-making process at the last meeting, noting that “bank credit availability and credit can move down a bit with a bit of a lag. So we’re watching carefully to see whether that does appear.” Powell said a recession is a significant probability, but is not his central forecast, noting the resilience of the recent economic data.
Powell’s prepared remarks in Spain focused on the stresses that emerged in the U.S. banking system earlier in the year, but he first reiterated a similar view of the U.S. economy that was given at the June FOMC meeting. He highlighted the actions taken by the Fed to arrest the banking stress, which he attributed to the quick pace and degree tighter policy was implemented. He stressed that the new lending facility and existing tools in place would not cause a conflict between financial stability and a more restrictive policy stance. Powell gave three observations specific to the failure of SVB and other banks. First, the Fed was overly focused on credit risks and not excess interest rate risk or liquidity risk due to heavy reliance on uninsured deposits, as was the case with SVB and Signature. The second observation also noted the need for supervision to keep up with the times, as bank runs could now occur in hours, not days and weeks. Finally, Powell noted that at the G-SIBS level, banks were much more resilient due ti higher capital levels, and this allowed for a quicker recovery of the system as a whole from the failure of the SVB and Signature. He concluded his remarks by saying the system was able to weather the recent storm well due to its overall strength and global connectivity, but regulators must continue to learn and adapt to the ever-changing landscape.
“U.S. economic growth slowed significantly last year, and recent indicators suggest that economic activity has continued to expand at a modest pace. Growth in consumer spending has picked up this year, and some indicators in the housing market have turned up recently. At the same time, activity in the housing sector remains far below its peak in early 2022, reflecting the effects of higher mortgage rates. Higher interest rates and slower output growth also appear to be weighing on business fixed investment.”
“Our provision of liquidity through these tools supported the stability of the financial system without restricting the use of our monetary policy tools to firm the stance of policy as part of our efforts to reduce inflation. The banking system remains sound and resilient, deposit flows have stabilized, and strains have eased.”
Atlanta Fed President Bostic gave prepared remarks titled “Inflation Should Continue to Fall as Restrictive Policy Bites” at a dinner of the Irish Association of Investment Managers in Dublin, Ireland. He summarized the recent decision by the Fed not to raise rates and changes made to the SEPs since March, highlighting that he was not with the median committee participants' belief that the FOMC needs to do more to get inflation back to target. He believes, instead, that the economy was only now starting to feel the cumulative effects of tighter policy and saw the last reading of inflation as evidence the Fed was making progress. He highlighted that business contacts in his region noted that although demand generally remained solid, it was beginning to skew to the weaker side in recent months. Bostic also sees labor markets decelerating with a rebalancing occurring after the initial response to the structural change that Covid brought on, saying that business contacts increasingly see labor markets more like the ones before the pandemic. Turning to inflation, Bostic noted that the breadth of price increases had narrowed considerably while supercore readings were growing slower for the last three months. Finally, he identified a decrease in firms planning to increase prices in recent business surveys as a promising sign. He also brought up the now active debate on how much wage increases are driving inflation, saying wage growth was moderating but wage growth would likely exceed inflation for a period as real wage growth normalized to pre-Covid levels. In summary, Bostic made a strong case for why “gradual” disinflation should continue. He believes the Fed has reached an appropriate level of policy tightness that will move inflation back to target in an appropriate timeframe but did not rule out further rate hikes if needed as the “last mile” may be the hardest to beat inflation.
“I believe the economic effects and inflation progress I will describe are a consequence of monetary policy that only fairly recently moved into restrictive territory. And, although I don't want to take a specific position on the appropriate path of US monetary policy going forward, I do want to make a case that we can expect progress on inflation to continue, even absent additional changes in the level of the federal funds rate.”
“contacts describe a labor market more like the one before the pandemic—still tight, but much less so than over the past few years. As one of our contacts said: "Twenty-two to 32-year-olds are no longer in control of the labor market."
“I find glimmers of hope in recent inflation reports. Notably, the distribution of price increases has narrowed considerably, a strong indicator that underlying inflation is in fact abating. Last month marked the first month since August 2021 when less than 40 percent of the expenditure-weighted share of prices in the Consumer Price Index (CPI) basket rose by 5 percent or more.”
FEDS Notes recently highlighted a research paper titled “Distressed Firms and the Large Effects of Monetary Policy Tightenings,” analyzing the effects distressed firms have on the transmission of monetary policy. The paper's results suggest that in the current environment “characterized by a high share of firms in distress,” a restrictive monetary policy stance may contribute to a marked slowdown in investment and employment in the near term, going as far as to predict the effects of the current tightening cycle should be larger today than in past episodes. The conclusion of their research carries two important policy implications. First, the strength of monetary policy transmission depends on the aggregate distribution of firm financial distress. Second, financial distress is important to explain why the response of investment and employment is stronger after tightening shocks than after easing shocks.
“With the share of distressed firms currently standing at around 37 percent, our estimates suggest that the recent policy tightening is likely to have effects on investment, employment, and aggregate activity that are stronger than in most tightening episodes since the late 1970s. The effects in our analysis peak around 1 or 2 years after the shock, suggesting that these effects might be most noticeable in 2023 and 2024.”
The Atlanta Fed’s June Survey of Business Uncertainty, which measures the one-year-ahead expectations and uncertainties that a broad range of firms have about their own employment and sales from every industry sector except agriculture and government across the U.S., found that firms expect lower sales growth and are more uncertain about that growth level. Expected employment growth has also dropped while uncertainty regarding that fell. Firms expect wage growth to slow to 3.6%. Distribution of sales growth over the last year has also widened this year.
*Firms are more uncertain about sales and less uncertain about hiring intentions, with both expected to go lower
The NY Fed’s Liberty St. Blog announced further details about the coming role out of the FedNow 247 Instant Payments service, to be launched in July, through a post titled “FedNow Is Coming in July. What Is It, and What Does It Do?” FedNow is an interbank instant payment infrastructure that adds to the options financial institutions with a Fed account can pay each other reserves. What differentiates FedNow from other payment rails is that it is specifically designed to support instant retail payments, allowing financial institutions to clear and settle retail payments instantly at any time, including nights and weekends. Since FedNow will support instant payment services, banks and credit unions that offer retail payment services will be able to use FedNow to clear and settle retail transactions and instantly make funds available to both merchant and customer. The goal of an instant retail payment system is to allow consumers and businesses to transfer funds at any time, from anywhere, and for these funds to be available to the recipient immediately. FedNow will not replace Fedwire. FedNow is meant to support instant retail payments with a maximum value of $500K, while financial institutions needing to make large, dollar-denominated RTGS transfers will continue to use the Fedwire Funds Service.
U.S. Economic Data:
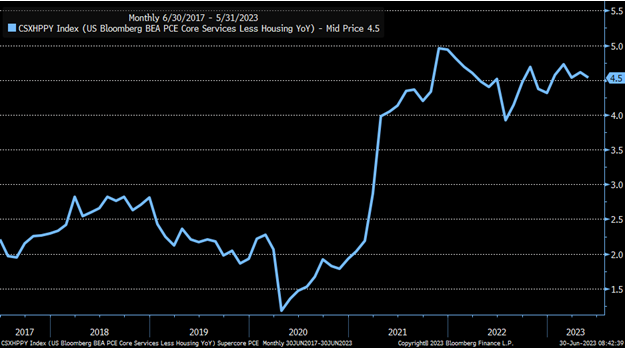
The Headline Personal Consumption Expenditure Price Index rose 0.1% in May, below 0.4% in April. This moved the annual rate to 3.8% from 4.3%, the lowest reading since April 2021. Core PCE prices rose by 0.3% MoM, easing from the 0.4% Mom increase in the previous month and moving the annual rate to 4.6% from 4.7%. Prices for services increased by 0.3% MoM while the cost of goods decreased by -0.1%. Food prices increased by 0.1% MoM while energy dropped by –3.9% MoM. The "super core pce" ex-housing edges down to 4.5%YoY. Elsewhere in the report, consumer spending increased for a fifth straight month but by a weaker 0.1% MoM rate, following a 0.6% MoM increase in April, with spending on goods lower by -0.4% MoM (durables -1.2% MoM) while services rose by 0.2% MoM. Personal savings moved to $910.3 billion, with a savings rate of 4.6% in May. Real disposable personal income rose by 0.3% MoM following a -0.1% decrease last in April.
Why it Matters: PCE price readings were in line with expectations, leading markets to increase the odds of a July rate hike. Annual core PCE readings continue to move sideways, with the annual reading hovering between 4.6% and 4.7% since December, an impressive statistical feat. The Feds preferred focus of prices for labor-intensive services, which is core ex-shelter and goods, rose by 0.2% MoM, cooling from a 0.4% rise in April. When stepping back, the cooling in both headline inflation and core ex-shelter shows real progress is being made despite an uptick in core good prices on a three-month average basis. However, it is still likely the Fed will again raise rates in July, as telegraphed. The market is giving it to them, and they will take it, despite uncertainty over the cumulative effects of policy tightening to date. However, with median and trimmed-mean measures now increasingly showing a broader deflationary pulse underway, there will likely be a healthy debate at the July FOMC meeting on how to start walking back an additional hike this year. As we have stated, given declines in leading inflationary indicators as seen in business surveys, PPI, as well as falling wage pressures due to a loosening labor market and the known lags of shelter price declines being captured in the official data, we see no reason for the Fed to hike further. However, given the original “transitory” policy error has now caused an overcorrection, today’s data does not change our view that errors beget more errors, and that is simply where we are in this part of the policy cycle.
*Declines in energy and flat food prices helped headline inflation drop notably on the month while core readings moved more sideways.
*Core services ex-shelter continues to move sideways on an annual basis, but breadth is weakening with an increasing number of components becoming increasingly more disinflationary
*3-month annualized rates: core goods: +3.2% (vs. 2.1% in Apr), housing: +6.4% (vs. 7.2%), core services ex-housing: +3.9% (vs. 4.4%%)
*Real disposable income rose again on the month while real consumption expenditures were flat
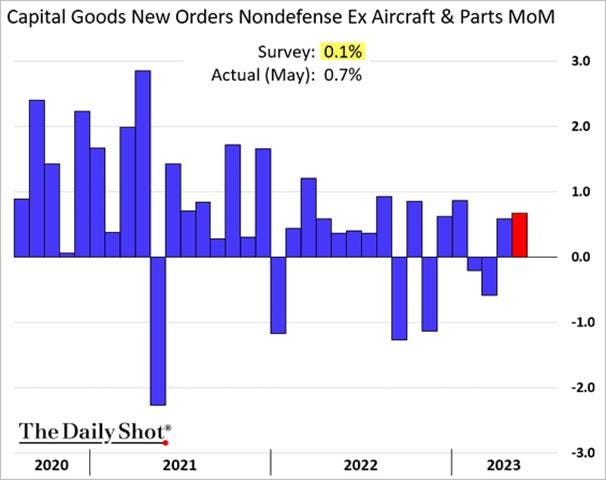
New orders for durable goods rose by 1.7% in May, following an upwardly revised 1.2% rise in April and beating market expectations of a -1% decline. The gains were again driven by transportation equipment, which increased by 3.9% MoM due to rises in non-defense aircraft and parts (32.5% MoM) and motor vehicles (2.2% MoM). Excluding transportation, new orders increased by 0.6% MoM, helped by increases for capital goods (2.8% MoM), namely non-defense ones (6.7% MoM). However, there were broad gains elsewhere, as seen in increases in orders for machinery (1% MoM), electrical equipment (1.7% MoM), and to a lesser extent, computers and electronic products (0.3% MoM). On the other hand, orders declined for defense aircraft and parts (-35.4% MoM) and defense capital goods (-14.7% MoM). Meanwhile, orders for non-defense capital goods, excluding aircraft, a proxy for business spending plans, increased 0.7% MoM after a downwardly revised 0.6% rise in April. Total shipments rose 1.7% in May, with non-defense capital goods, excluding aircraft shipments, higher by 0.2% MoM. Finally, unfilled orders rose by 0.8% MoM, the same as the prior month, while total inventories increased by 0.2% MoM after a 1% increase in April.
Why it Matters: Core capital goods orders rose on the month, but April's 1.3% increase was revised lower to 0.6%, averaging to a more inline-level for Q2 so far. Core capital goods shipments rose but are lower in real terms and suggest a slight decline in investment spending on equipment in the second quarter. As a result, Q2 GDP should see a flip in the contributions of two of its investment components, with residential investment being a positive for the first time in a while and business equipment being a drag on nonresidential fixed investment.
*Expectations were a much lower headline print, but for a third month in a row, transportation had an outsized positive contribution, although ex-transports and core capital goods all rose too
*Core capital goods rose for a second month, although April was revised lower, but is negative when taking into account wholesale price increases for capital goods
*Core capital goods orders continue to trend lower in real terms, coinciding with reduced Capex intentions as seen in regional manufacturing business surveys
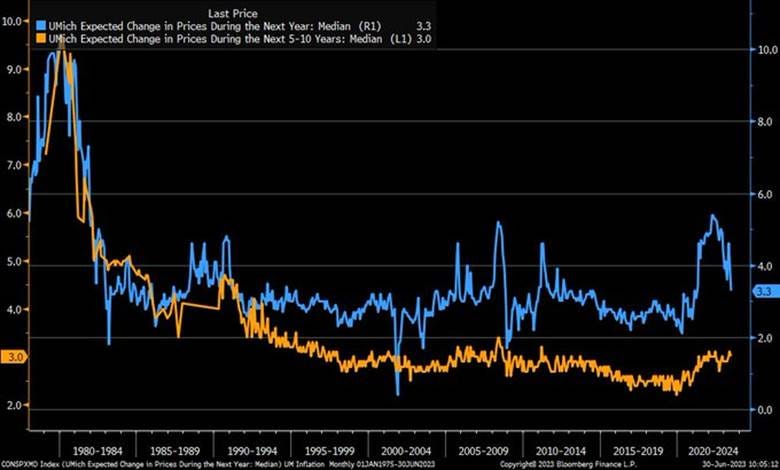
The University of Michigan consumer sentiment was revised higher to 64.4 in June, the highest in four months, from a preliminary of 63.9. Improvements were seen in both current economic conditions (69 vs. 68) and consumer expectations (61.5 vs. 61.3). As a reminder, year-ahead inflation expectations fell for a second consecutive month, falling to 3.3% in June from 4.2% in May. The current reading is the lowest since March 2021. Long-run inflation expectations were little changed from May at 3.0%, again staying within the narrow 2.9 - 3.1% range for 22 of the last 23 months and still above the 2.2-2.6% range seen in the two years pre-pandemic.
Why it Matters: With the debt ceiling drama over, gasoline prices more stable, and inflation continuing to fall, especially for food, the U.S. consumer is feeling better about the world despite the continued worry of an always quarter-away recession. "Overall, this striking upswing reflects a recovery in attitudes generated by the early-month resolution of the debt ceiling crisis, along with more positive feelings over softening inflation. Views of their own personal financial situation were unchanged, however, as persistent high prices and expenses continued to weigh on consumers", Surveys of Consumers Director Joanne Hsu said. The year-ahead economic outlook soared 28% over last month, and long-run expectations rose 11% as well.
*Consumer sentiment was revised higher due to improvements in both current and future assessments
*With the price at the pump falling and things like egg prices down, one-year ahead consumer inflation expectations look to be breaking lower after a brief bounce back up last month
*Inflation uncertainty is trending lower after reaching levels not seen since the late 70s-early 80s
The Conference Board’s Consumer Confidence Index increased in June to 109.7, up from 102.5 in May. The Present Situation Index rose to 155.3 from 148.9 last month. The Expectations Index rose to 79.3 from 71.5 in May. Consumers’ assessment of current business conditions and labor markets was more positive in June. Consumers were marginally more optimistic about their future short-term business conditions outlook, while future labor market views were more optimistic. However, six-month ahead income prospects worsened. Future plans to purchase autos and homes fell further after picking up earlier in 2023. Vacation plans within the next six months also weakened, led largely by declines in plans to travel domestically. The 12-month forward inflation expectations gauge fell to 6 percent in June.
Why it Matters: “Consumer confidence improved in June to its highest level since January 2022, reflecting improved current conditions and a pop in expectations,” said Dana Peterson, Chief Economist at The Conference Board. “Greater confidence was most evident among consumers under age 35, and consumers earning incomes over $35,000. Nonetheless, the expectations gauge continued to signal consumers anticipating a recession at some point over the next 6 to 12 months.” With the Expectations Index approaching 80 (a level below indicates a recession is probable) for the first time in over a year other than for a short period last winter, June’s reading supports the soft landing narrative that has recently gained traction due to stronger data. But as noted by Peterson, despite improved current and future assessments of business and employment conditions, consumers are still expecting a “recession,” technically speaking. Decreases in plans to purchase big ticket items or go on vacation confirm this as the consumer looks to be increasingly buttoning down the hatches (after a year and a half reopening splurge) despite having growing confidence about future wealth levels, as seen in the new Family’s Current Financial Situation reading. “While income expectations ticked down slightly in June, new questions included in this month’s release found a notably brighter outlook for consumers’ family finances: Around 30 percent expect their family’s financial situation to be ‘better’ in the next six months, compared to less than 14 percent expecting it to be ‘worse.’ This might reflect consumers’ belief that labor market conditions will remain favorable and that there will be further declines in inflation ahead. Indeed, the 12-month forward inflation expectations gauge fell to 6 percent in June, the lowest reading since December 2020,” Peterson noted.
*The headline index rose due to improvements in everything but future income outlook, while job confidence increased again, as seen in labor differential reading
Pending home sales fell -2.7% in May, to the lowest level this year, and worse than market forecasts of a -0.5% drop. This moved the annual rate to -22.2%, following a -20.6% fall in April and marking two years of negative annual declines. Sales were lower in the Midwest (-5.3%), South (-4.4%), and West (-6.6%) but rose in the Northeast (12.9%).
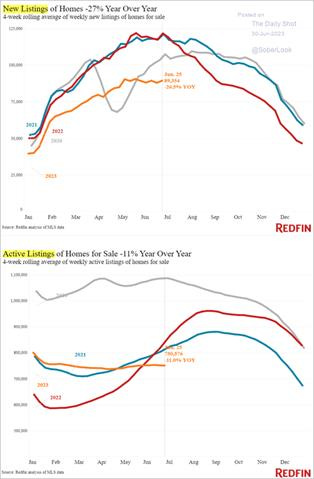
Why it Matters: Limited supply and high-interest rates continue to negatively impact current sales levels. “The lack of housing inventory continues to prevent housing demand from being fully realized,” said NAR Chief Economist Lawrence Yun. Still, “Despite sluggish pending contract signings, the housing market is resilient with approximately three offers for each listing." “It is encouraging that homebuilders have ramped up production, but the supply from new construction takes time and remains insufficient,” added Yun.
*Pending home sales came in lower than expected and continue to below normal levels as low levels of inventory and higher rates hurt activity
*Both active and new listings remain low, indicating sales will be hurt by low inventory levels for some time
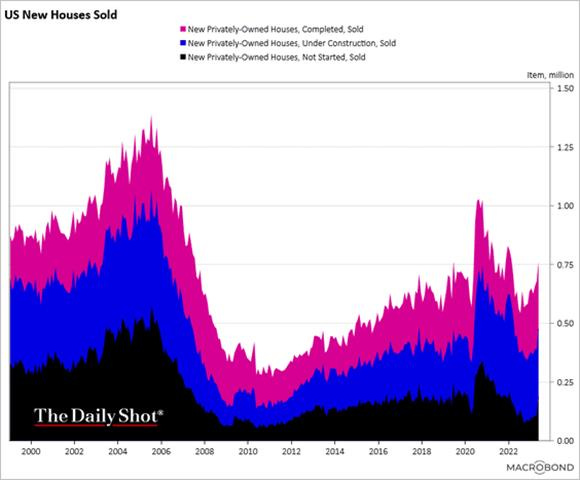
New Home Sales rose by 12.2% to a seasonally adjusted annualized rate of 763K in May, the largest increase since last August, and compared to forecasts of 675K. Sales increased 17.6% to 40K in the Northeast, 17.4% to 175K in the West, 11.3% to 471K in the South, and 4.1% to 77K in the Midwest. The median price of new houses sold was $416.3K, while the average sales price was $487.3K, compared to $450.7K and $521.5K, respectively, a year ago. There were 428K houses left to sell, corresponding to 6.7 months of supply at the current sales rate.
Why it Matters: A pickup in the South and West helped new home sales come in stronger than expected, despite the Northeast having the strongest percentage gains, moving the total number of new home sales in May above pre-pandemic levels. The median sales prices ticked higher after falling last month but continue to trend lower after peaking last summer. The months of supply decreased in May to 6.7 months from 7.6 months in April but remains above the top of the normal range (about 4 to 6 months of supply is normal). Bottomline, there are still a large number of homes under construction, but in general, this is another positive report for new home sales.
*Sales came in stronger than expected in May bit were revised lower fro prior three months
*Increased supply of lower-priced homes should help first-time home buyers come back in despite higher mortgage rates
*The pipeline of new homes is on the rise again
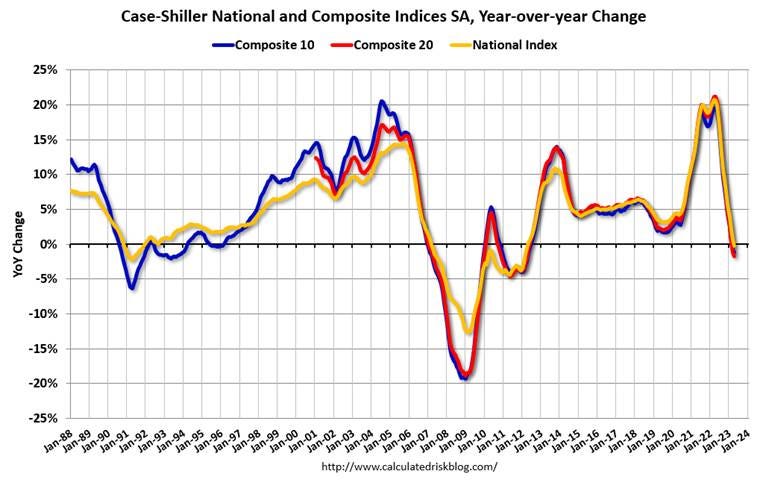
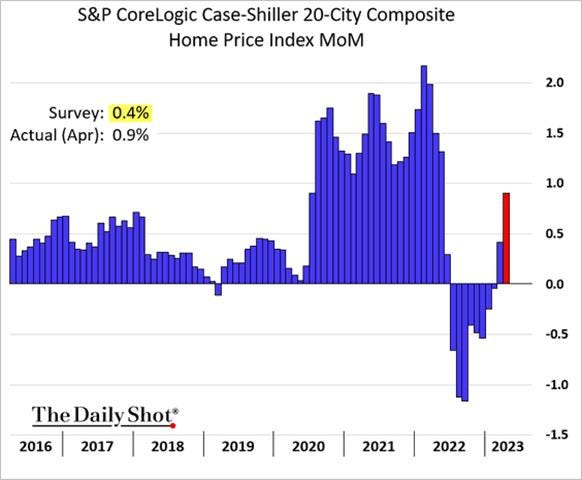
The S&P CoreLogic Case-Shiller 20-city home price index increased by 1.7% in April, marking a third consecutive month of rising prices. However, due to unfavorable comparables, the annual rate fell to -1.7% YoY, the most significant decline since April 2012, and compared to forecasts of a -2.6% YoY drop. The National NSA HPI is now lower by -0.2% YoY. In keeping with ongoing trends, Seattle (-12.4%) and San Francisco (-11.1%) booked the biggest annual decreases, while Miami (5.2%), Chicago (4.1%), Atlanta (3.5%), and Charlotte (3.4%) all reported gains. The Southeast (3.6%) remains the strongest region, while the West (-6.9%) remains the weakest.
Why it Matters: The ongoing home price recovery started at the beginning of this year is broadly based. Before seasonal adjustments, prices rose in all 20 cities in April, as they had also done in March. Seasonally adjusted data showed rising prices in 19 cities in April. “If I were trying to make a case that the decline in home prices that began in June 2022 had definitively ended in January 2023, April’s data would bolster my argument. Whether we see further support for that view in coming months will depend on how well the market navigates the challenges posed by current mortgage rates and the continuing possibility of economic weakness”, says Craig J. Lazzara, Managing Director at S&P DJI. We would also add an increased level of supply will likely dampen price increases moving forward as what was a historically high level of permits and starts over the last year are increasingly resulting in completed projects.
*Annual prices continue to fall despite recent monthly increases, and this will likely continue for another two months as monthly price decreases didn’t start until July ‘22
*A lack of supply continues to keep prices supported as buyers have adjusted to worsening affordability
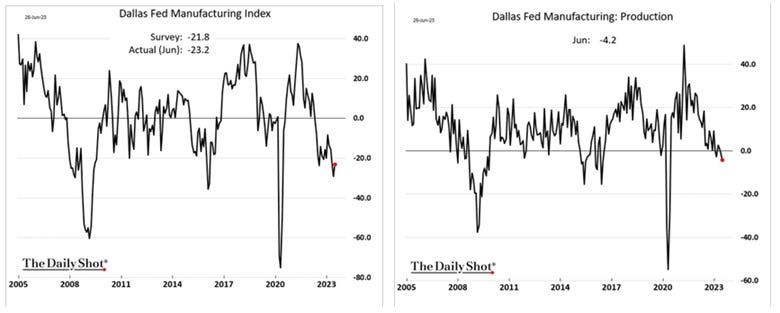
The Dallas Fed’s Texas Manufacturing Index rose to -23.2 in June from -29.1 in May, the highest level in three months and better than forecasts of -26.5. Demand and activity measures broadly weakened with New Orders (-16.6 vs. -16.1) and Growth Rate of Orders (-23.7 vs. -20.7) moving further into contractionary territory, while Production (-4.2 vs. -1.3) and Capacity Utilization (-6 vs. -4.9) moved negatively away from neutral. Unfilled Orders (-8.5 vs. –15.5) did improve but remained well in contractionary territory. There was a notable drop in Shipments (-17 vs. -3), although Delivery Times (-4.3 vs. -7.3) shortened at a slower pace. Views regarding Inventory (-4.7 vs. 1.1) levels moved into negative territory. Inflationary readings fell, with Prices Paid (1.4 vs. 13.8) falling notably, while Prices Received (-1.9 vs. 0.4) are now contracting slightly. Labor readings also weakened with employment (2.2 vs. 9.6) and Hours Worked (-4.3 vs. 0.9) falling while Wages and Benefits (25.3 vs. 25) was little changed, although remaining highly expansionary. Capital Expenditures (0.3 vs. -3.7) moved back to a neutral reading, while overall Company Outlook (-10.7 vs. -22.3) improved, but Outlook Uncertainty (16.7 vs. 13.4) also rose. Expectations regarding future manufacturing activity were notably more positive, with demand and activity measures jumping higher, labor market readings rising, and inflationary pressure expectations little changed.
Why it Matters: Despite the headline improvement in general business activity due to an improved outlook, there was a broad weakening in most of the current subindexes. This was countered by notable increases in six-month ahead readings, which showed a much more optimistic picture regarding demand and activity. Comments from respondents varied by industry but conveyed continued uncertainty. One chemical manufacturer indicated an expected slower period of activity/demand was coming but a desire to keep “good” workers on staff due to an expected uptick in 2024. Supply constraints continued to improve for some industries while finding qualified labor issues persisted, supporting the stickiness in the current wage reading. Metals, machinery, chemical, and paper manufacturing had more negative comments, verse textile and printing being more positive. Still, a more cautious and negative tone was conveyed in the selected comments.
*The General Business Activity index for Texas manufacturers ticked slightly higher despite declines in activity and demand readings as outlook improved
*Current price readings fell notably on the month, while future expected moves were more stable
*Despite the headline increase, current subindex readings broadly contracted while six-month ahead readings improved
The Richmond Fed Manufacturing Index rose to -7 in June from -15 in May. Demand and activity readings remained in contractionary territory but broadly improved. Shipments (-5 vs. -13) and Capacity Utilization (-2 vs. -15) moved closer to neutral readings, while New Orders (-15 vs. -29) and Backlog of Orders (-25 vs. -32) remained further in contractionary territory but did improve. Local Business Conditions (-8 vs. -27) notably improved on the month while Vendor Lead Times (-17 vs. -15) shortened further. Inventory levels increased at a faster rate than in May. Employment readings were more mixed, with the hiring intentions as seen in the Number of Employees (2 vs. 5) cooling, Wages (17) expanding at the same rate, and the Availability of Skills Needed (-4 vs. -7) moving closer to neutral. Inflationary pressures fell further, with Prices Received (3.84 vs. 5.39) falling more than Prices Paid (4.19 vs. 4.95). Current readings on investment activity increased, with Capex (6 vs. -12) and Equipment & Software Spending (8 vs. 1) moving well into expansionary territory while Service Expenditures (-3 vs. -5) contracted by less. Expectation readings were also broadly positive outside labor market readings, which weakened but showed continued hiring and increased compensation intentions. Future demand and activity readings all moved notably higher. Future investment intention readings were more mixed as Capex rose while IT and service spending fell. Finally, future price readings were mixed with expectations for prices paid falling while prices received rose slightly.
Why it Matters: Despite the headline number remaining negative/contractionary, there was a broad improvement in both current and future expectation readings going on in the fifth district this month. Further, reduced inflationary pressures, more stable hiring activity, and at least stable wage pressures showed that firms saw greater activity/demand without the accompanying cost pressures that occurred in the past due to capacity constraints being diminished. With three-month averages for both price readings and wages continuing to fall fast, this report supports our belief that the uptick of inflationary pressures seen earlier in the year is now over, and the trend seen in falling producer prices will increasingly flow through to consumers as firms have reduced pressures to raise prices to defend margins while also experiencing reduced costs of doing business.
*Less bad would be the theme of June’s report, as demand and activity contracted by less than in May
*Inflationary pressures continue to subside in the majority of regional Fed surveys after an uptick in Q1
*Expectation readings were notably more upbeat than current readings, with firms seeing demand and investment increasing
The Dallas Fed general business activity index for Texas' service sector rose to -8.2 in June from -17.3 in the previous month. Company Outlook (-1.4 vs. -9.6) jumped higher and is now near a neutral reading. Gains at the sub-index level were broad; however, Revenue (3.6 vs. 6.9) decreased but remained expansionary. Full Time (9.2 vs. 4.2) and Part-Time Employment both increased, but Hours Worked (-0.9 vs. -1.4) remained contractionary, although closer to neutral. On the inflationary front, Input Prices (35 vs. 31.8) rose while Selling Prices (12.8 vs. 13.8) fell, neither moving much, though. Wages and Benefits (18.6 vs. 16.6) also rose. Finally, regarding current readings, Capex (13.4 vs. 11.5) spending continued to expand. Six months ahead, headline readings also improved, with the Future General Business Activity (-1.6 vs. -13.2) and Company Outlook (7 vs. -1.3) all rising by solid amounts. However, other future sub-index readings were more mixed, with revenue, and capex expectations rising, while labor measures outside of wages softened. Input prices were also expected to rise.
Why it Matters: Current readings for the service sector in the Texas region took a nice turn higher in June, while future readings indicated lower hiring intention and persistent cost pressures. Respondent comments, as always from the Texas area, were interesting and diverse, as seen in the manufacturing survey. There certainly was an acknowledgment that tighter Fed policy was weighing on activity. Still, several respondents noted no signs of weakness. We did see firms from the accommodation sector noting a slowdown, which supports data seen elsewhere for the last two months, while one nonstore retailer noted, “People are holding back when shopping. If it is not a “need,” they are holding off on purchasing at this time.” Generally, business seems flat, inventories better, labor shortages of skilled workers persistent, and overall inflation less problematic but still a headwind.
*Despite general business activity turning higher, revenue growth moved closer to neutral in June
*Current sub-index readings generally rose, with hiring activity increasing and wages and input prices rising
Technicals, Positioning, and Charts:
The Nasdaq is outperforming the S&P and Russell, with Growth and Momentum factors, as well as Technology, Consumer Discretionary, and Utilities sectors all outperforming on the day. Leadership at the sectorial level on the week was more mixed, with Real Estate doing the best, but cyclical-orientated areas like Energy, Materials, and Industrials also performing well. Small-caps were the clear outperforming factor on the week regarding size, while Value beat Growth despite today's rally in Tech.
@KoyfinCharts
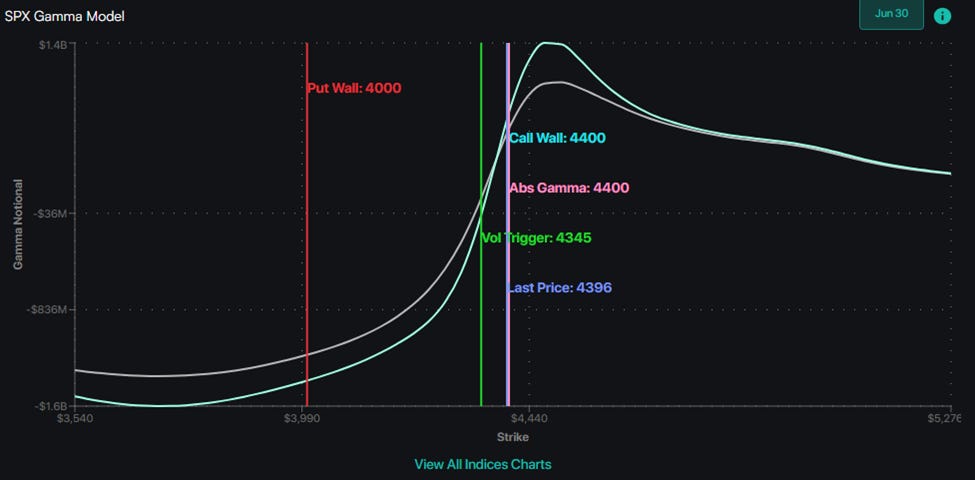
S&P optionality strike levels have the Zero-Gamma Level at 4338 while the Call Wall is 4400 and Put Wall is 4000.
@spotgamma
S&P technical levels have support at 4465, then 4445, with resistance at 4500, then 4527.
@AdamMancini4
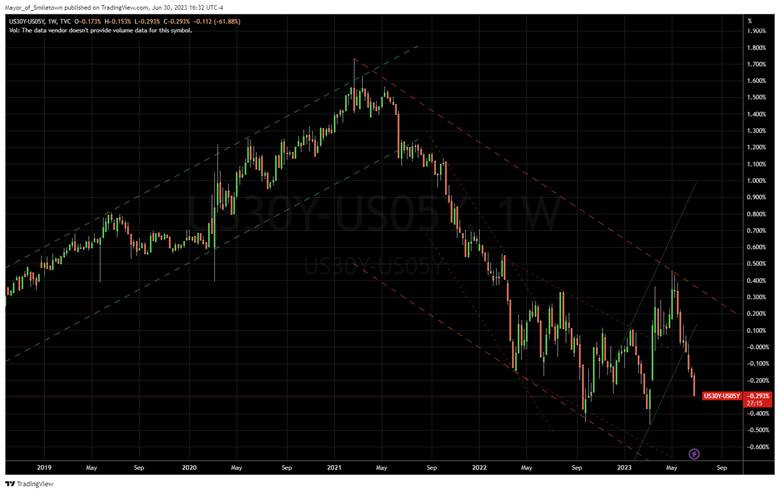
Treasuries are higher, with the 10yr yield little changed at 3.84%, while the 5s30s curve is flatter by 6 bps on the session, moving to -29 bps.
Four Key Macro House Charts:
Growth/Value Ratio: Value is little changed on the day but higher on the week, with Mid-Cap Value the best-performing size/factor on the week.
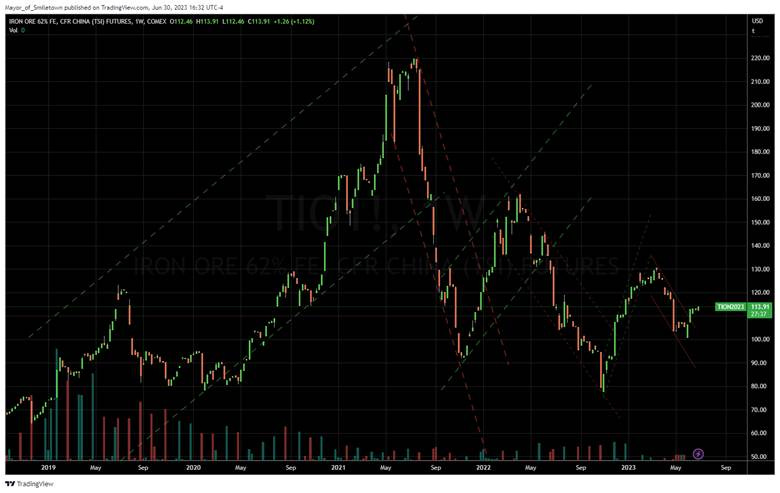
Chinese Iron Ore Future Price: Iron Ore futures are higher on the day and the week.
5yr-30yr Treasury Spread: The curve is flatter on the day and the week.
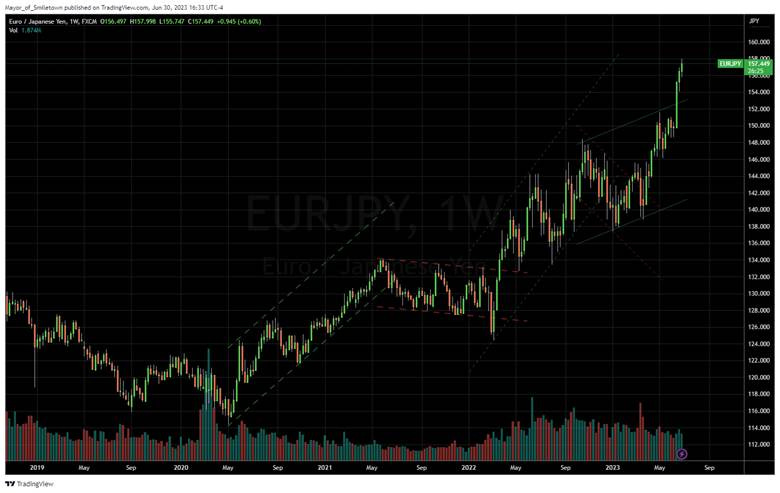
EUR/JPY FX Cross: The Euro was stronger on the day and on the week.
Other Charts:
The Bull/Bear ratio turned notably higher in June as retail investors increased their cash positioning with indexes near pre-rate hiking levels despite yields also rising.
"While the top quartile is indeed expensive, trading at 33x forward earnings, the second quartile is expensive too, trading at 21x. The bottom quartiles are outright cheap, trading at 14x and 9x, which is consistent with history." - @bcaresearch
However, bank stocks look cheap, well off their forward earnings trend due to increased fears following the failures of SVB and others in March.
"Market breadth last month went up a little, but the magnitude was negligible, with the share of stocks outperforming the index globally remaining at depressed levels." - Barclays
More call options tied to the VIX have changed hands on an average day in June than in any other month on record, according to Cboe Global Markets data. “There’s massive, really relentless call overwriting in the market right now—maybe the most extreme I’ve seen in my career,” said Alex Kosoglyadov, managing director of global equity derivatives at Nomura.
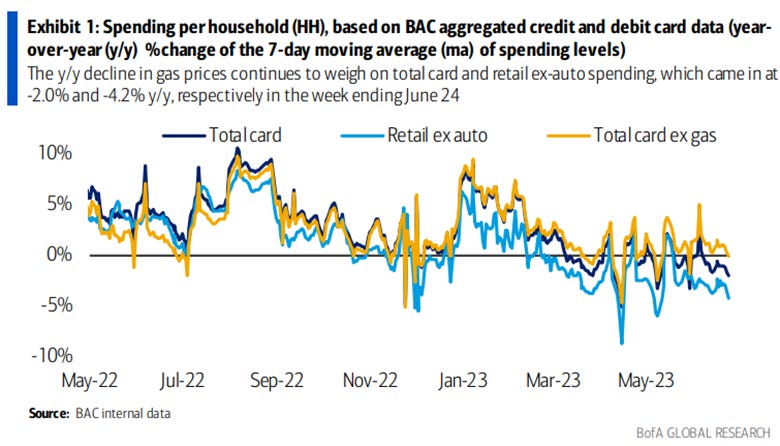
Total card spending ex-gas fell to -0.1% y/y in the week ending Jun 24, while retail spending ex-auto was even lower at -4.2%, according to BofA Research. After a spike in early June, the spending trends look weaker.
“Tighter credit conditions typically precede labor market weakness.” - @soberlook
The initial response to the pandemic makes the current fiscal programs look small, especially when looking at the FSA offsets.
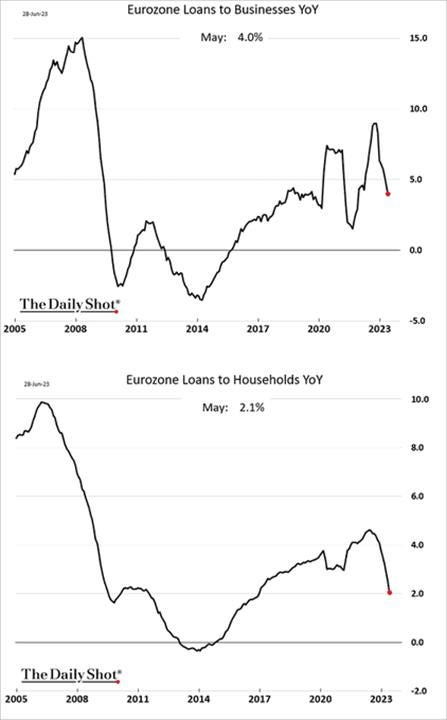
Given how much more loans matter in the Eurozone, verse the U.S. where public/private markets provide more capital, this downturn is a notable headwind developing to future growth as tighter credit conditions will bite more in the EZ
Articles by Macro Themes:
Medium-term Themes:
China’s Post-Pandemic Life:
More Coming?: China will likely disappoint those hoping the government will roll out massive stimulus to shore up the weakening economic recovery, said Zhu Min, a former deputy managing director of the International Monetary Fund. The central bank cut policy interest rates this month for the first time since last August, fueling speculation about further support. But officials have been slow to announce any concrete stimulus package. Zhu joins a growing chorus of experts who project the world’s second-largest economy will announce only moderate stimulus this year as the rebound loses steam. “Resource constraints” in China may make big stimulus infeasible, said Keyu Jin, an economics professor at the London School of Economics and Political Science. “There’s enough room for stimulus, but the problem is that you need a massive stimulus in the trillions of RMB or more to have a moderate impact on today’s Chinese economy, because the return on the stimulus is much lower,” she said. - Big China Stimulus Isn’t Coming, Former IMF Official Says - Bloomberg
Longer-term Themes:
Cyber Life and Digital Rights:
OverWatch at Work: Over the past decade, a few dozen companies have emerged to sell your employer subscriptions for services like “open source intelligence,” “reputation management,” and “insider threat assessment,” tools often originally developed by defense contractors for intelligence uses. With them, your boss may be able to use advanced data analytics to identify labor organizing, internal leakers, and the company’s critics. For example, network analysis tools developed to identify terrorist cells can thus be used to identify key labor organizers so employers can illegally fire them before a union is formed. The standard use of these tools during recruitment may prompt employers to avoid hiring such organizers in the first place. And quantitative risk assessment strategies can now inform investment decisions, like whether to divest from areas and suppliers who are estimated to have a high capacity for labor organizing. - Military AI’s Next Frontier: Your Work Computer - Wired
A.I. All Day:
Evolution of the Internet: The web is always dying, killed by apps that divert traffic from websites or algorithms that reward supposedly shortening attention spans. But in 2023, it’s dying again, and, as the litany above suggests, there’s a new catalyst at play: AI. Given money and computing power, AI systems, particularly the generative models currently in vogue, scale effortlessly. They produce text and images in abundance, and soon, music and video, too. Their output can potentially overrun or outcompete the platforms we rely on for news, information, and entertainment. But the quality of these systems is often poor, and they’re built in a way that is parasitical on the web today. These models are trained on strata of data laid down during the last web age, which they recreate imperfectly. Companies scrape information from the open web and refine it into machine-generated content that’s cheap to generate but less reliable. This product then competes for attention with the platforms and people that came before them. Sites and users are reckoning with these changes, trying to decide how to adapt and if they even can. - AI is killing the old web, and the new web struggles to be born – The Verge
Too Fake: What began a few months ago as a slow drip of fund-raising emails and promotional images composed by A.I. for political campaigns has turned into a steady stream of campaign materials created by the technology, rewriting the political playbook for democratic elections around the world. Increasingly, political consultants, election researchers and lawmakers say setting up new guardrails, such as legislation reining in synthetically generated ads, should be an urgent priority. Existing defenses, such as social media rules and services that claim to detect A.I. content, have failed to do much to slow the tide. In May, the chief executive of OpenAI, Sam Altman, whose company helped kick off an artificial intelligence boom last year with its popular ChatGPT chatbot, told a Senate subcommittee that he was nervous about election season. - A.I.’s Use in Elections Sets Off a Scramble for Guardrails – NYT
Energy’s Midlife Crisis:
Cheaper Wins the Day: Russia is on the cusp of overtaking Saudi Arabia as the biggest oil supplier to China, thanks to Russia selling its oil at steep discounts. Shipments from Russia now account for 14% of Chinese supplies, up from 8.8% before the war. Saudi Arabia’s share fell to 14.5% in the three months to May. The reversal has been even more dramatic in India, where Riyadh holds 13% of the market, compared with 20% before the war. Moscow now accounts for about 40% of India’s imports, up from 3% before the war. Meanwhile, China is increasingly hoarding cheap Russian oil, insurance in case the economy kicks into gear and prices tick higher. Beijing added about 1.77 million barrels a day to its inventories in May, the most since July 2020, according to oil data analytics firm Refinitiv Eikon. - Russia Set to Overtake Saudi Arabia in Battle for China’s Oil Market – WSJ
Authoritarianism in Trouble?:
There are Always Limits: Ever since Russia invaded Ukraine last year, Xi Jinping’s gamble on a “no limits” friendship with Vladimir Putin has looked like it could backfire. This weekend’s brief uprising against Moscow again underscored the risks facing the Chinese leader. Still, China continued to give a vote of confidence in Putin following recent events. Asked directly about Putin’s deal with Wagner chief Yevgeny Prigozhin, China’s Foreign Ministry said it supports Russia’s bid to maintain “national stability” in dealing with an “internal affair.” However, analysts question China’s commitment to Russia. “This chaotic sort of conclusion can only be seen as a loss for Beijing,” said Raffaello Pantucci, a senior fellow at the S. Rajaratnam School of International Studies in Singapore. “It highlights the fragility of its most important partner on the world stage, and it highlights the weakness of a man President Xi had sought to show himself close to, and if it leads to the end of the war, then it will free up some Western assets to refocus on China.” - Xi’s Bet on Putin Looks Even More Risky After Russian Mutiny - Bloomberg
Optics verse Reality: After more than a decade in which, as the journalist Anne Applebaum observed, “the bad guys” were winning, the world now seems to be turning against autocracy. Three of the biggest bad guys in China, Russia, and Iran appear to face unprecedented challenges to their power, giving democracy the edge in the global contest with autocracy for the first time in years. But the threats to autocratic power are less significant than many hope. Further, these three dictatorships, in particular, have hidden sources of resilience, rooted deep in their revolutionary pasts. Revolutionary origins, and in the case of Russia, the surviving legacies of the Bolshevik Revolution of 1917, have helped all three governments survive economic downturns, policy disasters, and sharp drops in popularity and will likely continue to strengthen them for a long time to come. The article goes on to elaborate on how Xi, Putin, and Ayatollah are not in any danger of being replaced by a democratic uprising. - Don’t Count the Dictators Out – Foreign Affairs
Other Articles of Interest:
Cheaper Options: Private-label goods that got knocked back during the pandemic are regaining traction in supply chains. Companies that make private-label products for multiple retailers are building back operations and are recovering lost market share. The recovery at suppliers signals that consumer-driven supply chains are starting to look more normal after the upheaval during the pandemic. Private-label suppliers were jolted during the pandemic as their complicated manufacturing processes and supply chains couldn’t adapt as quickly as brands that make products at a greater scale for a national market. TreeHouse Foods, a private-label brand firm, says it is now able to fill 98% of customer demand, up from 92% a year ago. Figures show the private-label share is growing again after two years of decline. That suggests greater competition for brand suppliers like Kraft Heinz and Procter & Gamble, and potentially a tougher path to keep raising prices. - Store Brands Strike Back – WSJ
King Some More: The dollar will maintain its position as the world’s dominant reserve currency over the next decade, confounding growing calls from some countries for the adoption of alternatives, according to a closely watched annual survey of central banks. Research by the Official Monetary and Financial Institutions Forum (OMFIF), a UK central banking think-tank, found that reserve banks managing close to a combined $5tn of assets expect the dollar to continue to decline as a proportion of global reserves at a “gradual” pace. However, it will still account for 54% of the total in 10 years, compared with 58% currently, the survey found. China, the world’s largest reserve asset holder, has been pushing for greater adoption of its currency by other countries. But sanctions on Russia had brought the issue of geopolitics into “sharper focus,” and some reserve managers “will be looking at US tensions with China and be reluctant to invest in China right now.”- US dollar to maintain dominance over next decade, say central banks – FT
Podcasts and Videos:
VIEWS EXPRESSED IN "CONTENT" ON THIS WEBSITE OR POSTED IN SOCIAL MEDIA AND OTHER PLATFORMS (COLLECTIVELY, "CONTENT DISTRIBUTION OUTLETS") ARE MY OWN. THE POSTS ARE NOT DIRECTED TO ANY INVESTORS OR POTENTIAL INVESTORS, AND DO NOT CONSTITUTE AN OFFER TO SELL -- OR A SOLICITATION OF AN OFFER TO BUY -- ANY SECURITIES, AND MAY NOT BE USED OR RELIED UPON IN EVALUATING THE MERITS OF ANY INVESTMENT.
THE CONTENT SHOULD NOT BE CONSTRUED AS OR RELIED UPON IN ANY MANNER AS INVESTMENT, LEGAL, TAX, OR OTHER ADVICE. YOU SHOULD CONSULT YOUR OWN ADVISERS AS TO LEGAL, BUSINESS, TAX, AND OTHER RELATED MATTERS CONCERNING ANY INVESTMENT. ANY PROJECTIONS, ESTIMATES, FORECASTS, TARGETS, PROSPECTS AND/OR OPINIONS EXPRESSED IN THESE MATERIALS ARE SUBJECT TO CHANGE WITHOUT NOTICE AND MAY DIFFER OR BE CONTRARY TO OPINIONS EXPRESSED BY OTHERS. ANY CHARTS PROVIDED HERE ARE FOR INFORMATIONAL PURPOSES ONLY, AND SHOULD NOT BE RELIED UPON WHEN MAKING ANY INVESTMENT DECISION. CERTAIN INFORMATION CONTAINED IN HERE HAS BEEN OBTAINED FROM THIRD-PARTY SOURCES. WHILE TAKEN FROM SOURCES BELIEVED TO BE RELIABLE, I HAVE NOT INDEPENDENTLY VERIFIED SUCH INFORMATION AND MAKES NO REPRESENTATIONS ABOUT THE ENDURING ACCURACY OF THE INFORMATION


