


Weaker Hard and Soft Data Bringing into Question Consumer Resilience in Q2
Color on Markets, Economy, Policy, and Geopolitics

Weaker Hard and Soft Data Bringing into Question Consumer Resilience in Q2
Midday Macro – 5/20/2024
Market’s Weekly Narrative:
Equities are higher on the day and ended last week with gains (the fourth green week in a row), moving the S&P to new ATHs. Gains were broad across most sectors, but technology, real estate, and healthcare outperformed, as did momentum and growth regarding factors. With 93% of S&P 500 companies reporting, 78% of companies have reported positive EPS surprises, and 60% have reported positive revenue surprises. Last week’s inflation data was, on aggregate, slightly weaker than expected, with CPI being the focus and coming in touch softer (and not broadening). At the same time, PPI and import prices firmed, although they looked less worrying underneath headline gains. Retail sales were flat in April, with the core control group slightly higher, while industrial production was also flat. Housing starts missed expectations, and the NAHB Builder Survey dropped notably as higher mortgage rates continued to bite on demand while inventory levels grew. The NFIB Small-Business Optimism survey ticked higher thanks to higher expected future sales. Treasuries have given back all their post-CPI and weaker retail sales gains, with the 10yr yield approaching close to 4.3% at one point but now back around 4.45%, while the curve was little changed. Fed speakers were again numerous, and we do our best to cover them individually in the appendix. The message remained the same, with confidence still too weak to commit to any rate cuts despite recent hard data turning more negative.

Oil prices recovered last week after the EIA reported an inventory decline of 2.5 million barrels, while gas and distillate inventories moved slightly lower ahead of the start of the summer driving season. However, overall, physical crude oil markets have weakened as demand is underperforming expectations amid sufficient supply, according to analysts and traders. The recent copper rally has propelled prices close to an all-time high, with an increasing chorus of analysts getting bullish. Trafigura has predicted that the electric vehicle, AI, power infrastructure, and automation boom will drive at least 10 million metric tons of additional copper demand by 2035. (Non-oil) Commodities, more generally, have been trending higher in recent weeks, with the DB commodity index back at YTD highs, helped not only by copper but also the likes of natural gas, silver, gold, and others. The agg complex was more mixed with beans and wheat higher, while corn has been trending lower over the last week or so. Some of the softs that had recently gone exponentially higher have also cooled, with cocoa and sugar falling on the week. Finally the dollar continues to trend lower, driven by weaker data reducing Fed “higher for longer” expectations. The $DXY is around 104.5 today, with the Euro, Aussie, and Peso higher over the last few trading sessions, while the Yen has retraced recent gains back to above 156.

Headlines:

Deeper Dive:
Overall views from our last note remain the same, with last week’s economic data supporting our belief that disinflation progress will continue, labor markets will loosen, and growth will slow to a below-trend rate in the second half of this year. Although momentum is cooling, the economy is decelerating from a strong place, and we are not worried about an impending recession. However, in a binary world of up/down, bull/bear, and dovish /hawkish, we are entering the part of the cycle where current and future economic activity measures will increasingly converge in a more nuanced way. For example, as we have highlighted in prior writings, hiring intentions have been declining for months with no apparent effect on payrolls or initial claims. However, given the miss in the recent jobs report and the continual creep higher every week in continuous claims, it is becoming clear firms are no longer actively expanding headcount. Add April’s NFIB survey showing small businesses are no longer having as hard a time finding workers, which echoes what has been seen in other business surveys and anecdotal comments on earnings calls, and the lag between weakening leading labor market indicators and actual hard employment data looks to be closing. As a result, for the first time in a long while, markets now see hard activity data sending a weak message along with the softer survey data.

*Overall, the U.S. household’s balance sheet remains in good shape

*Market participants are not expecting a recession or a rebound in inflation
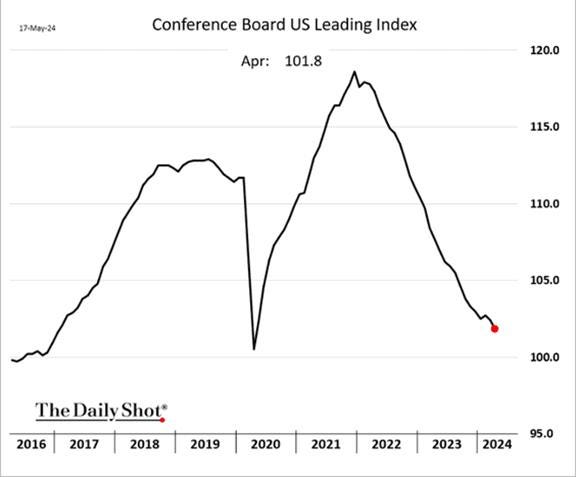
*The Conference Board Leading Index has continued to trend lower after a brief pause earlier in the year

*Economists have been caught off guard by the slowdown in the data recently
We will take a high-level look at the U.S. consumer this week, given the softening data is increasingly bringing into question the never-ending resilience consumers have displayed post-pandemic. Turning first to recent sentiment surveys, it is clear that a higher price at the pump (the average gas price has risen from $3.06 in mid-January to $3.64 last week, per EIA) and falling job security are weighing on overall confidence. On the margin, the upcoming presidential election also looks to be increasing uncertainty. As a result, the University of Michigan and Conference Board measures of consumer sentiment/confidence have notably dropped recently due to a broad weakening in current and future expectations for economic, labor, and personal financial readings (depending on the survey). Likewise, the NY Fed’s Survey of Consumer Expectations showed a weakening in views around the labor market. Interestingly, in combination, the declines in readings look broad-based, with the majority of age, income, and education level cohorts becoming more pessimistic. Further, spending plans have dropped significantly after trending higher since mid-2022, indicating that a further cooling in spending, especially for discretionary goods, may be coming.

*Both major consumer sentiment surveys have notably dropped in recent months

*Univ of Michigan's expected income dropped significantly in the most recent survey, while the NY Fed’s Expected Financial “Better” Situation index has broken below its recent multi-year range

*Buying conditions have broken down from recent improving uptrends, especially for large durable items
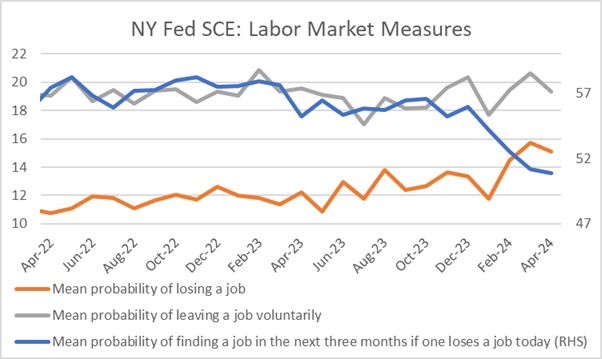
*Job security is worsening across a number of measures, including the NY Fed’s SCE survey, which has shown a pick up in layoff expectations

*An increasing amount of people are searching for how to collect unemployment claims, something that often leads actual initial claims rising
First-quarter earnings calls still painted a generally stable picture for the consumer. However, there has been a bifurcation, with companies that cater to lower-income consumers warning about reduced spending and pricing power while those with higher-income customers continue to experience stronger sales. This story has largely been covered, and we don’t need to highlight the winners and losers. Instead, the main takeaway is that, on aggregate, consumers are becoming increasingly more selective about how and where they spend their money. As a result, the current trends of discretionary services over discretionary goods, staples over discretionary, and greater price sensitivity causing a shift away from premium brands to cheaper alternatives, such as private labels, will all likely continue. The things that have seen the biggest run-up in prices, such as rent, gas, and food (both groceries and eating out), are the things consumers see daily. Further, the cost of insurance has significantly increased car and homeownership costs. These increased insurance service costs alone have negated any rises in disposable incomes for most consumers over the last year. As a result, although the Q1 earning call results and commentary were mixed, it is clear that lower-income consumers are struggling more than other demographics. Historically, lower-income consumers are the first to feel any coming slowdown. Again, this isn’t breaking news, but after reading dozens of earning call results and transcripts, we can confirm that it seems to be increasingly occurring.
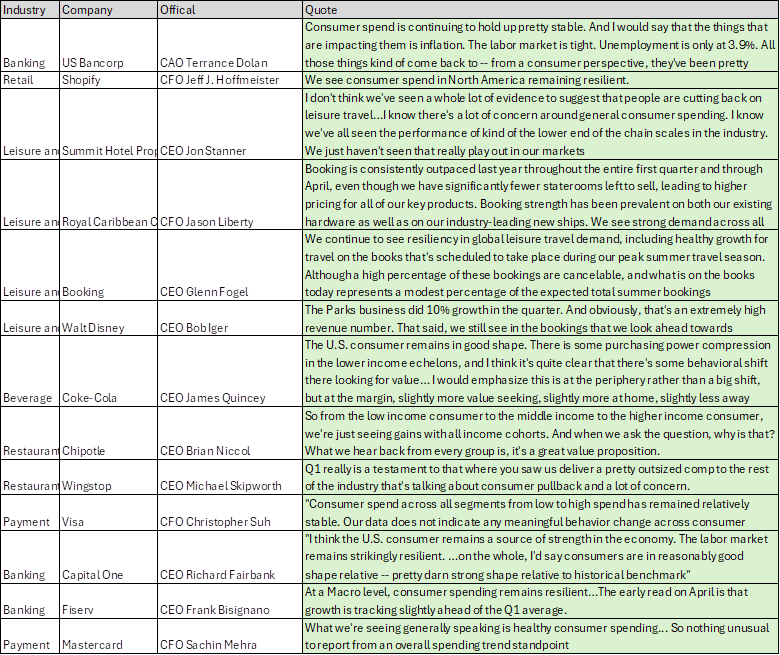
*Many companies reported a positive outlook for their customers…
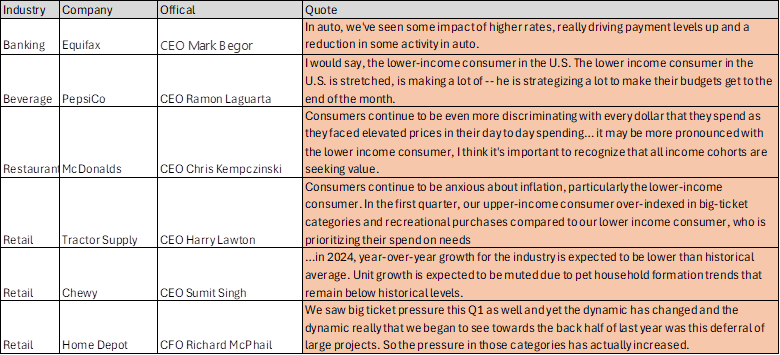
*…however, an increasing number of companies were more cautious about consumers in Q1, especially ones with lower-income customers

*There has been an uptick in the number of times C.E.O.s cite “low-income consumers” to explain why sales fell or why they give weaker guidance on profit
The final area regarding the U.S. consumer we want to cover briefly is their credit situation. Recent drops in revolving credit usage show a greater rate sensitivity and a reduced desire/ability by households to increase leverage levels, which will increasingly weigh on aggregate personal consumption. The higher delinquency rates across consumer loans (credit cards, auto, and “other”) reflect an increase in lending over the past few years to borrowers with lower credit scores and younger consumers, who had reduced student loan burdens and hence artificially higher FICO scores. As a result, the average consumer owes $6,218 on their credit cards, up 8.5% year-over-year, according to TransUnion’s recent quarterly report. We will not even try to tackle the “buy-now, pay-later” mystery, which has the makings to one day be a systemic problem. Altogether, the lower-income cohorts are showing the first signs of financial stress, while the age cohorts (18-29 & 30-39) that drive a lot of discretionary spending and household formation are also increasingly burdened by growing debt levels. Further, higher mortgage rates and tighter lending standards are likely leading households with positive home equity (which the country has a record amount of) to postpone HELOC borrowing until absolutely necessary (instead of for discretionary purposes). HELOC origination/borrowing has been relatively flat despite increases in limits (due to the increase in home values). Although this type of borrowing typically rises at this point in the cycle, the lack of movement here is a testament to the effects of tighter monetary policy. As with consumer confidence readings and Q1 earnings reports, we see a weakening picture, especially for lower-income cohorts, as increased debt burdens, higher rate sensitivity, and tighter credit conditions are reducing the desire/ability of households to increase leverage more generally to maintain spending activity.

*Although still below pre-pandemic levels, delinquency rates are trending higher

*The speed at which delinquencies have been picking up is, well, picking up

*The rise in delinquencies is, as usual, being driven by younger cohorts

*Housing price increases post-pandemic have created a large amount of positive home equity
In summary, we didn’t recreate the “where is the U.S. consumer” wheel in today’s note. We just connected three main areas, indicating that the consumer will likely become more entrenched and thrifty moving forward. As always, we strive to keep it simple and find a framework that allows monitoring of the current narrative. That current narrative has shifted from “no-landing” back to a “soft-landing.” Our argument for some time has been that we are now in the “soft-landing” part of the current cycle (as the “no-landing” part was over the last three quarters, where final domestic demand averaged around 3%). The tail risk of a harder landing is growing in the second half of this year. We believe markets are underestimating how quickly labor markets can loosen and weaken personal consumption expenditures, especially discretionary spending. We see the significant decline in hiring intentions over the last few months as leading to what will eventually be flat to negative payroll readings and rising amounts of initial/continuing claims. The consumer is catching wind of this, with confidence falling due to decreasing job security and still high prices. Reduced borrowing from higher costs and tighter conditions will also further weigh on consumption. Finally, the deterioration in lower-income spending, which has increasingly been highlighted this last quarter, will spread. As seen first in the weaker parts of the economy, rate sensitivity will increase more broadly the longer policy remains at these “restrictive” levels. The idea that we will magically glide inflation back to target while not incurring a weaker below-trend period of growth with higher levels of unemployment always seemed a little fanciful to us. Again, as we alluded to before, this loss of momentum does not mean a protracted deep recession, and we need to resist the urge to use binary classification for what is occurring. However, as we have written, the soft landing is now, and although risk assets still have some room to tactically rise; eventually, the weight of slower growth from a weaker consumer will outweigh any investor exuberance from expected easier future monetary policy. As a result, we closed our Russell long position last week (with a 3% gain) but are maintaining our S&P and Nasdaq longs. Seperately, we also opened a long position in oil (through the $USO ETF) and a long equity position in Turkey and South Africa (through $TUR and $EZA ETFs) based on idiosyncratic events on the ground there (as well as an RoW> U.S. growth bias). When we return from a week off, we will delve further into why we opened these three new positions, but we wanted to get these positions on the books.
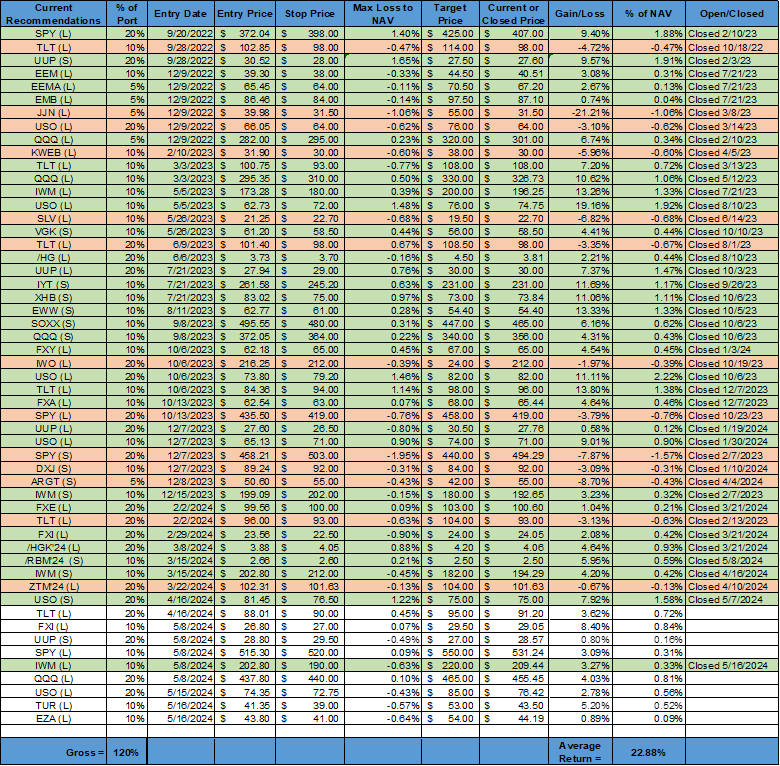
*The mock portfolio is now at 120% gross and 100% net, with the addition of our oil and EM equity longs, with every position in the green
As always, thank you for reading, and please share our newsletter if you like it and know others who may enjoy it. We will be off next week for the holiday.
Please feel free to reach out with any questions or comments. – Michael Ball, CFA, FRM
Sectors, Factors, Yields, and Charts:
The Nasdaq outperformed the Russell and S&P over the last five trading sessions. Technology, Real Estate, and Health Care were the best-performing sectors, while Momentum, Growth, and Low Volatility were the best-performing factors. Large-Cap Growth was the best-performing size/value combo.

@Koyfin
Treasuries are lower on the day, with yields higher by 1.7 bps, moving the 10yr yield to around 4.44%, while the 5s30s curve is little changed on the session, moving to around 12 bps.

Other Charts:

Sentiment has rebounded back to “stretched” positioning, according to Goldman.

Off-exchange activity has been surging, indicating increased retail participation. Platforms like Robinhood, E*TRADE, and Schwab frequently route orders to off-exchange venues, such as dark pools or internalizers. - GS

Investors still see the Magnificent 7 as the most crowded trade. - BofA
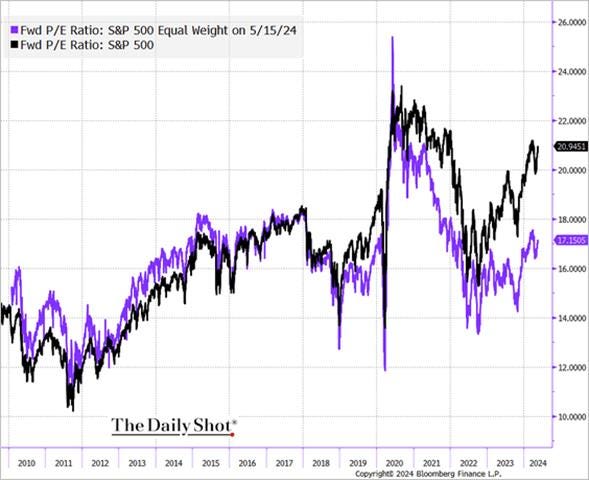
The S&P 500 average stock’s discount to the overall index continues to widen. - @DailyShot

Earnings growth is increasingly occurring in Nasdaq listed companies

The Citi Earnings Revision Index, calculated as the "percentage of analysts raising their EPS estimates for listed companies” minus the "percentage of analysts lowering their EPS estimates for listed companies,” is a valuable indicator for assessing corporate profit expectations. A positive index value suggests analysts generally hold optimistic views on corporate earnings outlooks, while a negative index value indicates pessimism. – MacroMicro

Aggregate expected buyback levels have shot higher given Q1 announcements, especially from Apple.

AI mentions on earning calls continue to rise. - GS

Citi's economic surprise index continues to drop, but this is a mean reverting measure, and it is likely that, moving forward, economists/analysts will be more pessimistic.

The US and EU have funneled nearly $81 billion toward cranking out the next generation of semiconductors — the first wave of close to $380 billion earmarked by governments worldwide for firms such as Intel and Taiwan Semiconductor Manufacturing Co. to boost production of more powerful microprocessors. – Bloomberg

Despite better performance from equities, capital flows continue to leave China as Western companies increasingly repatriate and divest… - Bloomberg

As a result, foreign FX at banks is falling. Some of this likely due to capital outflow, but some is also due to China directing state banks to intervene to prevent the currency from weakening too far. - Bloomberg
Appendix: Policy Talk, U.S. Econ Data Summaries, and Articles by Macro Themes
Policy Talk:
There were numerous Fed speakers again this week, with no notable change in the message following the week’s inflation and retail sales data. Chair Powell spoke at a special event organized by the Netherlands' Foreign Bankers' Association, where he reiterated his message of patience. “We did not expect this to be a smooth road, but these were higher than I think anybody expected,” Powell noted on the lack of inflation progress in the first quarter. “What that has told us is that we’ll need to be patient and let restrictive policy do its work.” Powell still thinks the current stance of policy was restrictive enough but admitted that it will take time to prove this. Powell noted that the labor market was still “very strong,” however, there were increasing signs of a gradual cooling and rebalancing, in part driven by an increase in labor supply from immigration as well as an easing in demand. He added the labor market is about as tight as it was before the pandemic in 2019. Vice Chair Jefferson spoke at a “Central Bank Communications: Theory and Practice” conference in Cleveland, where he mainly focused on how the Fed’s communication to the public has evolved. He indicated that he was comfortable with holding interest rates where they are until disinflationary progress resumed. Cleveland Fed President Mester, speaking at the same event as Jefferson, noted that it was too early to tell if disinflationary progress had truly stalled, saying she thought the pace seen in the second half of last year always seemed unsustainable. Mester said she thought that policy was “in a really good place” to deal with a range of risks. She said measures of expected future inflation by price- and wage-setters would be a significant focus of hers because those expectations can be self-fulfilling. She also stressed that “There are definite signs that the real side of the economy is moderating, and that is helping to bring balance back to the economy,” she said. “I don’t think you have to crush the real side in order to get inflation down.” She also gave prepared remarks later in the week in Ohio, reiterating much of the same message.
")
Minneapolis Fed President Kashkari reiterated the common message that the Fed will need to keep rates at current levels for some time, questioning how restrictive policy currently really was. “The biggest uncertainty in my mind is how much downward pressure monetary policy is putting on the economy,” Kashkari said at an event in North Dakota. He said he was focused on housing markets and their effects on inflation and expected a greater rate sensitivity to the economy moving forward. “It seems like there’s more resilience in the economy than I had expected,” Kashkari said. Governor Cook gave prepared remarks on community development financial institutions at an event hosted by the New York Fed, not commenting on policy. Richmond Fed President Barkin, in an interview on CNBC, continued to believe that demand would need to slow down a bit to get inflation to target. “To get to 2% sustainably in the right kind of way, I just think it’s going to take a little bit more time,” he said Thursday. “I still think there’s just a lot of movement on the services side, and it’s going to take a little bit of time. I do believe we are on the right path here.”

The New York Fed’s Survey of Consumer Expectations showed inflation expectations for the year ahead increased to 3.3% in April, the highest since November, from 3% in each of the previous four months. Further, inflation expectations at the three-year horizon decreased to 2.8% from 2.9% but increased to 2.8% from 2.6% at the five-year horizon. Year-ahead price expectations broadly increased. With gas (+0.3 percentage points higher to 4.8%), food (+0.2 percent points higher to 5.3%), medical care (+0.6 percent points higher to 8.7%), college education (+2.5 percentage points higher to 9.0%) and rent (+0.4 percentage points higher to 9.1%). Median home price growth expectations increased to 3.3%, the highest since July 2022, after remaining unchanged at 3% for seven consecutive months. Inflation uncertainty was unchanged at the one-year horizon but rose at the three-year, and declined at the five-year. Labor market measures skewed more negatively in April. Earnings expectations were unchanged (2.8%) for a second month, while the perceived probability of losing one’s job increased by 1.2 percentage points to 15.7%, the highest reading since 2020. The probability of leaving one's job voluntarily increased by 1.1 percentage points to 20.6. In comparison, the perceived probability of finding a job decreased by 1.3 percentage points to 51.2, the lowest reading in three years. Overall expectations for the unemployment rate to rise were unchanged at 36.2%. Household finance measures were more stable on the month. Household income over the next year was expected to increase by 3.1% in March, unchanged from the prior month and within a post-pandemic range. Spending growth did cool slightly to 5% (vs. 5.2%), but still well above its prepandemic average level. The perception of credit access improved slightly, but the future outlook for access worsened slightly, while the perceived likelihood of missing a debt payment rose to the highest level in four years. Perceptions about households’ current financial situations improved slightly, while year-ahead expectations were mostly unchanged.

*Uptick in one-year ahead inflation expectations off the top of its pre-pandemic range
The NY Fed’s First Quarter Household Debt and Credit Report showed total household debt rose by $184 billion to reach $17.69 trillion. Mortgage balances increased by $190 billion to $12.44 trillion, while home equity lines of credit (HELOC) increased by $16 billion to $376 billion. Mortgage origination continued at the same pace as the previous three quarters, around $400 billion. Limits on HELOCs grew by $30 billion and have grown by 14% over the past two years after ten years of decreases. Credit card balances declined by $14 billion (normal Q1 seasonality) to $1.12 trillion. Limits on credit cards increased modestly by $63 billion, slowing from prior quarters. Auto loan balances increased by $9 billion, increasing to $1.62 trillion. Other balances, which include retail cards and other consumer loans, decreased by $11 billion. Student loan balances were effectively flat, with a $6 billion decrease, and stand at $1.6 trillion. In total, non-housing balances fell by $22 billion. The credit quality of newly originated loans was steady, with the median credit score for newly originated mortgages flat at 770, while the median auto loans score moved slightly higher to 724, the highest on record. 3.2% of outstanding debt was in some stage of delinquency, up by 0.1 percentage points from the fourth quarter but still 1.5 percentage points lower than Q4 ’19. Delinquency transition rates increased for all product types over the quarter, with nearly 9% of credit card balances and 8% of auto loans transitioning into delinquency. About 44,000 individuals had new foreclosure notations on their credit reports, slightly more than the previous quarter.

*Total debt non-housing debt was little changed on the quarter due to declines in credit card balances

*Delinquency rates are rising and ticked somewhat notably higher in the quarter for credit card and auto loans
U.S. Econ Data Summaries:
The Consumer Price Index increased 0.3% in April, slightly less than 0.4% in each of the previous two months, and below forecasts of a 0.4% MoM increase. The annual rate moved lower to 3.4% from 3.5% in March. Core CPI increased by 0.3% MoM, slowing from 0.4% increases in March and February, which was in line with expectations. The annual core CPI rate moved lower to 2.6% in April, down from 3.8% in the prior month. Supercore CPI increased by 0.42% MoM, following a 0.65% increase in March and moving the annual rate to 4.9%. Food prices were unchanged on the month (vs. 0.1% MoM in March), with food at home declining by -0.2% MoM (vs. 0.0% MoM) and food away from home increased by 0.3% MoM (vs. 0.3% MoM). Energy prices increased by 1.1% MoM (vs. 1.1% MoM) due to gasoline rising by 2.8% MoM (vs. 1.7% MoM), while energy services declined by -0.7% MoM (vs. 0.7% MoM). Core goods declined by -0.1% MoM (vs. -0.2% MoM) due to declines in new vehicles (-0.4% MoM vs. -0.2% MoM), used vehicles (-1.4% MoM vs. -1.1% MoM), and furniture (-0.4% MoM vs. -0.1% MoM), while apparel (1.2% vs. 0.7% MoM) and other goods (0.1% MoM vs. -0.2% MoM) increased. Core services increased by 0.4% MoM (vs. 0.5% MoM), driven higher by shelter (0.4% MoM vs. 0.4% MoM) and transportation services (1.5% vs. 1.4% MoM), and to a lesser degree increases in medical care prices (0.4% MoM vs. 0.6% MoM), mainly due to hospital services (0.6% MoM vs. 1% MoM). There were declines in lodging away from home (-0.2% MoM vs. 0.1% MoM) and airfares (-0.8% MoM vs. -0.4% MoM), while motor vehicle maintenance was flat on the month.
Key Takeaways: Actual results came in weaker than expected for headline CPI for the first time this year, while core CPI was in line with forecasts. More importantly, the three-month annualized rate declined to 4.1% from 4.5% in March. However, the six-month annualized rate still rose and is at its highest since last July. As has been the case this year, the rise in car insurance and the persistence of shelter inflation accounted for around 78% of the core CPI’s monthly increase. Shelter alone contributed 17.5 bps to the monthly core CPI increase versus its average of 11bps during the two years before the pandemic. The Cleveland Fed’s median CPI increased by 0.3% MoM (vs. 0.4% MoM in March), moving the annual rate slightly lower to 4.5% (vs. 4.6%), while the trimmed-mean increased by 0.3% MoM (vs. 0.3% MoM), also decreasing the annual rate slightly to 3.5% (vs. 3.6%). The Atlanta Fed’s Sticky-Price CPI increased 4.6% (on an annualized basis) in April, decreasing from a 5.0% increase in March. On a year-over-year basis, the series is up 4.4%. Overall, April’s report may give the Fed some further confidence that disinflationary progress should meaningfully continue (after its Q1 pause) and move official readings back to target in a timely manner. The April core PCE index probably rose between 0.20% and 0.26%, according to the forecasters who map the CPI and PPI into the PCE. This is a level consistant with the Fed’s target. However, there was not a meaningful broadening in inflationary pressures, with shelter and auto insurance driving the bulk of April’s gain. Given what we currently know, with good prices effectively flat and energy likely to reverse recent gains in May’s report, expectations are for another weaker reading in a month. Further, although somewhat varies, Fed officials express a belief that shelter costs will fall and must take some comfort in the fact that insurance costs are being driven higher by more complex vehicles.

*The distribution of monthly changes in component prices seen above

*The three-month annualized change moved off recent highs seen last month, while the six-month increased slightly

*Supercore CPI increases are increasingly being driven by transportation service costs, mainly auto insurance

*Official housing continues to remain well above other measures, baffling Fed officials

*Median and trimmed mean measures moved slightly lower and remained the same, respectively

*Sticky-CPI declined on an annualized basis
The Producer Price Index increased by 0.5% in April, following a downwardly revised -0.1% fall in March, which was higher than a 0.3% MoM forecasted increase. The annual headline PPI moved higher to 2.2% from a downwardly revised 1.8% increase in March. Core PPI increased by 0.5% in April, following a -0.1% MoM decline in March and above market expectations of a 0.2% MoM increase. The annual core PPI rate increased to 2.4% in April from 2.1% in the prior month. Final demand for goods increased by 0.4% MoM (vs. -0.2% MoM in March), with a rebound in energy (2% MoM vs. -1.3% MoM), while core goods increased by 0.3% MoM (vs. 0%) and food costs decline by -0.7% MoM. Final demand for services increased by 0.6% MoM (-0.1% MoM), with trade (0.8% MoM vs. -1%), core services (0.6% MoM vs. 0.3%) accelerating, while transportation and warehousing declined by -0.6% MoM (vs. 0.2% MoM). Processed goods for intermediate demand increased by 0.6% MoM (vs. -0.5% MoM), while unprocessed goods for intermediate demand increased by 3.2% MoM (vs. -1.9% MoM) due to an 8.2% increase in energy materials. Services for intermediate demand increased by 0.1% MoM (0.2% MoM), with trade lower while transportation and warehousing and “other” increased.
Key Takeaways: Despite higher than expected, PCE feeding components in PPI were less troubling. This was reinforced by comments made by Powell following the data release, which highlighted that April results were mixed but, on balance, didn’t change the story. However, core finished goods firmed up a little after declines over much of last year, something that will need to be watched, given where manufacturing PMI price input readings have moved. Finally, service costs rose on trade margins widening and portfolio management fees increasing, driving nearly three-fourths of the overall increase. However, intermediate demand for services saw more subdued increases, with warehousing and logistical costs falling, indicating reduced supply-side inflationary pressures in the pipeline.

*April’s increases were somewhat offset by revisions lower to March

*Year-over-year readings for headline and core are ticking higher but remain in their pre-pandemic range

*Trade services and portfolio management fees played a notable part in driving final demand service prices higher
Import prices increased by 0.9% in April, accelerating from an upwardly revised 0.6% gain in March and beating market forecasts for a 0.3% increase. Prices for fuel imports advanced by 2.4%(vs. 5.4% MoM in March). Meanwhile, nonfuel import prices rose 0.7% MoM, the steepest pace since March 2022, due to increases in foods, feeds, & beverages (1.7% MoM vs. 1.6% MoM) and industrial supplies and materials (2.7% MoM vs. 2.7% MoM. Increases in capital goods (0.1% MoM vs. -0.2% MoM), autos (0.3% MoM vs. 0.2%), and consumer goods (0.1% MoM -0.3% MoM) were much lower. Year-on-year, import prices increased by 1.1% in April, increasing from 0.4% YoY in March. Export prices increased by 0.5% in April, accelerating from the downwardly revised 0.1% increase in the previous month and slightly above market expectations of a 0.4% MoM increase. Non-agricultural exports increased by 0.7% MoM (0.3% MoM) due to industrial supplies and materials increasing by 1% MoM (vs. 0.6% MoM) and autos rising by 0.8% MoM. In contrast, capital goods (0.4% MoM vs. 0.1% MoM) and consumer goods (0.1% MoM vs. 0.4% MoM) increased by less. This was enough to offset a -0.9% decline in prices of agricultural exports due to lower prices for other animal feeds, fruits, and vegetables. On an annual basis, export prices declined by -1%, rising from a -1.6% YoY decline in March.
Key Takeaways: The headline numbers for April’s report are not welcome news for disinflationary believers. However, taking out the effects of higher energy costs, which have now reversed notably, this report is more positive, with import price increases for capital and consumer goods as well as autos not raising red flags. The pressure from industrial supplies and materials was driven by higher energy input costs, so looking at the ex-fuels category is not truly stripping out the rise in energy costs over the last three months. With that said, the Fed will still put this in the negative data point category, but likely Powell will see this similar to PPI, with some positive developments (consumer and capital goods) versus overall headline increases.

*Import prices have continued to creep higher, with four months of gains now, mainly due to increases in energy costs

*Export prices are still negative on an annual basis but have also had four months of gains
Retail sales were unchanged month-over-month in April, following a downwardly revised 0.6% gain in March and missing forecasts of a 0.4% rise. Seven out of thirteen categories posted declines, with decreases in sales at nonstore retailers (-1.2% MoM vs. 2.5% MoM in March), sporting goods, hobby, musical instrument, & book stores (-0.9% MoM vs. -1.3% MoM), motor vehicles & parts dealers (-0.8% MoM vs. -0.3% MoM), and furniture stores (-0.5% MoM vs. -2.3% MoM). On the other hand, sales increased at gasoline stations (3.1% MoM vs. 2.1% MoM), clothing stores (1.6% MoM vs. -2% MoM), and electronics and appliances stores (1.5% MoM vs. -3.1% MoM). Core retail sales increased by 0.2%.
Key Takeaways: The weak reading for April's core sales points to a soft real personal consumption expenditure gain in the first month of the second quarter. It also shows that the street overestimated monthly spending, likely due to Redbook readings accelerating and auto sales and card data looking stable. However, the strong real PCE gains in February and March resulted in a high starting point for spending in the second quarter. Further, core retail sales are still running at a solid 2.7% on a three-month annualized rate. This leaves the annual PCE rate near its solid first-quarter average and leaving Q2 real GDP tracking on positive grounds.

*Total retail sales were unchanged, while the core group declined during the month

*Rising gas prices supported gas station sales, while apparel, electronics, and appliances did well

*The core control group declined by -0.3% mainly due to weaker auto sales, but also declines elsewhere
Industrial production was unchanged in April, following a 0.1% increase in March and missing market expectations of an increase of 0.1% MoM. Manufacturing output, which makes up 78% of total production, declined by -0.3% MoM, compared with the market forecast of a 0.1% MoM increase. Consumer goods production increased by 0.1% MoM (vs. 0.5% MoM in March), while business equipment declined by -0.5% MoM (vs. -0.2% MoM). Nonindustrial supplies declined by -0.2% MoM (vs. 0.2% MoM) due to a -1% decline in construction materials. Mining output decreased by -0.6% MoM (vs. -1.1% MoM), largely because of an -18.1% decline in the index for coal mining. On the other hand, the output of utilities increased by 2.8% MoM (vs. 1.6% MoM). Capacity utilization declined slightly to 78.4% in April, from 78.5% in the prior month and 1.2 percentage points below its long-run (1972–2023) average.
Key Takeaways: Total industrial production was driven lower by a drop in construction materials. Consumer goods production remains stable, while business equipment production has been more volatile. We see that trend continuing, while we are more pessimistic about any rebound in construction activity, and hence material demand as higher rates bite while the fiscal impulse normalizes.

*Production has been effectively flat over the last few months
Housing starts increased by 5.7% month-over-month to an annualized rate of 1.36 million in April, following a downwardly revised 1.287 million level in March and below forecasts of 1.42 million. Single-family starts declined by -0.4% MoM to 1.031 million, while multi-unit starts increased by 31.4% MoM to 322K. Starts rose in the Midwest (19.1% to 181K) and the South (10.1% to 799K) but fell in the Northeast (-22.6% to 72K) and the West (-2.5% to 308K). Building permits declined by 3% to a seasonally adjusted annual rate of 1.440 million in April, the lowest since December 2022 and below market expectations of 1.480 million. Approvals for multi-unit declined by -9.1% MoM to a rate of 408K, reaching the lowest level since October 2020, while single-family authorizations declined by -0.8% MoM to an eight-month low of 976K. Across different regions, there were declines in permits in the Midwest (-18.1% to 167K), and the West (-14.4% to 292K), while increases were reported in the South (4.2% to 827K), and Northeast (5.5% to 154K).
Key Takeaways: Total housing starts in April were slightly below expectations, and starts in February and March were revised down. With mortgage rates remaining high and home prices continuing to weigh on affordability, home builders' falling confidence should increasingly being reflected in more tepid start and permit numbers, especially for multi-unit. However, it was good to see some bounce back in multi-unit permits, given that the start rate is down 33.1% year-over-year.

*Total housing starts in April missed expectations, while starts in February and March were revised down

* Starts have been slightly lower this year for the last two months then last year
The NAHB/Wells Fargo Housing Market Index declined to 45.0 in May, the lowest in four months, down from 51 in April and below market expectations of 51. The sub-index for current sales conditions declined to 51 (vs. 57), the sub-index for sales expectations in the next six months declined to 51 (vs. 60), and the sub-index for traffic of prospective buyers declined to 30 (vs. 34). Looking at the three-month moving averages for regional HMI scores, the Midwest increased three points to 49, the Northeast declined two points to 61, the South declined two points to 49, and the West declined four points to 43. Around 25% of builders cut home prices to bolster sales in May, ending four months of consecutive declines in this metric, with the average price reduction in May held steady at 6% for the 11th straight month. Meanwhile, the use of sales incentives ticked up to 59% in May from a reading of 57% in April.
Key Takeaways: May marked the first decrease in builder sentiment since November 2023, which was attributed to mortgage rates remaining around 7% for the past month. “A lack of progress on reducing inflation pushed long-term interest rates higher in the first quarter, and this is acting as a drag on builder sentiment,” said NAHB Chief Economist Robert Dietz.

*The headline index moved lower due to each of the three sub-indexes falling while the regional picture was more mixed
The NFIB Small Business Optimism Index increased to 89.7 in April, slightly recovering from a more than 12-year low of 88.5 in March and beating forecasts of 88.1. Although down 3 points from March, inflation remained the primary concern for 22% of owners surveyed. Reports of labor quality as the single most important problem for business owners rose 1 point to 19%, while labor cost increased 1 point to 11%, only 2 points below the highest reading reached in December 2021.
Sales and Earnings: -13% (-3 points from March) of owners reported higher nominal sales in the past three months, while -12% (+6) expected higher future real sales. -27 (+2) reported positive profit trends. Among owners reporting lower profits, 33% blamed weaker sales, 14% blamed the rise in the cost of materials, and 12% cited labor costs. For owners reporting higher profits, 43% credited sales volumes, 26% cited usual seasonal change, and 11% cited higher selling prices.

Labor and Compensation: 12% (+1) of owners plan to create jobs in the next three months, while 56% (same) reported hiring or trying to hire in April, with 51% reporting few or no qualified applicants. 38% (unchanged) reported raising compensation, while 21% (unchanged) plan to raise compensation in the next three months.

Capital Spending and Inventories: 56% of owners reported capital investments in the last six months. Of those making expenditures, 38% (unchanged) reported spending on new equipment, 24% (unchanged) acquired vehicles, and 16% (-1) improved or expanded facilities. 22% (+2) plan capital outlays in the next few months. -6% (+1) of owners reported inventory gains, while -4% (+1) viewed current inventory stocks as “too low.” 6% (+1) of owners plan inventory investment in the coming months.

Inflation: 25% (-3) of owners reported raising average selling prices. Unadjusted, 13% (unchanged) reported lower average selling prices, and 41% (-2) reported higher average prices. Price hikes were most frequent in finance, retail, construction, and manufacturing. Seasonally adjusted, 26%
(-7) of owners plan price hikes in April.

Credit Markets: 3% (+1) of owners reported all their borrowing needs were not satisfied, while 28% (+1) said all needs were met, and 60% (+1) reported no interest in a loan. 31% (+3) of all owners reported borrowing on a regular basis. 8% (unchanged) reported their last loan was harder to get, while 21% (+4) reported paying a higher interest rate. The average rate paid on short-maturity loans was 9.3%, down by half a point from last month.

Key Takeaways: There was a notable jump higher in small business optimism mainly due to improved hard data sub-index readings and despite uncertainty still trending higher. Although reported current sales fell, small business owners expect future sales and, as a result, earnings to increase. Pricing power fell, with both current and future price increase plans lower on the month, leading this report to have the lowest inflation readings since April of last year. Labor readings were little changed, with no notable move in hiring or compensation plans. However, labor quality as a top problem for small business owners has eased considerably over the last two quarters. Credit availability was slightly tighter; however, a large percentage of owners were still uninterested in a loan. Borrowing costs look to be off recent highs.

*Harder index components moved higher than softer on the month

*The uncertainty index remained near the highs of the year despite improved sentiment more generally
The New York Fed’s Empire State Manufacturing Index fell to -15.6 in May from -14.3 in the previous month, below the market consensus of -10.0. New Orders (-16.5 vs. -16.2 in April) were little changed and remained contractionary, as did Unfilled Orders (-8.1 vs. -10.1). Shipments (-1.2 vs. -14.4) moved higher and closer to a neutral reading. Delivery Times (-9.1 vs. -7.9) shortened further, while Inventories (2 vs. 3.4) moved closer to a neutral reading. Labor measures were mixed, with the Number of Employees (-6.4 vs. -5.1) contracting at a slightly faster pace, while the Average Workweek (-5.8 vs. -10.6) shortened at a reduced rate. Price measures cooled slightly, with Prices Paid (28.3 vs. 33.7) and Prices Received (14.1 vs. 16.9) rising at a reduced rate. Forward-looking indicators showed the expected general business activity level as little changed due to no change in future new order and inventory expectations, higher hiring and workweek intentions, and a notable drop in future shipments. Future price readings were mixed but remained expansionary. Capex spending intentions fell to near neutral while technology spending expanded at a greater pace.
Key Takeaways: There was little change in the headline reading despite a notable pick-up in shipment activity. The majority of the sub-indexes continue to indicate contractionary levels of activity. There is some comfort in the fact that price readings generally fell except for forward prices paid. With hiring intention negative, delivery times shortening, and demand negative, this report indicates no acceleration in manufacturing activity in May in the New York Fed’s district.

*The overall index was little changed on the month, remaining in contractionary territory

*Price measures cooled slightly but remain expansionary, although more aligned with pre-pandemic levels

*Future tech spending intentions held up, but other Capex plans are now near neutral
The Philadelphia Fed’s Manufacturing Index declined to 4.5 in May, from a two-year high of 15.5 in April, and below market expectations of 8. Current demand and activity measures broadly cooled. New Orders (-7.9 vs. 12.2), Unfilled Orders (0.8 vs. -11.5), and Shipments (-1.2 vs. 19.1) all fell back into contractionary territory. Delivery Times (-0.8 vs. -9.4) moved to neutral, while Inventories (-10.1 vs. -8.9) decreased at a faster pace. Price measures were mixed, with Prices Paid (18.7 vs. 23) expanding at a reduced rate and Prices Received (6.6 vs. 5.5) increasing slightly. Labor metrics improved but remained contractionary, with the Number of Employees (-7.9 vs. -10.7) and Average Workweek (-8.3 vs. -18.7) higher. The forward general business activity index changed little on the month, with subindex readings all in expansionary territory. There was a notable decline in expected prices paid, while hiring intentions jumped up. Capex plans were little changed and remained expansionary.
Key Takeaways: The current general business activity reading fell slightly on the month after a significant jump in April. Subindex readings showed a notable reversal in demand and activity, while other readings changed by much less. Future readings did not indicate a deeper increase in worries by respondents, with hiring and Capex plans remaining expansionary. The month’s special question showed little change in pricing/cost plans/expectations, with firms expecting to increase prices by 3% (same as Feb), while compensation plans declined to 3.5% (vs. 4%). Actually prices received fell to 2.7% (vs. 3%), but views on the overall inflation backdrop were unchanged at 3% for the next year.

*Both current and future general business activity indexes fell after jumping in April

*Subindex readings were more mixed, with current demand and activity measures dropping notably
Articles by Macro Themes:
Medium-term Themes:
Half the World (2024 Election News):
ANC Minority: For the first time since White-minority rule ended three decades ago, South Africa is heading into national elections in which an outright winner isn’t apparent. The rand erased the year’s losses and South Africa’s benchmark stock index closed at the highest level in more than nine months as investors positioned for a market-friendly outcome in the May 29 election. “The recently released Ipsos poll revealed that while the ANC will likely lose its majority, a coalition with a less market friendly political party may be avoided,” said Brendan McKenna, emerging-markets FX strategist at Wells Fargo & Co. “Optimism for a degree of policy continuity post-election is pushing USDZAR lower over the last few weeks.” - Rand Erases Losses on Optimism Over South African Vote Outcome - Bloomberg

China’s Rebalancing Act:
Preventing Risks: China’s credit in April shrank for the first time as government bond sales slowed, while loan expansion was worse than expected in a sign of weak demand. Aggregate financing, a broad measure of credit, decreased by almost 200 billion yuan ($27.7 billion) in April from the previous month. A breakdown of the data shows that more government bonds were repaid than sold in the month, contributing to the decline. Financing from shadow banking, which refers to activities outside the formal banking system, also recorded a drop, weighing on overall credit. There were also certain seasonal and one-off aspects leading to the dramatic fall. - China Credit Shrinks for First Time, Loan Growth Disappoints – Bloomberg

Tepid Consumption: China’s consumer prices edged up modestly in April while its factory-gate prices continued to fall. China’s consumer-price index rose for a third straight month in April, increasing at a pace of 0.3% compared with a year earlier, according to official data released Saturday, edging up from March’s 0.1% reading and surpassing the 0.2% growth expected by economists. Meanwhile, the producer-price index fell 2.5% in April from a year earlier for a 19th consecutive month of declines. Economists say China’s persistently weak inflation readings suggest Beijing is unlikely to be able to count on the country’s 1.4 billion consumers to hit its lofty growth target of around 5% this year, as a drawn-out real-estate slump continues to hold back households’ desire to spend. - China Disinflationary Headwinds Continue as Consumers Hold Back – WSJ

China to Start $138 Billion Bond Sale on Friday to Boost Economy - Bloomberg
China Auto Sales Fell in April Amid EV Price War – WSJ
China to Nurture Stock Rally by Masking Live Foreign Flows Data - Bloomberg
China Considers Government Buying of Unsold Homes to Save Property Market – Bloomberg
Longer-term Themes:
The Singularity is Near (AI Developments) and Cyber Life (More Generally):
Trying to Secure: The White House last week published the second version of its implementation plan for the National Cybersecurity Strategy. The National Cybersecurity Strategic Implementation Plan lays out 100 high-impact initiatives, includes 31 new objectives and brings in six agencies to lead initiatives for the first time, the White House said Tuesday. The initiatives are categorized into five pillars: defend critical infrastructure, disrupt and dismantle threat actors, shape market forces to drive security and resilience, invest in a resilient future, and forge international partnerships to pursue shared goals. The State Department also unveiled its International Cyberspace and Digital Strategy last week. The strategy articulates a doctrine of “digital solidarity,” emphasizing the role of technology in diplomacy and the need to build international coalitions to uphold an “open, inclusive, secure, and resilient” internet through “responsible state behavior” in cyberspace. - White House Issues 2nd National Cybersecurity Strategy Implementation Plan, Announces ONCD Cybersecurity Posture Report – ExecutiveGov

US and China to hold first talks to reduce risk of AI ‘miscalculation’ - FT
What’s next for AI regulation in 2024? – MIT Tech Review
Senators Propose $32 Billion in Annual A.I. Spending but Defer Regulation - NYT
The Demise of Unipolarity: A World of Rising Regional Sphere
Cooperation Agreements: China and Hungary will expand cooperation in several areas, including in the nuclear power industry, Hungarian Prime Minister Vitkor Orban announced in Budapest on May 9 after talks with visiting Chinese President Xi Jinping. "China is one of the pillars of the new world order," Orban told a press conference in the Hungarian capital. Orban said bilateral trade had quadrupled in the past 20 years, transforming relations between Beijing and Hungary into "a strategic partnership." Orban said Chinese investment was so small in Hungary 20 years ago that a "magnifying glass" was needed to find it. Last year, however, three-quarters of all foreign investment in Hungary was by China, Orban said, adding it provided jobs for tens of thousands of Hungarians. - Orban Meets With Xi, Calls China 'One Of The Pillars Of New World Order' - RadioFreeEurope
 talks with Hungarian Prime Minister Viktor Orban (right) prior to their official talks in Budapest on May 9.")
Biden to Quadruple Tariffs on Chinese EVs – WSJ
Food: Security, Innovations, and Climate Change Implications:
Faster: Chinese scientists have grown rice in greenhouses in the deserts of its Xinjiang region, in half the time as it takes to grow the variety elsewhere. China is looking for new areas to cultivate crops as self-sufficiency demands are on the rise in era of climate change and trade tensions. - China halves rice-growing cycle in deserts of Xinjiang, opening new front in food security drive - SCMP

Solar Storm Knocks Out Farmers' Tractor GPS Systems During Peak Planting Season – 404Media
Cold Places (Deep Sea, Artic, and Space Capitalization):
Crowded Skies: Planet Earth gained a record number of satellites (nearly 3,000) last year, exacerbating orbital congestion. That brought the total number of satellites in Earth's orbit to 12,597 at the end of last year. Crowded orbits and collisions between satellites raise the risk of creating dangerous space debris and making parts of the planet's orbit unusable. "The industry has been saying space is becoming more congested for years, but now reality is setting in and the pressure is on to address the increasing risk in orbit," Melissa Quinn, general manager at Slingshot Aerospace said in a press release. - Congestion in Earth's orbit is getting even worse - Axios

More subsea cables bypass China as Sino-U.S. tensions grow - NikkeiAsia
Automated Warfare:
Asymmetry: Taiwan is looking to buy U.S.-made loitering munitions—also known as suicide drones—which have become one of the signature weapons on the modern battlefield, from Nagorno-Karabakh to Ukraine, hovering over fighting for hours at a time before swooping in for the kill. Taiwan’s interest in the U.S.-made drones is an increasing sign that Taipei is bowing to the U.S. push—which dates back to the Trump administration—to focus on buying munitions that would help deter or ward off a Chinese invasion of the island. - Taiwan Wants Suicide Drones to Deter China – FP

Other Articles of Interest:
Suddenly There Aren’t Enough Babies. The Whole World Is Alarmed. – WSJ
Stubbornly High Rents Prevent Fed From Finishing Inflation Fight – WSJ
Inside the Rent Inflation Measure That Economics Nerds Love to Hate - NYT
Podcasts and Videos:
Viewpoints with Burkhard Varnholt - A global markets podcast - UBS
Global Data Pod Weekender: We’re talking about tracking - JPM
Zero: The Climate Race - Bloomberg
VIEWS EXPRESSED IN “CONTENT” ON THIS WEBSITE OR POSTED IN SOCIAL MEDIA AND OTHER PLATFORMS (COLLECTIVELY, “CONTENT DISTRIBUTION OUTLETS”) ARE MY OWN. THE POSTS ARE NOT DIRECTED TO ANY INVESTORS OR POTENTIAL INVESTORS AND DO NOT CONSTITUTE AN OFFER TO SELL -- OR A SOLICITATION OF AN OFFER TO BUY -- ANY SECURITIES AND MAY NOT BE USED OR RELIED UPON IN EVALUATING THE MERITS OF ANY INVESTMENT.THE CONTENT SHOULD NOT BE CONSTRUED AS OR RELIED UPON IN ANY MANNER AS INVESTMENT, LEGAL, TAX, OR OTHER ADVICE. YOU SHOULD CONSULT YOUR OWN ADVISERS AS TO LEGAL, BUSINESS, TAX, AND OTHER RELATED MATTERS CONCERNING ANY INVESTMENT. ANY PROJECTIONS, ESTIMATES, FORECASTS, TARGETS, PROSPECTS AND/OR OPINIONS EXPRESSED IN THESE MATERIALS ARE SUBJECT TO CHANGE WITHOUT NOTICE AND MAY DIFFER OR BE CONTRARY TO OPINIONS EXPRESSED BY OTHERS. ANY CHARTS PROVIDED HERE ARE FOR INFORMATIONAL PURPOSES ONLY, AND SHOULD NOT BE RELIED UPON WHEN MAKING ANY INVESTMENT DECISION. CERTAIN INFORMATION CONTAINED IN HERE HAS BEEN OBTAINED FROM THIRD-PARTY SOURCES. WHILE TAKEN FROM SOURCES BELIEVED TO BE RELIABLE, I HAVE NOT INDEPENDENTLY VERIFIED SUCH INFORMATION AND MAKE NO REPRESENTATIONS ABOUT THE ENDURING ACCURACY OF THE INFORMATION. I MAY OR MAY NOT HAVE POSITIONS IN ANY STOCKS OR ASSET CLASSES MENTIONED. I HAVE NO AFFILIATION WITH ANY OF THE COMPANIES OTHER THAN EXPLICITLY MENTIONED.