
The Policy Error Trap: Has the Fed’s “Transitory” Mistake Created a “Too High for Too Long” Bias?
Color on Markets, Economy, Policy, and Geopolitics

Stronger-than-expected data and dovish Fed rhetoric were keeping the “goldilocks” soft-landing narrative alive, supporting the rotation into small caps and rally in rates; however, overbought conditions and renewed uncertainty is now weighing on sentiment into the heart of Q2 earnings season
The Fed is on track for its first rate cut of the cycle in September to offset the rising real policy rate due to falling inflation; however, softening labor markets and stronger disinflationary progress between now and then may show that they waited too long
With seasonals turning more negative and markets pricing in a perfect scenario, the current rotation should pause, with tech and growth likely resuming leadership throughout the rest of the earnings season while rates move sideways until the July jobs report gives additional clarity on the state of the economy and Fed
The Fed is waiting too long!
We believe the Fed is making a policy error by waiting until September to cut rates. Core PCE, by its preferred inflation gauge, has fallen from 4.3% to 2.6%, the steepest decline since 1984, and within an acceptable distance of the Fed’s 2% target (in our opinion). Meanwhile, the unemployment rate has risen to 4.1% from 3.6%, an increase seldom seen outside recessions, while other labor market metrics are all clearly cooling.
Fed officials, although acknowledging renewed disinflationary progress, continue to indicate they are not yet convinced its “mission accomplished,” as a result, the real effective Fed funds rate continues to rise at the same time the interest rate sensitivity of the economy is increasing (as refinancing or new borrowing needs occur).

We reached our U.S. equity targets last Friday and have closed our S&P and Nasdaq index longs.
The current rotation-themed price action (specific to U.S. equities) seems counterintuitive to what is occurring in the economy. What started as a hedge fund short-squeeze on small-cap hedges due to yields falling after the weaker CPI data has morphed into a “Goldilocks” soft-landing forecast (again).
The key takeaways are:
Asset managers and leveraged funds have been very long equity futures and overweight tech and growth. As a result, there wasn’t a lot of dry powder left to keep the current rally going
Seasonals become much less supportive as we move into August
Negative headlines regarding increased levels of semiconductor sanctions against China, Trump’s comments on Taiwan, and disappointing guidance from ASML drove the semi-index to break down into the open
Imbalance of flows dedicated to suppressing SPX/Index volatility versus expanding single stock vol has hit extremes, as seen in things like correlation metrics (COR1M at record lows) and index concentration metrics (top 10 stocks are 18% of S&P500, that’s the 2nd highest ever).
Yesterday’s VIX expiration and tomorrow’s OPEX exacerbated the negative price action in tech and growth throughout the day due to this setup in both positioning and vol levels

The bottom line is that the market got too stretched, with 5,500 on the S&P now a significant “risk off level.” A break below there could trigger a strong volatility response.
Specifically to small caps, we are increasingly hearing from the regional banks this week (the large segment of the Russell 2000). Investment banks reported solid numbers led by the trading desks, but NIMs continue to be under pressure, as was wealth management, two areas that often drive regional bank’s profits. Further, the commercial real estate market hasn’t materially improved (at best stabilized). Hence, the breakout in regional bank stocks based on reduced regulation (under a presumed Trump victory) and lower interest rates seems to have fully priced in the good news.

We expect regional banks to increase their loan loss reserves and remain cautious on stock buybacks due to ongoing pressures from CRE loans, which will weigh on actual earnings moving forward. Yields are not drastically lower; therefore, we’re likely to continue to see unrealized losses on the balance sheets of regional banks as well.

The yield curve remains inverted, and at some point, if Trump remains the expected victor, investors will demand additional term premiums, given how inflationary and deficit-increasing his policies are expected to be, which may eventually push longer rates higher and pressure on small-caps, which due to higher leverage levels are more rate sensitive. However, there are entirely too many chaotic moving parts to understand where all the election results may be moving.
Finally, outside banks, the Russell 2000 is still facing a tough earnings story despite more positive Q2 expectations. With increased price sensitivity from end consumers, margin pressures are unlikely to improve, especially if input costs remain more sticky, as regional PMIs have indicated.
As a result, we are not chasing this rally in small caps; instead, we are starting a short position in the Russell ($IWM) and the regional banks ($IAT). We may be early here, but our belief that the economy is cooling, increasing margin pressures, and yields are less likely to decline further as Trump becomes the presumed winner of the November election makes the recent rally less likely to be sustainable.
Turning to inflation, we see recent disinflationary progress as potentially improving despite a pick-up in regional PMI price readings and increased mentions of logistical cost increases.
Core services CPI excluding rents declined by -0.1% in June, tying August and January 2021 as the most benign monthly reading since May 2020. Over the last three months, this measure of prices has risen by just 1.3% at an annual rate.
We believe…
OER is going to trend lower, driven by further deflation in the south and west, while the outsized increases from the northeast, mainly due to NYC, will normalize (with NYC eventually falling off in Q4)
The All Tenant Regressed Rent Index (ATRR), which measures the rent paid by all renters and incorporates most of the survey data used for the CPI Rent of Primary Residence Index. In Q2, ATRR readings decreased by -0.2%, its lowest QoQ change since 2010, suggesting that there could be more moderation in shelter inflation metrics ahead.
The Atlanta Fed’s Sticky and Flexible CPI readings are all dropping notably, and when combined with continued disinflationary progress in the Cleveland Fed’s Median and Trimmed-Mean CPI readings, indicates the breadth of inflationary components continues to weaken
The PPI beat was due to trade services. However, intermediate demand prices were more subdued, with intermediate trade up by less than half, and as a result, it looks to be a one-off, not a renewed inflationary pulse through expanding margins
More generally, firms have lost considerable pricing power in this more consumer-price-sensitive world, as we increasingly hear every week. This is an entirely different environment, with consumers much more defensive

Where does this leave us with the Fed?
As we started today’s note, the Fed, scarred from its initial wrong “transitory” reading on the current inflationary wave, has fallen into a different emotional bias, keeping it from correctly reading the economic tea leaves.
With this said, there are signs that the conversation will be different around the table at next week’s July FOMC meeting after a continued move higher in more hawkish communication due to the Q1 renewal in inflationary pressures.

According to remarks this week by Jerome Powell, recent data has added to the Fed’s confidence that inflation is moving sustainably toward 2%. As a result, he has reintroduced “disinflationary” rhetoric into his official speeches and comments and skewed more dovishly by indicating that the central bank will not hold out until core PCE reaches 2%.
“The implication of that is that if you wait until inflation gets all the way down to 2%, you’ve probably waited too long, because the tightening that you’re doing, or the level of tightness that you have, is still having effects which will probably drive inflation below 2%,” Powell said at an event hosted by the Economic Club of Washington, DC.
Other Fed more dovish officials, such as Daly, Kugler, and Goolsbee, have indicated they are ready to cut. In an interview on Tuesday, New York Fed President Williams maintained that a rate cut was highly unlikely at the July meeting, even if one or two officials pushed for it. That is stating the obvious, but still a notable dovish acknowledgment of where the conversation has moved to.

More centralist members still indicated they needed more evidence. Comments by Waller this week were also more pragmatic and indicated that September is very much in play if the current trends in inflation and labor markets remain intact.
We continue to believe job creation will stall into the election due to already high levels of uncertainty and a weaker final demand backdrop.

We’ve covered this extensively in recent writings, so we will only add a few more points…
Payrolls expanded by an average of 177K in Q2, down from 267K in Q1. Breadth recovered in the June report but has generally been trending weaker
The median time it takes for an unemployed worker to find a job rose to 9.8 weeks, the most since February 2022
Claims continue to point to a more negative picture. Although this week’s intial claims were higher due to weather effects out of Texas and Florida, continued claims are at their highest levels since November 2021
On the positive side, the increase in the unemployment rate is for the right reasons. The gain is not so much due to companies laying off workers, but rather an expansion in the labor force.

This week’s “harder” U.S. economic data (retail sales, industrial production, and housing starts) showed that, although cooling, growth and the consumers are far from dead. Spending has definitely moderated this year, but retail sales ex-auto and gasoline sales, were stronger than expected, moving the annualized pace YTD to 2.1%, compared to a 5.9% increase over 2023.
Softer data received through the Fed’s Beige Book indicated economic activity seemed to weaken in the past two months, with five of the Federal Reserve’s twelve regions reporting flat or declining activity. That was three more “weak” districts than were reported in the last survey in May. The Beige Book also reported hiring was becoming easier while consumers were showing increased price sensitivity.
“While consumer spending was generally reported as showing little to no change almost every District mentioned retailers discounting items or price-sensitive consumers only purchasing essentials, trading down in quality, buying fewer items, or shopping around for the best deals.” – Beige Book

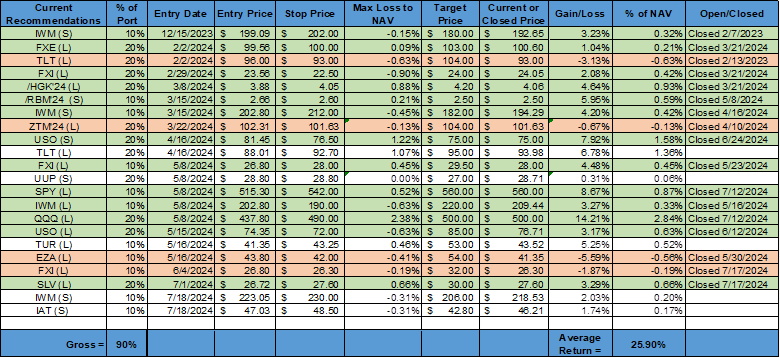
Turning to our mock portfolio, besides closing our long U.S. equity positions, we also were stopped out of our long Chinese equity position ($FXI) for a loss. With a second Trump presidency becoming the modal outcome and economic data indicating a muddle-through at best for growth domestically, Chinese equities continue to move sideways after pulling back from their Q1 rally.
Further, we have been stopped out of our long silver position after moving the stop higher to lock in profits. The fundamental story for silver has become more balanced, and as the price broke down this week, a three-wave rally looks less likely.

As of writing, the mock portfolio has a cumulative average return of 25.9%, with five positions open: long long-end Treasuries, short the U.S. dollar, long Turkish equities, and now short the Russel and regional banks.
We will conclude with some final thoughts:
If Treasury yields and the dollar continue to decline due to a U.S. slowdown, we could finally see the Japanese Yen advance sharply against most currencies. This could cause a violent unwind of carry trade positioning, as the Yen has been used as a funding currency and would force a severe unwind, creating volatility that could spread to other asset classes
We know that volatility increases and decreases in waves, especially when macro conditions shift, as they may be doing now. Therefore, we are closely watching where implied vol is going for both equities (VIX) and rates (MOVE) in determining tactical trading themes, especially around future job reports, the most likely catalysts
Big Tech could easily bounce back. Capital Economics’ John Higgins believes the stock market’s bubble will continue to inflate amid the hype around A.I., just like the one around the internet in the second half of the 1990s. “Back then, small-cap stocks generally underperformed their large-cap peers until the mid-1999,” he said. “That wasn’t long before the bubble burst in 2000, and a recession followed in 2001.” We don’t believe we are there yet and, as a result, think the A.I. trade will come back into vogue over the next few weeks due to earnings call results showing capex heavyness there versus weakening demand elsewhere

As always, thank you for reading, and please share our newsletter if you like it and know others who may enjoy it. Please feel free to reach out with any questions or comments. – Michael Ball, CFA, FRM
VIEWS EXPRESSED IN “CONTENT” ON THIS WEBSITE OR POSTED IN SOCIAL MEDIA AND OTHER PLATFORMS (COLLECTIVELY, “CONTENT DISTRIBUTION OUTLETS”) ARE MY OWN. THE POSTS ARE NOT DIRECTED TO ANY INVESTORS OR POTENTIAL INVESTORS AND DO NOT CONSTITUTE AN OFFER TO SELL -- OR A SOLICITATION OF AN OFFER TO BUY -- ANY SECURITIES AND MAY NOT BE USED OR RELIED UPON IN EVALUATING THE MERITS OF ANY INVESTMENT. THE CONTENT SHOULD NOT BE CONSTRUED AS OR RELIED UPON IN ANY MANNER AS INVESTMENT, LEGAL, TAX, OR OTHER ADVICE. YOU SHOULD CONSULT YOUR OWN ADVISERS AS TO LEGAL, BUSINESS, TAX, AND OTHER RELATED MATTERS CONCERNING ANY INVESTMENT. ANY PROJECTIONS, ESTIMATES, FORECASTS, TARGETS, PROSPECTS AND/OR OPINIONS EXPRESSED IN THESE MATERIALS ARE SUBJECT TO CHANGE WITHOUT NOTICE AND MAY DIFFER OR BE CONTRARY TO OPINIONS EXPRESSED BY OTHERS. ANY CHARTS PROVIDED HERE ARE FOR INFORMATIONAL PURPOSES ONLY AND SHOULD NOT BE RELIED UPON WHEN MAKING ANY INVESTMENT DECISION. CERTAIN INFORMATION CONTAINED IN HERE HAS BEEN OBTAINED FROM THIRD-PARTY SOURCES. WHILE TAKEN FROM SOURCES BELIEVED TO BE RELIABLE, I HAVE NOT INDEPENDENTLY VERIFIED SUCH INFORMATION AND MAKE NO REPRESENTATIONS ABOUT THE ENDURING ACCURACY OF THE INFORMATION. I MAY OR MAY NOT HAVE POSITIONS IN ANY STOCKS OR ASSET CLASSES MENTIONED. I HAVE NO AFFILIATION WITH ANY OF THE COMPANIES OTHER THAN EXPLICITLY MENTIONED.