


The Correction is Here as Rising Real Rates Kill the Rally While the Fed Focuses on the “Totality” of Data – Midday Macro – 8/18/2023
Color on Markets, Economy, Policy, and Geopolitics

The Correction is Here as Rising Real Rates Kill the Rally While the Fed Focuses on the “Totality” of Data – Midday Macro – 8/18/2023
Market’s Weekly Narrative and Headlines:
The S&P is ending the day flat on a lower volume OPEX Friday. Still, stocks were down notably on the week, with the growth factor and tech sector underperforming due to greater duration sensitivity. Top and bottom line beats, as well as stronger guidance from the likes of Target and Walmart this week only drove home the point that the consumer remained resilient and, in combination with a stronger-than-expected July Retail Sales report as well as increased housing starts and a stronger industrial production reading due to autos, drove Treasury yields higher, with the 10yr yield rising above 4.3% yesterday before retracing a little. With the Atlanta Fed’s GDPNow projecting an almost 6% annualized GDP growth rate for Q3, the “no-landing camp” is gaining traction. This also means the Fed is likely not done, something the July FOMC Minutes teased at with a node to the totality of data now being the main guiding principle for future policy moves, something we discuss further below. The backup in nominal yields is primarily driven by rises in real rates, given the continued trend lower in inflation readings and expectations, which is increasingly tightening financial conditions and supporting the dollar, both acting as a headwind to stocks. Oil cooled over the week, in line with the general risk-off tone, and despite the overwhelming amount of policy announcements out of China, showing markets continue to question the ability of Beijing to turn things around there. Copper faired a little better, little changed on the week, but still near recent lows. The agg complex got an increasing bid throughout the week, with worries about grain supply increasing. Finally, as noted, the dollar continues to benefit from higher yields and a more risk-off tone, with the $DXY ending the week at 103.5, as the Euro slid lower to 1.088 and AUD and CAD also weakened.

Deeper Dive:
This week continued the theme of a resilient consumer driving stronger-than-expected growth, which, combined with increased Treasury supply, rising yields elsewhere (lowering demand), and other factors (such as rating downgrades), moved real rates higher. Said another way, the perceived duration the Fed will stay “higher for longer” is growing. With the Fed increasingly talking about the “totality” of the data, it is clear that a further rate hike in November is also possible. This is because the “totality” of the data shows stronger than expected growth, inline progress on rebalancing the supply and demand of labor, and incrementally better progress on the inflation front. Unfortunately, as seen in the minutes, the FOMC Committee still sees the risks skewed towards doing too little in bringing inflation back to target verse over-tightening.

*The rise in yields has been mainly from increases in real rates

*Bonds have been dragging stocks lower in August
Interestingly, the high level of uncertainty expressed in July’s FOMC Meeting Minutes over the impact tightening credit conditions will have on top of the lagged cumulative effects of tighter policy hasn’t created a more two-sided risk management approach. By expanding the scope of data considered in making future policy decisions, the Fed has invited greater market uncertainty over the path of policy moving forward. Of course, financial conditions are retightening, as seen in the recent selloff in rates followed by the current correction in risk-assets more generally, along with dollar strength. This is more in line with the hawkish-skip message struck following the June FOMC meeting, where Powell and the committee discounted progress on the inflation front through increases in the SEPs Fed Fund end-of-year projections. As a result, the current price action continues to make sense to us, and we are happy with the mock portfolio short equity long dollar bias.

*Projected growth is too strong, allowing the Fed to stay hawkish and revert to thinking that inflation will remain sticky even if there seems to be less correlation there than models expected

*Households continue to be “resilient” due to strong balance sheets and stable incomes

*Despite no signs that inflation expectations are becoming unanchored, hawkish members still highlight the absolute year-ahead level as too high
In the short term, real rates are increasingly becoming a headwind to stocks, especially for growth (verse value) and sectors such as Tech, which have seen substantial P/E expansions over this year's rally. However, as long as real rates are rising for the right reasons, risk assets can still work over a longer horizon. In other words, if markets are correct in their current assessment that the economy is stronger than previously thought and a recession isn’t coming, then the rise in real yields is appropriate and, actually, a positive as it will help rebalance the economy into a more organically sustainable rate of growth (opposed to one fueled by leverage/credit that moves capital into nonproductive means). After all, that economic strength will mitigate any problems for risk assets as actual earnings growth counters P/E expansion headwinds from tighter financial conditions. With the data continuing to hold up, this outcome is still possible, and as a result, the current correction in stocks may be short-lived. The problem is that the Fed and other central banks worldwide continue to believe they need a prolonged period of below-trend growth to properly re-anchor inflation. This means you are effectively fighting the Fed if you take an overly bullish view on growth and, by relations, risk assets currently, something that hasn’t worked out well historically. As we said before, the use of “totality” is a game changer and raises the bar for how much CPI, all else equal, needs to fall for the Fed to move on to the next stage of the monetary policy cycle, locking in the duration it wishes to stay restrictive and beginning to communicate how it plans to sequence the eventual loosening of policy.

*There is an increasing disconnect between where P/E ratios are and where real rates have risen too

*Stocks were certainly following a no-recession price path before this recent pullback
In the end, markets got “too long risk too quickly” as the “soft landing” scenario became the modal case, causing equity position to go from underweight to more neutral to outright long over the first half of the year. The improved breadth, reduced volatility, and more normal cross-asset correlations allowed greater participation in the rally, with CTAs, vol-controlled, and risk parity funds buying into the rising prices and falling VIX. In actuality, the soft-landing scenario is still highly uncertain simply from the standpoint that we have an increasing amount of headwinds hitting in the second half of this year, as we discussed last week, and no relatable historical period to compare the current rapid level of Fed, let alone cumulative global central bank policy tightening too. In its simplest form, equities might be indicating a soft landing scenario is likely, with 11% earnings growth expected over the next year and a little under a 20 P/E level for the S&P. But inverted yield curves and leading economic indicators indicate another less rosy scenario. This leaves us remaining cautionary and uninspired to increase risk (in our mock portfolio) until we have further clarity on the economy and how that will affect policy decisions in 2024. We don’t expect this clarity anytime soon, likely getting the opposite, with headline inflation picking up, labor market readings moving sideways, and harder data cooling over the next two months, making the Fed’s job of interpreting economic conditions harder and increasing the chances of a policy error as communication becomes more challenging.

*The Conference Boards Leading Economic Indicator has never seen this many months of declines without a recession following

*Small businesses are increasingly reporting falling sales and profits. Will they continue to hire more labor?
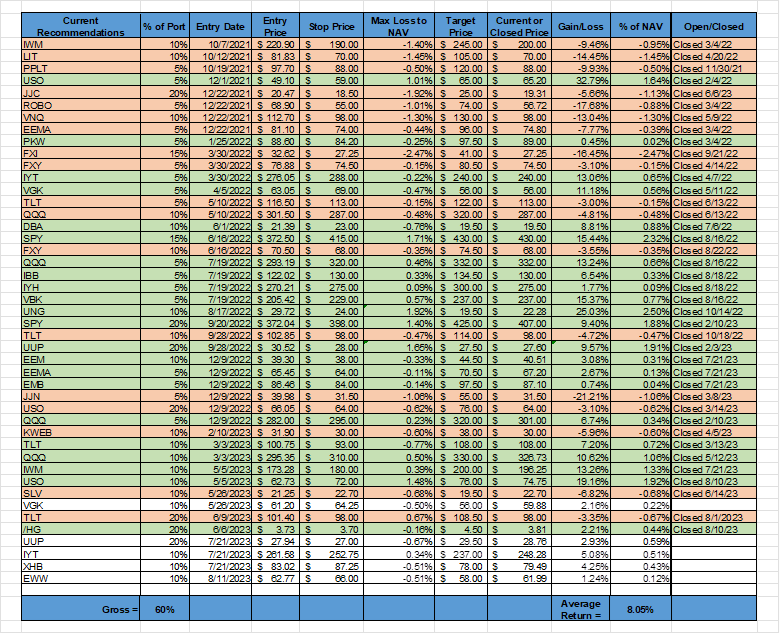
As promised, we wanted to discuss quickly our short transport sector position, expressed through the iShares $IYT ETF, is based on a view that the global trade landscape is worsening as the overall economic backdrop weakens. When we implemented the trade a month ago, we also believed that the stocks would “correct” into a seasonally weaker part of the year from overbought and richly valued levels, and transport stocks would be a leading higher beta expression of that view. So far, this has been correct, and the position has gains of over 5%. However, we still see cyclical headwinds from tighter policy or failing economic reopenings, as is the case with China, to pressure freight rates further. This view has been emboldened by recent weaker trade data and more negatively skewed outlooks from logistic firms in their Q2 earning calls. Manufacturing PMIs also indicate it could be a while before demand for goods picks up meaningfully despite the U.S. soft landing outlook becoming the modal view. As a result, shipping and trucking firms remain cautious, with volumes expected to remain depressed for at least the rest of 2023.
"We are in a freight recession. While the environment remains uncertain and demand for capacity is still muted, we remain very focused on how we grow with our customers, and we will continue to remain disciplined in our approach. - J B Hunt Transport Services Chief Commercial Officer Shelley Simpson
“There is a freight recession, and all of us exposed to the freight market faced the same headwind. And that problem is compounded by the fact that our funding costs are going up” - Triumph Financial CFO William Bradley Voss
"So let me take the peak season and the question what do we hear from our customers? And unfortunately, for us, there will be no real peak season. There is no peak season to be expected in 2023. So there are no signals either on air or sea, at least not for the time being, so we have to be very cautious on that, and that was reflected as well in Markus' comment on our cost efficiency and the focus on our cost position." - Kuehne + Nagel International CEO Stefan Paul
“In Logistics & Services, the impact of this normalization process was felt stronger than we had anticipated, resulting in growth below our expectations and higher costs; a transitionary situation we are in the process of correcting. While the first half year has developed essentially in line with our expectations, we do not see any sign of an expected volume rebound in the second part of the year. We are, therefore, reducing our full-year outlook for global container volume" - A.P. Møller - Mærsk CEO Vincent Clerc
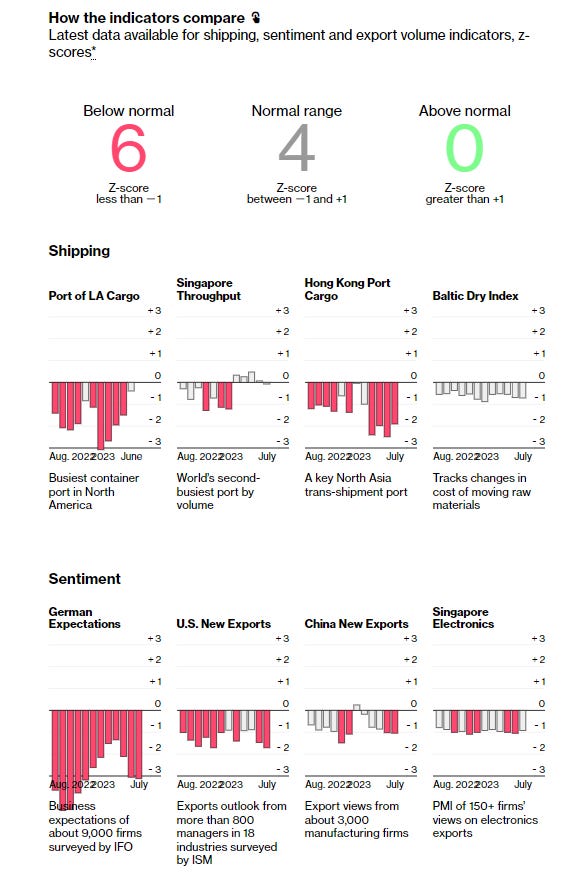
*Bloomberg’s selected measures of shipping, sentiment, and export volumes (not seen) indicate a recession-like environment
In summary, with container and trucking rates having already fallen considerably over the last year, there has been a rolling global freight recession due to demand for goods falling after pandemic excesses. The slump has been moving across the globe, starting in Europe, moving to Asia, and now more directly occurring in the U.S. Although recent earnings results this week from the likes of Target and Walmart showed a “resilient” consumer is still somewhat forecasted, U.S. retailers are taking a more cautious approach to inventory builds as the strength of sales this coming holiday season is more uncertain. Margin pressures are also worsening even as inflation is perceived to be falling, given wages are still rising, borrowing costs punitive, and energy prices firmer, as seen in recent rises in global gas and diesel costs. Reduced urgency in demand means that these costs can not be as easily passed off to end consumers as was the case earlier in the cycle. Overall, we maintain a strong conviction that the transport sector is likely to trend lower, and as a result, we moved lower our target price and stop level, locking in a 3.4% gain after reaching our initial target gain of 6% at this mornings open.

*Shipment volumes moved lower in July, with the recent shipment reading of 1.122, down 8.9% annually and 2.2% compared to June.

*The Cass Freight Index often leads Trucking and air cargo pricing trends, indicating that logistics demand is falling broadly
*We plan to discuss our short MSCI Mexico position next week, but in general, we are using it as a higher beta play on EM weakness due to slower global growth, a stronger dollar, and carry trade-specific dynamics that may hurt the peso if unwinded. Otherwise, our short equity basket and long dollar positions benefit from the current risk-off tone that hit markets this week.
Please share our newsletter, and feel free to reach out with any questions or comments.
Thank you for reading! - Mike Ball
Policy Talk:
The Board of Governors released the July FOMC Minutes this week, with the main takeaway being there is a generally high degree of uncertainty regarding the lagged cumulative effects on the economy from the tightening cycle to date. As a result, recent resilience in the economy continued to skew upside risk to inflation. However, in discussing downside risks, uncertainty over the tightening of bank credit conditions in combination with the cumulative effects of policy tightening could lead to a sharper economic slowdown than expected. Participants noted a more stable financial backdrop didn’t necessarily reduce the risks banks faced due to nonsticky deposit-based funding and potential losses in asset holdings, especially in CRE. As a result, in considering appropriate policy actions, the committee saw the stronger-than-expected economic growth over the intermeeting period and still “very tight labor market” creating a greater tailwind for still “unacceptably high” inflation than any headwinds from uncertain effects of tighter credit conditions. As a result, it was unanimously decided by the voting committee member to raise rates by 25 bps to a 5.25% to 5.5% Fed funds target range. A few committee participants did note they favored not raising rates. All participants agreed to keep reducing the size of the balance sheet. In a notable shift, the committee noted the uncertainty about the economic outlook remained elevated and future policy decisions would depend on the “totality of the incoming data” and its implications for growth and inflation outlooks. The bottom line is that the Fed still needs to see a looser labor market and a period of below-trend growth to be confident inflation will reach and stay near the 2% target. The focus on the “totality” of the data means that a November rate hike is still very much in the cards.

A review of financial markets indicated the Fed believed the market-implied increase in the terminal fed funds rate was due to a perceived stronger economic backdrop, while the June CPI was interpreted as “softer than anticipated.” Risk assets continued to perform well over the inter-meeting period, with concerns regarding financial stability easing and market-derived measures of inflation little changed. The Survey of Primary Dealers still indicated high expectations for a recession to materialize in 2024, but the start date was again pushed forward. The SOMA manager updated the committee on declines in the RRP due to the resumed issuance of T-bills post debt ceiling suspension, with expectations for higher bank reserves by year-end and lower ON RRP balance.

In reviewing the economy, the staff saw GDP rising at a “moderate pace” over the first half of the year, while the labor market remained tight “though imbalances were slowly diminishing.” Consumer price inflation was seen as easing while measures of short-term inflation expectations moved down, but both still remained “elevated.” The staff saw private domestic demand decelerating in Q2 while manufacturing output rose due to increases in auto production. Indicators abroad showed a cooling in foreign growth and inflation.

The staff reported that domestic financial conditions remained stable. Credit markets borrowing costs were little changed over the intermeeting period, and funding abilities were stable, although credit availability “appeared to tighten somewhat in recent months,” as seen in the July SLOOS report. The staff’s research highlighted that credit in the mortgage market remained “broadly available,” with only a “moderate net percentage” of banks reporting a tightening of credit standards coming in the second half of the year regarding residential lending. Overall, “conditions remained generally accommodative in the consumer credit market with credit available for most borrowers.” The staff provided an assessment of the system's financial stability and “on balance, characterized the financial vulnerabilities of the system as notable.” This was due to residential and commercial property prices still being elevated “relative to fundamentals,” however, the staff saw the overall level of leverage in the system as moderate.

The staff’s new economic outlook was stronger than June’s as financial stress worries fell while spending and real activity were stronger than expected, causing the staff to no longer expect a mild recession towards the end of the year. However, growth in 2024 and 2025 was still expected to be below potential. Inflation expectations were little changed. However, the risks were more skewed to upside surprise “given the possibility that inflation dynamics would prove more persistent than expected.” As a result, the potential need for further policy tightening represented a downside risk to growth projections.

In discussing current conditions and outlook, the committee agreed that the effects of tighter credit conditions remained uncertain, as were the lag effects from cumulative tightening of policy to date, given the resilience of the economy and jobs market. However, despite the uncertainty, “participants continued to view a period of below-trend growth in real GDP and some softening in labor market conditions as needed to bring aggregate supply and aggregate demand into better balance and reduce inflation pressures sufficiently.” Expectations were for a slower growth period in consumption to start due to tighter policy and other factors. The committee also highlighted improvements in supply chains as supporting business cost structures but still expected lower levels of investment and hiring over the coming quarters. Labor market dynamics were expected to loosen further, with indicators supporting reduced demand while the supply of workers continued to improve. Finally, participants cited “a number of tentative signs that inflation pressures could be abating,” however, several members noted that core service inflation had yet to show any meaningful disinflationary pressure.

The NY Fed’s Survey of Consumer Expectations showed consumer inflation expectations for the year ahead fell to 3.5% in July, a fresh low since April of 2021, from 3.8% in June. Consumers also see slightly lower inflation in three years (2.9% vs. 3%) and in five years (2.9% vs. 3%).
Year-ahead price growth expectations declined for gas (-0.2 percentage point to 4.5%), food (-0.1 percentage point to 5.2%, the lowest since September 2020), medical care (-0.9 percentage point to 8.4%, the lowest since November 2020), college education (-0.3 percentage point to 8.0%) and rent (-0.4 percentage point to 9%, the lowest since January 2021). Median home price growth expectations decreased to 2.8% in July from 2.9% in June. Inflation uncertainty declined at the one-year horizon.
One-year-ahead earnings growth expectations decreased to 2.8%, remaining in a tight multi-year range. Overall, unemployment rate level expectations decreased while the perceived probability of losing one own job in the next year also decreased. However, the probability of leaving one’s job also fell, hitting the lowest level since March 2021, while the probability of finding a job rose slightly in July.
Expected growth in the year ahead in household incomes remained unchanged at 3.2%, while spending growth expectations increased to 5.4% in July but remained well below its annual average of 6.1%. Perceptions of credit access remained unchanged, with future views improving verse a worsening in current perceptions. Perceptions regarding current and future financial situations improved while expectations of missing a debt payment in the next three months decreased.

*One-year-ahead inflation expectations continue to trend lower, with uncertainty also falling in July

*Spending expectations ticked slightly higher after trending lower since peaking last year while income growth expectations remain at the top of a longer-term channel
The Atlanta Fed’s Business Inflation Expectations Index for one year ahead significantly decreased to 2.5%, on average. When summarizing the current economic environment, respondents noted that sales levels "compared to normal" increased. However, profit margins "compared to normal" decreased, despite average year-over-year unit cost growth remaining relatively unchanged at 3.3%. The quarterly questions showed that 78% of firms expect labor and nonlabor costs to influence prices more in the next year, while about 50% of firms expect sales levels to exert little or no influence on prices over the next 12 months. Finally, 53% of firms expect margin adjustment to have little or no influence on prices over the next 12 months. In a special question, firms were asked about the impact of interest rate increases on their businesses' capital expenditure and labor decisions. More firms saw higher rates as impacting capital expenditures, with 43% saying they have stopped or decreased Capex due to rate levels, while 42% saw no impact on hiring decisions. However, 45% of firms responded they are slowing their hiring rate.

*The Atlanta Fed BIE index continues to trend methodically lower, now at 2.5%

*Interest rate increases are more likely to impact capex decisions verse headcount ones
The SF Fed posted a recent article titled “How Far Is Labor Force Participation from Its Trend?” on their FRBSF Economic Letter blog discussing why the labor force participation rate is still a percentage point below its pre-pandemic level. The research concluded that two-thirds of the decline in the labor force participation (LFP) rate is due to structural changes in the labor force, while the remaining amount is due to “cyclical” factors. The structural changes were due to changes in the population, specifically the aging of it, with lower participation at a given age than was typical before the pandemic. This was especially true for people over the age of 55. The results are consistent with the view that retirement has been an important driver of LFP declines since the pandemic, the so-called COVID retirement boom. The SF researchers estimate that aggregate trend LFP will decline approximately one additional percentage point over the next decade, driven primarily by population aging.

*“We find that LFP was above trend as of 2022, reflecting the cyclical influences of the tight labor market. However, going forward, our estimates project that trend forces, primarily reflecting demographic changes such as population aging, will continue to exert downward pressure on the LFP rate.” – SF Fed
The SF Fed’s Blog posted an article titled “Excess No More? Dwindling Pandemic Savings,” where researchers' estimated that households held less than $190 billion of aggregate excess savings in June. They also surmised that, although there is considerable uncertainty in the outlook, they expect these excess savings to be depleted during the third quarter of 2023. Estimates of aggregate excess savings are filled with uncertainty because they are highly sensitive to the methodology used and the assumptions made about the pre-pandemic trend. As a result, various research has shown rather different results, with some showing a much smaller share of excess savings having been spent so far. Views also vary on the effects excess savings will have on driving spending growth going forward, and there is additional uncertainty over how excess savings is dispersed along the income distribution.

*Accumulated excess savings, in nominal terms, totaled around $2.1 trillion by August 2021, when it peaked
Researchers at the Boston Fed released a paper titled “What Is Driving Inflation—Besides the Usual Culprits?” where they looked at what sectors have been driving super core inflation, as the current pulse of inflation strength has been increasingly outside of food and energy recently. They found that prices of services associated with low-skill workers have been a key driver of “supercore” inflation. They concluded that low-skill-services inflation seems to be tied to faster wage growth in those industries coming out of the COVID-19 pandemic. Looking forward, the researcher surmised that “wage growth in low-skill services has begun to decline, suggesting that there may be lower inflation in these industries in the future. At the same time, wage growth in high-skill services has recently accelerated, suggesting that there may be higher inflation in these industries in the near future.”

*As the economy reopened during the COVID-19 pandemic, low-skill-services inflation spiked, while there has been no corresponding movement in high-skill-services inflation
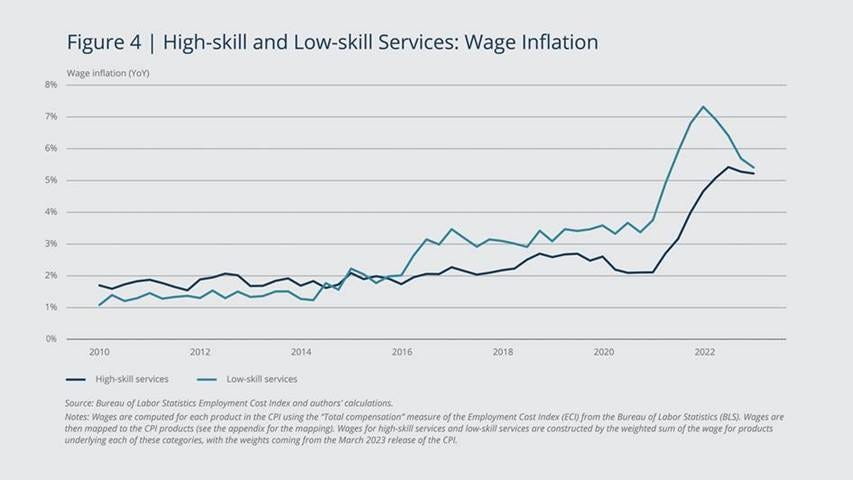
*“If wage inflation has a delayed impact on price inflation, and wage inflation for low-skill services has recently fallen, then price inflation for low-skill services is likely to fall in the near future.” – Boston Fed
U.S. Economic Data:
Retail sales rose by 0.7% in July, following an upwardly revised 0.3% increase in June and beating market forecasts of a 0.4% MoM increase. Sales at nonstore retailers (1.9% MoM vs. 1.5% MoM in June) recorded the most significant increase on the month, helped by Amazon’s Prime Day. On a percentage basis, this was followed by sporting goods, hobbies, musical instruments, and books (1.5% MoM vs. -0.5% MoM), food services and drinking places (1.4% MoM vs. 0.8% MoM), clothing (1% MoM vs. 0% MoM), food and beverages stores (0.8% MoM vs. -0.4% MoM), and general merchandise stores (0.8% MoM vs. 0% MoM). Even with higher gas prices, gasoline stations (0.4% MoM vs. -1.3% MoM) only marginally recovered declines seen in June. On the other hand, sales fell at furniture stores (-1.8% MoM vs. 1.4% MoM), electronics and appliances (-1.3% MoM vs. 0.7% MoM), motor vehicles and part dealers (-0.3% vs. 0.7% MoM) and miscellaneous store retailers (-0.3% MoM vs. 1.4% MoM). Core retail sales, which exclude autos, gas, building materials, and food services, rose by 1% MoM, following an upwardly revised 0.6% MoM gain in June.
Why it Matters: A broadly better-than-expected July retail sales report indicates that consumer resilience is alive and well. In addition, sales for May and June were, on balance, revised higher (an upward revision to May more than offset a small downward revision to June). There was some bifurcation with both e-commerce sales and eating and drinking establishments jumping, indicating that online shopping is up for a fourth month while the consumer also continues to dine out. Two additional points worth highlighting. As inflation falls, retail sales will see reduced gains, all else equal. However, the trend in both total and core real retail sales is still positive. Second, there may be some seasonal factors at play supporting the better-than-expected gains in July. This is seen best when compared to the private sector Redbook retail sales index, which continues to move lower.

*Actual gains in retail sales were much stronger than expected, with the core (control) group, especially strong

*Amazon Prime Day likely drove the outperfromance in nonstore retailers, but outside of “home related” categories, there was a broad strengthening of the data

*The consumer looks to be more balanced, returning to a more pre-pandemic mix of consumption
Import prices increased by 0.4% in July, following a downwardly revised -0.1% drop in June and beating market expectations of a 0.2% MoM increase. This moved the annual rate to -4.4% from -6.1% in June. The cost of imported fuels rose by 3.6% MoM, as petroleum prices increased by 3.5% MoM, and natural gas prices rose 12.1% MoM, the first increase for nat gas since January 2023. Nonfuel import prices were unchanged in July, following a decrease of -0.3% MoM in June. The cost of foods, feeds, and beverages rose by 2.5% MoM due to positive contributions from fruits, vegetables, and meats. Prices also picked up for autos and capital goods. On the other hand, prices of nonfuel industrial supplies and materials decreased by -1.4% MoM, while the prices of consumer goods slid by -0.1% MoM. Export prices increased by 0.7% in July, following a downwardly revised decrease of -0.7% MoM in June and more than market expectations of a 0.2% MoM rise. On an annual basis, export prices moved to -7.9% from a -11.9% decline in June. Prices for agricultural exports rose by 0.9% MoM due to higher prices for soybeans, meat, and wheat, offsetting lower prices for corn, fruit, and nuts. Nonagricultural costs increased by 0.6% MoM, the most substantial one-month advance since June 2022. Higher prices were seen for nonagricultural industrial supplies & materials, capital goods, and automotive vehicles that more than offset lower prices for consumer goods and nonagricultural foods.
Why it Matters: Energy, followed by food cost increases, drove import price increases, given there was no change outside those two categories, while export price increases were more mixed. There was a notable gain in imported fruits, vegetables, and meat prices, which may re-pressure food-at-home readings in the CPI report. The July advance in the fuel import index was the largest rise since the index advanced 68.4 percent in December 2022. Given the weight of energy in the readings of this report, it makes sense that we are now seeing a reversal of the deflationary trend in both imports and exports that dominated for the first half of this year.

*Import prices rose 0.4% in July, moving the annual rate higher for the first time since last December

*Export prices rose 0.7% in July, with agricultural export prices rising 0.9% MoM while everything else rose by a still high 0.6% MoM
Housing starts increased by 3.9% MoM to a seasonally adjusted annualized rate of 1.452 million in July, above market expectations of 1.448 million. Data for June was also revised lower to 1.398 million from 1.434 million. Single-family housing starts climbed by 6.7% to 983K, while multi-unit starts were unchanged at 460K. Starts increased in the Northeast (1% MoM), Midwest (9.9% MoM), and West (14% MoM) but fell in the South (-1.3% to 789 MoM). Building permits rose slightly by 0.1% MoM to a seasonally adjusted annual rate of 1.442 million in July, lower than market estimates of 1.463 million permits. Single-family permit authorizations increased by 0.6% MoM to 930K, the highest in over one year. This offset the decrease in 2-4 multi-unit authorizations, which fell by -0.2% MoM to 464K, and the decline in buildings with 2-4 units, which fell by -7.7% MoM to 48K. Permits grew in the Northeast, South, and West regions, while they contracted in the Midwest. On an annual basis, national permits fell by 13%.
Why it Matters: Total housing starts in July were close to expectations; however, starts in May and June were revised down. The increase in single-unit verse multi-unit starts signals the continued trend of low inventory in single, reversing the 2022 trend, where single starts fell dramatically as demand suffocated under worsening affordability. In contrast, multi-unit was more stable due to rental prospects holding steady. Of course, there are still more multifamily units under construction currently than at any other time in history. With that all said, it is still notable that there was an uptick that large in single-family starts when all eyes are on the housing market and the general stronger-than-expected Q3 GDP projection by the Atlanta Fed GDPNow, increasingly supported by the residential investment side. "The need for new single-family homes, which is driven by scarce existing home inventory, should keep a floor under single-family construction," said Nancy Vanden Houten, U.S. lead economist at Oxford Economics in New York. "Homebuilders increased their use of incentives again in August, which may support sales and prevent a steep fall in single-family starts."

*Housing starts are still on the historically higher side of their seasonal range, while building permits are normalizing

*Single-family starts continue to benefit from the low existing homes inventory story

*Multi-unit construction projections continue to grow despite a weaker month of starts
The NAHB Housing Market Index fell to 50 in August from 56 in July and below forecasts of 56. The sub-index for current single-family home sales declined to 57 from 62, while the sub-index for prospective buyers dropped to 34 from 40. Finally, the sub-index for home sales over the next six months decreased by 4 points to 59. The August HMI survey indicated that rising mortgage rates are causing more builders to use sales incentives to attract home buyers. After dropping steadily for four months (from 31% in March to 22% in July), the share of builders cutting prices to bolster sales rose again to 25% in August. The average decline for builders reducing prices remained at 6%. And the share of builders using incentives to bolster sales was 55% in August, higher than in July (52%) but still lower than in December 2022 (62%).
Why it Matters: After steadily rising for seven consecutive months, builder confidence retreated in August, with all three major HMI indices posting declines in August, with the gauge measuring traffic of prospective buyers dropping the most and being well in “poor” territory. “Rising mortgage rates and high construction costs stemming from a dearth of construction workers, a lack of buildable lots, and ongoing shortages of distribution transformers put a chill on builder sentiment in August,” said NAHB Chairman Alicia Huey, a custom home builder and developer from Birmingham, Ala. “But while this latest confidence reading is a reminder that housing affordability is an ongoing challenge, demand for new construction continues to be supported by a lack of resale inventory, as many homeowners elect to stay put because they are locked in at a low mortgage rate,” said NAHB Chief Economist Robert Diet.

*Falling traffic and increased use of incentives shows that all is maybe not as well as the common current housing narrative dictates
Industrial production increased by 1% in July, following a -0.8% MoM decrease in June and above market expectations of a 0.3% MoM rise. June was revised lower to show a -0.8% decline instead of the -0.5% decrease previously reported. Manufacturing output rose by 0.5% MoM, beating expectations of a flat reading, mainly driven higher by a 5.2% MoM increase in the production of motor vehicles and parts. In contrast, factory output elsewhere only increased by 0.1% MoM. Mining output increased by 0.5% MoM, and the output of utilities climbed 5.4% in July, driven by a large increase of 6.7% for electric utilities, as hot weather nationally in July raised demand for ACs. Capacity utilization went up to 79.3% in July, a rate that is 0.4 percentage points below its long-run average.
Why it Matters: At the headline level, this was the largest one-month increase in industrial production in six months. However, as seen throughout the first half of this year in most manufacturing reports, autos played an outsized role again, and hot weather drove utility usage higher, as would be expected. With that said, most major industrial groups reported growth in July. Besides the gain in energy-related consumer goods and materials as well as autos, consumer nondurables, business equipment, and defense and space equipment all rose by around 1% MoM. Interestingly, construction supplies are down for a third month, lower by -2.7% YoY despite the high level of construction perceived to be occurring across the nation currently.

*Motor vehicle related production played a large part in July's overall gains

*Capacity utilization is below its long-term average and trending slightly lower

*As seen this month, the manufacturing picture is weaker without autos and parts
The Philadelphia Fed Manufacturing Index increased to +12 in August, up from -13.5 in July and better than market forecasts of -10. Demand and activity readings all rose, with New Orders (+16 vs. -15.9 in July) and Shipments (5.7 vs. -12.5) moving back into expansionary territory for the first time since May 2022. Unfilled Orders (-4.8 vs. -15.1) also notably improved but remained slightly contractionary, as did Delivery Times (-7 vs. -12.9). Inventories (-10.2 vs. -1) contracted at a greater rate. Price readings were mixed, with Prices Paid (20.8 vs. 9.5) jumping higher while Prices Received (14.1 vs. 23) moved lower. Labor readings were also mixed with the Number of Employees (-6 vs. -1) contracting while the Average Workweek (6.3 vs. -3) moved from contraction to expansion. Six-month ahead readings were notably more negative, with the overall Future General Business Activity (3.9 vs. 29.1) falling sharply and moving close to neutral due to decreases in demand and activity measures, although they remained expansionary. Future Price expectations increased while labor measures cooled. Expected capex also fell into contractionary territory.
Why it Matters: The headline positive reading is the first one since August 2022 and the strongest since April of the same year. However, the large decline in future expectations negates any positive news in the report. Profit margin pressures were implied by larger increases in prices paid than received in both current and future readings. The special question for the month asked respondents to forecast price changes in their products and for the overall consumer over the next year. Regarding their own prices, the firms’ expected increase of 4%, down from 4.5% when this question was last asked in May. This coincided with an increase of 5% in their own prices over the past year, down from 6% last quarter. Respondents expected the overall rate of inflation to be 4%, down from 5% percent in May. Over the long run, respondents forecast for the 10-year average inflation rate was 3.5%, up slightly from 3.3%.

*Both the current and future general business activity indexes saw directional changes, with the current hitting positive territory for the first time in a while

*Inflationary pressures picked up with both current and expected prices paid measures rising

*Broad expansion in current readings was matched by broad contraction in six-month ahead readings
The NY Empire State Manufacturing Index fell to -19 in August from 1.1 in July, well below market forecasts of -1. Demand and activity measures fell sharply, with New Orders (-19.9 vs. 3 in July) and Shipments (-12.3 vs. 13.4), while Unfilled Orders (-6.8 vs. -8.8) improved slightly but remained contractionary. Delivery Times (1.9 vs. -8.8) moved back into expansionary territory for the first time this year, while Inventories (-9.7 vs. -10.8) contracted at a slightly slower rate. Labor market indicators softened, with the Number of Employees (-1.4 vs. 4.7) falling slightly below neutral while the Average Workweek (-10.7 vs. 0.3) contracted notably. Finally, regarding the current inflation readings, Prices Paid (25.2 vs. 16.7), and Prices Received (12.6 vs. 3.9) increased notably. Looking six months ahead, firms grew more optimistic with General Business Conditions (19.9 vs. 14.3) expanding due to bounces in new orders, unfilled orders, and shipments. Delivery times and inventories also rose. The expected price received contracted while prices paid rose, showing concerns about pricing power by respondent firms moving forward. Further, the future outlook for hiring increased while the expected length of the work week increased. Finally, capex and technology spending readings rose notably from neutral into expansionary territory.
Why it Matters: The broad decline in current demand, activity, and employment readings reversed gains seen in July and continued to show choppy general business conditions reading in the NY region throughout 2023. Increasing delivery times and rising prices paid measures indicated that despite lower demand and shipments, supply-side inflationary pressures are potentially picking up. In contrast, prices received, although expanding at a greater rate in August than in July, did not keep pace, indicating greater pressure on profit margins. As is often the case these days, forward-looking measures did broadly pick up at a substantial level, and outside of prices received are expansionary across all the sub-indexes. The increase in demand, activity, and labor measures were matched by sizeable increases in capex and IT spending intention, indicating a growing confidence in the future outlook. However, as with the current reading, price measures showed reduced expected pricing power in comparison to input cost increases, further highlighting profit margin concerns by respondents.

*New Orders and Shipments showed decreased demand and activity in the August reading, and along with weakening labor readings, drove the headline general business conditions reading lower

*Inflationary pressures and expectations rose notably after both trending lower in the last few months

*Demand and activity expectations six-month ahead materially jumped higher, and coupled with investment readings, shows growing confidence in future business conditions
NY Fed’s Business Leader Survey’s (covering service firms) headline business activity index rose slightly to 0.6 in July from 0 in June. Business Climate (-24.3 vs. -28.1 in June) readings moved slightly higher but remained well in negative territory. Labor readings were stronger in combination, as Wages (38.9 vs. 33.1) rose, while the Number of Employees (5.4 vs. 6) was little changed. Inflation readings firmed, with Prices Paid (56.3 vs. 50.6) rising even further into expansionary territory while Prices Received (24.6 vs. 21.8) moved higher at a lower rate and is less expansionary. Finally, in regard to current readings, Capital Spending (-0.6 vs. 0) remained near neutral. Six-month ahead forward readings skewed positively despite little change in the expected Business Activity (20.7 vs. 22.3) reading. Expected Business Climate (4.2 vs. -7.8) moved back into positive territory while the rest of the sub-index readings remained well in positive/expansionary territory.
Why it Matters: Despite improving current business climate sentiment, the overall business activity reading remained near neutral. Price and wage readings all rose, although again, as seen with the manufacturing survey, profit margins look to be pressured by greater increases in cost measures than prices received. However, unlike the manufacturing survey, this slightly reversed in the future readings. It was also interesting to see current capex plans remain near neutral while future investment plans rose notably further into expansionary territory. Finally, employment activity is still expanding, and that is expected to continue, with both current and future wage readings ticking up after trending lower for most of the year.

*Business Activity remains near neutral mainly due to still negative current views on the business climate

*Inflationary pressures picked up in August’s survey after trending lower since last summer
Technicals, Positioning, and Charts:
S&P optionality strike levels have the Zero-Gamma Level at 4444 while the Call Wall is 4600 and Put Wall is 4350. There were bearish shifts in key levels, including a lower put wall, with 25-30% of total SPX/SPY/QQQ open positions set to expire today. Today’s OPEX is now more put-weighted, and it is unclear whether ITM puts will be rolled lower, adding gamma to lower strikes. Spotgamma believes index vol is underpricing larger moves both in the short and longer time frames with a muted response in implied vol to price drops as the curve is in sharp contango. Put flow is now dominating, with the single-name put-call ratio back at March levels. Bond yields rising seem to be driving this sentiment shift, as there has been no specific headline-driven news.

@spotgamma
S&P technical levels have support at 4370, then 4340, with resistance at 4405, then 4430. Support broke when the S&P moved out of the declining yellow channel, and as a result, the bears gained control over the week. This also occurred as the longer-term March low white uptrend channel was breached, driving the bigger selloff mid-week. Until a resistance clears, bears are fully in control, longs should be small-sized “knife catches,” and shorts should be the priority. When a resistance clears, we will see a violent, probably multi-day short squeeze. As it stands, the strongest support level is around the 4340 area, which we did not hit yet.

@AdamMancini4
Treasuries are higher on the day, with the 10yr yield lower by 2bps to 4.25%, while the 5s30s curve steepened on the session by 2 bps, moving to 0.1 bps.

Four Key Macro House Charts:

Growth/Value Ratio: Value is higher on the day and the week, with Large-Cap Value the best-performing size/factor on the week.

Chinese Iron Ore Future Price: Iron Ore futures are higher on the day and the week.

5yr-30yr Treasury Spread: The curve is steeper on the day and the week.

EUR/JPY FX Cross: The Yen is stronger on the day and the week.
Other Charts:

Goldman updated their S&P EPS estimates with expectations for a $224 level for 2023 and expectation for the S&P to end the year at 4500

The one-month implied correlation between S&P 500 constituents is rising from its lowest level since 2017. This typically occurs during periods of market stress.

“55% of all $SPX options volume is now 0DTE 🤯” - @Mayhem4Markets

Dollar bears are once more facing a surprising surge in the currency, as even the apparent imminence of an end to the Federal Reserve’s tightening cycle fails to bring it down in a sustainable manner. Indeed, concerns that the Fed could perhaps raise rates again — and that either way it will keep them higher for longer than expected — are the most obvious immediate spur for recent dollar strength. - @GarfieldR1966

“US air travel (TSA total traveler throughput in million passengers a day) 7-day average 0.9% above 2019 level #OOTT” - @staunovo

Margins in the retail and wholesale trade sector remain healthy, and this industry contributes about 10% of value added to GDP, according to the BEA.

Used car prices have risen 35% since the pandemic, and inputs into home-building have risen 40%. Those increases in insurers’ repair & replacement costs have not yet fully made their way into insurance premiums, partly because premium increases often need to be approved by regulators, and that process takes time. - @juliaonjobs


Total worth of U.S. homes hit record $46.8 trillion in June, above prior all-time high of $46.6 trillion a year ago … number of homes for sale in U.S. dropped by 15% year/year to an all-time low in June (biggest annual decline in nearly 2 years) per - @Redfin

The increase in the Federal deficit, from 3.9% to 7.0%, is mostly *not* about spending. It’s discomforting that many investors see a bigger deficit as part of the bullish narrative. #macro - @MichaelKantro

'When there is no safe haven, market corrections will not follow predictable patterns. Historically, when stock prices have plunged, investors have sought out US treasuries. But what if government securities are viewed as risky?' - @AswathDamodaran

“Nearshoring, or moving production closer to the end consumer, is now a bigger priority as many executives try to be more prepared for the unexpected as geopolitical tensions rise” - McKinsey's annual survey of supply chain leaders
Articles by Macro Themes:
Medium-term Themes:
China’s Post-Pandemic Life:
Black Box: Chinese officials said they would stop reporting the country’s youth unemployment rate after months of spiraling increases, depriving investors, economists, and businesses of another key data point on the declining health of the world’s second-largest economy. The surprise move extends China’s efforts to restrict access to a variety of data on its economy and corporate landscape to outside scrutiny. At the same time, China’s central bank unexpectedly cut a range of key interest rates, an emergency move to reignite growth after new data showed the economy slid deeper into distress last month. The twin moves on Tuesday by the National Bureau of Statistics, and the People’s Bank of China came as a batch of new data showed spending growth by consumers and businesses slowed last month while factory output grew much less than expected, adding to a recent raft of worrying signals. - China Slashes Rates, Suspends Youth Jobless Data as Economy Signals Sharper Downturn – WSJ

Trending Down: Chinese banks extended the smallest amount of monthly loans since 2009 in July, a further sign of weak demand in the world’s second-largest economy that raises the risk of prolonged deflation pressure. New loans reached 345.9 billion yuan in July, less than half the 780 billion yuan economists had forecasted. Aggregate financing, a broad measure of credit, was also well below estimates. Household mid- and long-term loans, a proxy for mortgages, also contracted in July, a sign that households continued to make early pre-payment of mortgages. Medium and long-term loans to companies also plunged in July from the previous month. The year-on-year growth rate of broad M2 money supply slowed sharply to 10.7%, while growth in the stock of credit grew 8.9%, the slowest pace in data going back to 2017. “China’s much lower-than-expected credit growth in July sends a clear signal that the rate cut in June by the People’s Bank of China was not enough to boost sentiment in the economy. Credit demand by private enterprises and households turned sluggish after a short-lived jump in June as weak confidence continued to hinder investment and home purchases,” said David Qu, China economist. - China Loans Plunge to 14-Year Low, Adding to Deflation Risk - Bloomberg

Finding the Hidden: China will allow provincial-level governments to raise about 1 trillion yuan ($139 billion) via bond sales to repay the debt of local-government financing vehicles and other off-balance sheet issuers, a small step toward addressing one of the biggest threats to the nation’s economy and financial stability. The Ministry of Finance has informed relevant authorities about the “refinancing bonds” program, with quotas set for each region. All provincial-level governments but Beijing, Shanghai, Guangdong, and Tibet can use the bonds to repay off-balance sheet liabilities, known as “hidden” debt in China. Authorities also identified 12 provinces and cities as “high-risk” areas where more support will be provided, including the provinces of Guizhou, Hunan, Jilin, and Anhui, as well as Tianjin city. The program will, in effect, bail out weaker issuers, including LGFVs, shifting the debt burden to provincial governments instead. - China to Shift $139 Billion of ‘Hidden’ Local Debt to Provinces - Bloomberg

Hits Keep Coming: One of China’s biggest shadow banks skipped payments on several investment products, sparking rare protests in Beijing as the fallout from a deepening property slump spreads to the financial sector. Zhongrong International Trust missed payments on dozens of products and has no immediate plan to make clients whole, indicating troubles at the embattled Chinese shadow bank are deeper than previously known. Pressure is building across China’s financial markets, given a slew of disappointing economic data, renewed concerns about the property sector, and the unfolding crisis in the shadow banking system. Investors are calling for more aggressive easing by Beijing as the incremental policies have so far failed to revive confidence. - China Shadow Bank Misses Dozens of Payments, Sparking Protests - Bloomberg

Longer-term Themes:
Cyber Life and Digital Rights:
Deep Network: New York Times investigation found a group called No Cold War were behind a recent attack on activists supporting the democracy movement in Hong Kong in London’s Chinatown. On the surface, No Cold War is a loose collective run mostly by American and British activists who say the West’s rhetoric against China has distracted from issues like climate change and racial injustice. However, it was found to be part of a lavishly funded influence campaign that defends China and pushes its propaganda. At the center is a charismatic American millionaire, Neville Roy Singham, who is known as a socialist benefactor of far-left causes. What is less known, and is hidden amid a tangle of nonprofit groups and shell companies, is that Mr. Singham works closely with the Chinese government media machine and is financing its propaganda worldwide. From a think tank in Massachusetts to an event space in Manhattan, from a political party in South Africa to news organizations in India and Brazil, The Times tracked hundreds of millions of dollars to groups linked to Mr. Singham that mix progressive advocacy with Chinese government talking points. - A Global Web of Chinese Propaganda Leads to a U.S. Tech Mogul - NYT

A.I. All Day:
Too Far: Zoom, the company that normalized attending business meetings in your pajama pants, was forced to unmute itself this week to reassure users that it would not use personal data to train artificial intelligence without their consent. A keen-eyed Hacker News user last week noticed that an update to Zoom’s terms and conditions in March appeared to essentially give the company free rein to slurp up voice, video, and other data, and shovel it into machine learning systems. The new terms stated that customers “consent to Zoom’s access, use, collection, creation, modification, distribution, processing, sharing, maintenance, and storage of Service Generated Data” for purposes including “machine learning or artificial intelligence.” The discovery prompted critical news articles and angry posts across social media. Soon, Zoom backtracked. Soon, Zoom backtracked. On Monday, Zoom’s chief product officer, Smita Hasham, wrote a blog post stating, “We will not use audio, video, or chat customer content to train our artificial intelligence models without your consent.” The company also updated its terms to say the same. - Generative AI Is Making Companies Even More Thirsty for Your Data - Wired

Energy’s Midlife Crisis:
Flying on Weeds: Most biofuels in the U.S. currently come from corn or soybeans. But as demand for green fuels rises, global food shortages are also threatening. That’s bringing a push for low-carbon fuels that can be made without using edible grains and spurring research on crops like field pennycress. Field pennycress, a plant in the Brassica family related to mustards and cabbages, is usually considered a weed. But one feature made it less of a wallflower: its very high oil content, about 50% higher than that of soybean. The plant, now dubbed CoverCress, is aimed for cultivation on farms in harvest offseasons as a so-called cover crop that can help prevent erosion and provide revenue when primary crops are fallow. Growing these oilseed plants between main crop rotations on land already used for farming helps limit damage like deforestation. - What Was Once a Weed Could Fuel Jet Engines – WSJ

Cheapest Growth: Across the country, a profound shift is taking place that is nearly invisible to most Americans. The nation that burned coal, oil, and gas for more than a century to become the richest economy on the planet, as well as historically the most polluting, is rapidly shifting away from fossil fuels. A similar energy transition is already well underway in Europe and elsewhere. But the United States is catching up, and globally, change is happening at a pace that is surprising even the experts who track it closely. Wind and solar power are breaking records, and renewables are now expected to overtake coal by 2025 as the world’s largest source of electricity. Today, solar and wind power are the least expensive new sources of electricity in many markets, generating 12 percent of global electricity and rising. This year, for the first time, global investors are expected to pour more money into solar power, some $380 billion, than into drilling for oil. - The Clean Energy Future Is Arriving Faster Than You Think – NYT

Food: Security, Innovations, and Climate Change Implications:
Ants and Grasshoppers: Across the country, authorities have reclaimed more than 170K hectares of farmland since 2021 as Beijing tries to reduce its reliance on imported food amid fears confrontation between China and the US could disrupt global supply chains. In a speech last year, China’s President Xi Jinping said authorities must take “hard measures that grow teeth” to maintain 120mn hectares of cultivated land across the country, the level widely seen by Beijing as necessary to secure self-sufficiency. “China must be able to feed its people on our own,” said Xi. “We will fall under others’ control if we can’t hold our rice bowl steady.” Given rising geopolitical tensions, “China is preparing for the worst-case scenario in which it couldn’t buy any food from abroad,” said Yu Xiaohua, an agricultural economics professor at the University of Göttingen. “The authority is counting on the reclamation drive to improve the country’s grain self-sufficiency.” - China expands farmland in bid to cut foreign food reliance - FT

Low Wheat Stocks: India is in talks with Russia to import wheat at a discount to global prices in a rare move to boost supplies and curb food inflation ahead of state and national elections next year. The imports would allow New Delhi to intervene more effectively in the market to drive down wheat prices that stoked inflation to a 15-month high in July. "The government is exploring the possibility of imports through private trade and government-to-government deals. The decision will be made cautiously," an unspecified source told Reuters. Russia has indicated its willingness to offer a discount on prevailing market prices, and there are no restrictions on the export of food commodities from Russia. India has not imported wheat through diplomatic deals in years. India is also importing sunflower oil from Russia and settling payments in U.S. dollars and is planning to use the same approach. - India considers wheat imports from Russia at a discount to calm prices – Successful Farming

Other Articles of Interest:
Nothing to See: China’s abrupt decision to pause releasing data on its soaring youth jobless rate this week was the latest sign the Asian giant is increasingly restricting sensitive information, especially when it’s unflattering to the nation’s faltering economy. Elsewhere, data showing the amount of land developers bought, and the price they paid have been missing from the monthly release. Another curious, potentially manipulated data point is the amount of money the government holds in official foreign exchange assets, which has held remarkably steady since 2017. That’s despite China running an increasingly large trade surplus over that period, which should have led to an increase in reserves. Even some data from the private sector has become unavailable. In March, the bond market was plunged into chaos after fixed-income brokers stopped supplying aggregated bond quotes to data vendors long relied on by traders. Finally, we still have no idea how many Chinese died of Covid after the reopening. Cremations in one of China’s most-populous provinces surged by 72.7% year-on-year in the first quarter, Chinese financial media outlet Caixin reported in July, citing official data released by Zhejiang province. That gave a rare insight into the scale of mortality after the government’s sudden relaxation of coronavirus restrictions in December, in which official data said only 60K people died. - China Is Hiding More and More Data From the Rest of the World - Bloomberg

Second Trillion is Harder: As of August 9, the Fed’s portfolio had shrunk by $0.98tn since the portfolio’s peak of $8.55tn in May last year, and analysis of weekly data suggests it is on track to pass $1tn before the end of the month. “The second trillion worth of balance sheet reduction is likely to have more of an impact,” said Jay Barry, co-head of US rates strategy at JPMorgan. “The first trillion occurred against the backdrop of the federal funds rate moving rapidly higher, and the second trillion matters more because it’s coming against the backdrop of a quicker increase in the pace of Treasury supply.” The Fed aims to cut another $1.5tn from its balance sheet by mid-2025, just as the US government is dramatically increasing the amount of debt it issues, and as demand from foreign investors wanes. Manmohan Singh, a senior economist at the IMF, said a further $1tn of QT would be equivalent to lifting the federal funds rate by another 0.15 to 0.25 percentage points. - Investors brace for turbulence as Fed balance sheet shrinks by $1tn - FT
 showing The Fed has been shrinking its balance sheet")
VIEWS EXPRESSED IN "CONTENT" ON THIS WEBSITE OR POSTED IN SOCIAL MEDIA AND OTHER PLATFORMS (COLLECTIVELY, "CONTENT DISTRIBUTION OUTLETS") ARE MY OWN. THE POSTS ARE NOT DIRECTED TO ANY INVESTORS OR POTENTIAL INVESTORS, AND DO NOT CONSTITUTE AN OFFER TO SELL -- OR A SOLICITATION OF AN OFFER TO BUY -- ANY SECURITIES, AND MAY NOT BE USED OR RELIED UPON IN EVALUATING THE MERITS OF ANY INVESTMENT.
THE CONTENT SHOULD NOT BE CONSTRUED AS OR RELIED UPON IN ANY MANNER AS INVESTMENT, LEGAL, TAX, OR OTHER ADVICE. YOU SHOULD CONSULT YOUR OWN ADVISERS AS TO LEGAL, BUSINESS, TAX, AND OTHER RELATED MATTERS CONCERNING ANY INVESTMENT. ANY PROJECTIONS, ESTIMATES, FORECASTS, TARGETS, PROSPECTS AND/OR OPINIONS EXPRESSED IN THESE MATERIALS ARE SUBJECT TO CHANGE WITHOUT NOTICE AND MAY DIFFER OR BE CONTRARY TO OPINIONS EXPRESSED BY OTHERS. ANY CHARTS PROVIDED HERE ARE FOR INFORMATIONAL PURPOSES ONLY, AND SHOULD NOT BE RELIED UPON WHEN MAKING ANY INVESTMENT DECISION. CERTAIN INFORMATION CONTAINED IN HERE HAS BEEN OBTAINED FROM THIRD-PARTY SOURCES. WHILE TAKEN FROM SOURCES BELIEVED TO BE RELIABLE, I HAVE NOT INDEPENDENTLY VERIFIED SUCH INFORMATION AND MAKES NO REPRESENTATIONS ABOUT THE ENDURING ACCURACY OF THE INFORMATION