


Falling Inflation Divides Doves and Hawks Further As Rally Stalls and Yields Rise – Midday Macro – 8/11/2023
Color on Markets, Economy, Policy, and Geopolitics

Falling Inflation Divides Doves and Hawks Further As Rally Stalls and Yields Rise – Midday Macro – 8/11/2023
Market’s Weekly Narrative and Headlines:
The S&P is ending the week relatively unchanged, despite increased intraday chop. There was a notable leadership change as energy and healthcare sectors outperformed while value beat growth, with the Nasdaq now -6% off its July high. In general, froth has cometh out of the market, and AI leaders are moving more in sync with the pack. Earnings season carried on, and while the outlook continued to improve, price action continued to be disjointed, with initial reactions up or down later fading. The big news on the week was yesterday’s CPI report which showed small monthly gains for both the headline and core readings, coming in line with expectations and keeping various Fed favorite cuts of the data trending lower. Today’s PPI was a little hotter than expected, though primarily from the final demand for services sub-index due to a particular area, portfolio management costs rising 7.6% MoM. And to think we are doing it for free here. Other data this week showed a stabilization in consumer sentiment and continued declines in inflation expectations, albeit at a reduced rate. The NFIB small business survey also rose despite sales and earnings falling further and uncertainty readings rising sharply. The Fed released its monthly and quarterly credit reports this week, with the flow of revolving credit down while the stock signaled high balances for credit cards but reduced demand elsewhere. Treasuries are ending the week with yields near their recent highs, somewhat surviving the deluge of supply this week. Tailing long-end auctions did not stop the reversal of the recent curve steepening with further Fed tightening fears driving sentiment in the front and belly of the curve. Speaking of the Fed, we had a nice spread between the doves and hawks this week, with Bowman thinking two more hikes are still warranted while Harker and Bostic said enough is enough. Oil spent the week consolidating recent gains, with inventory builds resuming in line with seasonal patterns and OPEC raising its demand forecasts. Copper continued to trend lower as news out of China did not materially improve. The agg complex fell further on improving weather for grains despite continued grain corridor concerns. Finally, the dollar ground higher on the week, with the $DXY nearing 103, helped by soft-landing no-landing Fed keeps hiking fears as the Euro fell below 110.

Deeper Dive:
Last week we promised to give further thoughts on where the US consumer was heading. To give the BLUFs (bottom line up front, a term coined by our previous macro mentor, Rene Aninao), the US consumer’s headwinds are starting to outweigh tailwinds, but consumers are still in a solid position as long as labor markets remain stable, and as a result growth and inflation can remain sticky. However, labor markets are likely to continue to loosen. As a result, we believe consumer spending will slow despite the recent uptick in confidence readings, and the continued resilience consumers have demonstrated over the first half of this year will fade. However, and with full disclosure, we have immense respect for the effects of Fed policy on the real economy. Having spent most of our earlier career in the Research and then Markets Groups at the NY Fed (from 2006 to 2013), we got a front-row seat to how impactful the 800-pound monetary policy gorilla can be. As a result, we have an emotional bias that leads us to doubt how soft any coming “landing” can be given the degree of tightening that has occurred and how restrictive we think the current policy stance will get. As a reminder, further declines in inflation will increase the real effective Fed funds rate, and continued QT, which is methodically draining liquidity, only makes policy increasingly more restrictive (regardless of any further actions by the FOMC). Last summer, when we declared our allegiance to the soft-landing camp, we never envisioned a Fed that may still be tightening policy in Q4 of this year. As a result, our conviction is beginning to waver, and we want to acknowledge this to our readers. With that said, we still believe a period of below-trend growth, but not a deeper prolonged recession, is the modal case for the next four quarters. Pairing this view with worries about inflation picking up and, as a result, a Fed that is not done tightening, and the current rally in risk assets, which has largely been driven by multiple expansion and earnings stabilization for stocks, seems overstretched now, and the recent pullback in stocks, increase in yields, and a stronger dollar makes sense.

*The SF Fed’s Proxy Funds Rate uses a set of 12 financial variables, including Treasury rates, mortgage rates, and borrowing spreads, to assess the broader stance of monetary policy. Its August reading showed a real Fed Funds rate of 7.08%

*Other “proxy” rate measures modeled by DB also show a significantly tighter effective policy rate, coinciding with the Fed’s new measure of financial conditions being tighter than sell-side versions

*The Fed’s Balance Sheet resumes its trend lower after bank lending facilities drove it temporarily higher in March following the failure of SVB and Signature Bank
Turning back to the consumer, and specifically looking at recent consumer confidence surveys, increases in consumer confidence measures are primarily rising on healthier views on employment conditions. The drop in inflation has also played a key role. However, the recent uptick in prices at the pump and the continued cooling in job turnover should increasingly weigh on sentiment moving forward. Add in another looming DC debt showdown, and we are skeptical that the University of Michigan Consumer Sentiment Index or Conference Board’s Consumer Confidence Index can move materially higher from here. We also question whether these gauges correlate very well with actual consumer spending. Finally, as seen in other sentiment-based surveys, such as the NFIB Small Business Survey, there is a wide divergence in respondents’ outlooks based on political affiliation currently. This doesn’t necessarily degrade the value of information in the reports but again strengthens the argument that consumer confidence gauges are often overly emotional and hence not leading indicators or strong predictors of actual personal consumption trends.

*Headline readings of consumer sentiment have picked up off recent lows…

*… mainly due to rising job and hence future income security

*But overall readings are still generally negative, with intentions to consume still skewed defensively

*Further, the spread between respondent’s sentiments is as large as ever

*The lesser known consumer survey CivicScience Economic Sentiment Index is turning lower
These consumer surveys are also often giving conflicting signals within their guts. For example, the Conference Board’s Expectation Index recently moved above 80, with a level below historically signaling a recession. However, when directly asked if they expected a recession, the proportion of respondents saying yes increased in July. Further, although consumers’ assessments of current and expected business conditions and labor markets improved, respondents indicated they intended to spend less on discretionary services, such as travel, recreation, and gambling, in anticipation of increased spending on staples. The most recent NY Fed’s Survey of Consumer Expectations showed an improving outlook on the labor market, with the lowest level of respondents expecting the unemployment rate to be higher in a year since April 2022. However, the perceived probability of losing their own job in the next 12 months increased to the highest reading since November 2021. Further, the SCE survey showed expected one-year-ahead earnings growth remaining in a tight range, around 3%, but household spending growth declined to 5.2%, its lowest reading since September 2021. Finally, perceptions of credit access improved despite the well-known tightening in credit standards and increased rejection rates seen in the SLOOS and SCE Credit Access Survey. We highlight this all to push back on the relevancy of these surveys a little but also to show it is still a highly uncertain period for consumers and firms. This uncertainty was best exemplified in this week’s NFIB Business Optimism Report, which surveys small business owners, some of the country’s more astute consumers. The NFIB Optimism Index monthly uptick was driven by the “softer” components, while “harder” readings were flat (see econ section for further details), and the Uncertainty Index continued to trend higher.

*The spread between expectations and current conditions is at levels that typically coincide with a recessionary growth period

*Although the business sentiment readings differ from those of consumers, the large increase in the NFIB Uncertainty Index while the overall index increased is a good example of the conflicting messages soft data sentiment surveys often give

*The gas tax is growing and has yet to weigh on consumer confidence readings as much as it has in the past, but we believe it will
At this point, we all know about the excess savings and strong labor market tailwinds that have allowed the consumer to remain resilient. Although expected exhaustion dates for excess savings, the extra cash that consumers piled up since February 2020, thanks to a combination of government fiscal support and limited spending options during the pandemic, vary, our view is that it is no longer nearly as strong a tailwind and should normalize by year-end. On the other hand, falling inflationary pressures and more sticky wages should allow real disposable incomes to continue to rise, buffering the lost purchasing power. Effectively the household’s free cash flow is improving while the asset side of its balance sheet is shrinking. Further, after struggling to find qualified workers for the last two years (a problem still), firms are reluctant to fire staff despite reduced capacity needs and greater future demand uncertainty, instead reducing hours worked and reliance on temporary workers. Labor knows this, and although turnover is lower, as seen in a falling quits rate and reduced turnover reported in business surveys, consumer confidence is being supported by this perceived position of strength. Of course, with falling capacity utilization needs, the capital-labor grand bargain skew is increasingly swinging back to capital. This is strengthened by the high level of investment in physical and digital automation and the ability to “do more with less” firms have done over the last years. We believe the multi-decade trend of labor losing profit share to capital owners is still well intact (despite how much you make as a UPS driver).

*Expectations vary, but it is clear that excess savings continue to trend lower, reducing an important tailwind for consumption over the last two years

*Real wages and disposable income measures are all rising, with each monthly report that shows inflation falling

*Although still historically strong by many measures, we believe the labor market is in a looser position than official data signals
The consumer is facing a few notable growing headwinds. As stated, labor markets are loosening, and although nowhere near problematic, this means that wage increases will normalize. The well-telegraphed end of the student loan moratorium will take money away from discretionary spending. We have seen a mix of takes on this and don’t particularly have any conviction on the level of coming drag to growth this will have. One would hope borrowers are prepared and have saved, but this is usually not the nature of the beast and would only increase the drawdown on excess savings faster either way, reducing the wealth effect on consumption that has had. Further, household balance sheets, although still historically strong in the aggregate, are beginning to show some strains. Credit card balances and loan delinquency rates have increased in recent months. We cover the rise in leverage seen in the Fed’s quarterly report on household debt and credit in more detail below in our policy section, but along with tighter lending standards that are increasing the outright level of loan rejections, the ability to lever up to maintain spending is either becoming more expensive or flat out closing for an increasing amount of consumers. This is not an ideal consumer finance backdrop in which one would necessarily want to add potentially hundreds of dollars of new monthly student loan payments. Some consumers will be able to tap a historically high level of available home equity to offset any loss of income. Still, this channel is impaired by high borrowing costs too. In the end, we feel comfortable saying that the headwinds should increasingly overpower the tailwinds, which means, as we are fond of saying, resilient consumers become pragmatic ones, with spending on staples being prioritized over discretionary.

*Consumers are signaling a lower desire to engage in discretionary spending

*The effects of tighter credit conditions have yet actually to hit outstanding consumer credit, but it's likely coming

*Tighter credit leads to reduced spending, which works its way into lower levels of hiring

*Home equity stands ready, given the degree to which home values have appreciated, but consumers continue to turn to credit cards to maintain purchasing power.
In summary, falling inflation isn’t as positive for risk assets as it could be with a Fed still talking about further rate hikes and likely holding a hawkish posture until near year-end, increasingly signaling the willingness to overtighten into a normalizing demand and supply backdrop. As we are fond of saying, policy errors beget policy errors. And although this week showed a divergence in future policy preferences, as we cover in our policy section, we are entering a quieter period of the year with only Jackson Hole having the potential to clarify any changes in views before the September meeting. Since the overall data picture has been in line, as identified by Powell at the July FOMC presser, the risk that the September SEPs still signal further rate hikes is real. With earning reactions generally lacking conviction and momentum fading for the current rally, as seen in technicals and optionality becoming more negative, the overall tone of the market is much less inspiring. Either growth is good, and the Fed keeps tightening, or growth is bad, and earning expectations are too high, and the Fed, at best, signals a desire to keep the policy in restrictive territory for a while anyways. With that backdrop and positioning where it is the “pain trades” are lower yields, lower Nasdaq, and stronger dollar and yen. Further, you are increasingly being paid for duration risk, not market or credit risk. As a result of these views, we closed our copper and oil longs yesterday. We realized an almost 20% gain in our long oil position. Although we still see a fundamental supply deficit story and increased potential for geopolitical risk there, we want to take gains going into an uncertain period of the year. We had hoped to recoup our initial copper long positions losses but have no confidence that Beijing is getting the message and will stop the drip approach to supporting the economy in favor of bolder direct support to the consumer. Unfortunately, despite a tight supply picture and bullish structural demand story for copper over the next several years, the speculative driver is China’s FAI and manufacturing story, which is now reliant on more ambitious stimulus levels. It is clear that the weaker growth levels are not severe enough for Xi to take meaningful action that would heal the damage done to consumer and business confidence from common prosperity and zero-Covid scars. As a result, the current levels of stimulus will have a decreased multiplier effect, and this will weigh on demand for commodities and sentiment towards EM more generally, and an increased deflationary pulse out of China will complicate the inflationary narrative globally, increasing rate volatility, which will increase cross-asset volatility producing reduced risk sentiment, all else equal. We maintain our short position in the FTSE Euro Stoxx 50, Transports, and Homebuilders, as well as our dollar index long. Finally we are opening a short on the iShares MSCI Mexico ETF ($EWW). We plan to go into further detail on this next week but see it as a higher beta play on coming EM weakness from slower global growth and dollar strength. We also will finally address our short Transport position next week as well, not having the space to do so this week.

Please share our newsletter, and feel free to reach out with any questions or comments.
Thank you for reading! - Mike Ball
Policy Talk:
New York Fed President Williams gave an interview to the New York Times last weekend. Williams acknowledged the continued strength in the economy but also believed a lot of “indicators were moving in the right direction” as supply and demand moved into a better balance. He still sees the need for further rate hikes as an open question but believes policy is in a good place currently. He highlighted that with inflation coming down, real rates are rising, and even if the Fed doesn’t change the current level of rates, policy will still become more restrictive. He followed this by saying he believes inflation will reach the Fed’s 2% target within two years, with recent readings coming as expected, and as a result, policy will need to get to a more normal setting eventually. He sees the current labor market strength as recovering from the pandemic and expects this to normalize. He also deemphasized wage growth, seeing it more as an indicator than a target, and expects it to align back to productivity trends over the long run. He did not commit to skipping a rate hike in September, pointing to the amount of data releases between now and then. Williams also expects the unemployment rate to normalize but doesn’t know if it needs to rise significantly to bring inflation back to target. When thinking about what he needs to see to cut rates, Williams reverted back to his views on real rates rising as inflation fell, moving policy into an overly restrictive stance that would then need to be corrected. He also noted that a reacceleration of the economy would mean the Fed “needs to act appropriately.” He concluded by stating he hasn’t seen any strong evidence that neutral rates have risen much beyond pre-pandemic levels and, as a result, real rates would fall over time. He ended this line of thought by saying he did not support raising the inflation target.
“I think we’ve got monetary policy in a good place, it is definitely restrictive, but we have to watch the data. Are we seeing the supply-demand imbalances continue to shrink, move in the right direction? Are we seeing the inflation data move in the right direction, in order to decide that?”
“The data have surprised me and everybody a lot the past couple of years, because of the pandemic, the war, Russia’s war in Ukraine, all the things that happen. Surprises in data have become more the norm. For me, personally, the inflation data have been coming in as I had expected — and also hoped.”
“From my perspective, we have gone from a place — a year, a year and a half ago, where the inflation was way too high, not moving in the right direction, and the risks were all on inflation being too high, to one where the risks are on both sides.”

Fed Governor Bowman gave “Brief Remarks on the Economy and Monetary Policy” at an event sponsored by the Kansas Bankers Association. She reviewed the policy-tightening actions to date and, while seeing recent trends lower in inflation as positive signs, noted that both total and core inflation remained well above the Fed’s 2% target. She highlighted that the economy remained strong, with robust consumer spending and the housing sector rebounding. Labor markets also remained strong in her view, although she acknowledged a better supply and demand balance was starting to emerge. She saw the banking system as “strong and resilient” and noted that tighter lending standards had yet to lead to a tight contraction in credit that would slow growth. As a result of the high inflation and stronger growth, Bowman favored raising rates further, going as far as to predict that multple hikes were needed.
“The most recent employment report showed a strong labor market with low unemployment and solid job gains. The pace of job gains has slowed, which is a sign that labor market demand and supply are coming into better balance. But the demand for workers continues to exceed the supply of available job seekers, adding upward pressure on prices.”
“The banking system continues to be strong and resilient. While banks have tightened lending standards in response to higher interest rates and funding costs, there have not been signs of a further sharp contraction in credit from the stress earlier this year that would slow economic activity. Though loan balance growth has slowed, banks have continued to increase lending to households and businesses.”
“Given the strong economic data and still elevated inflation, I supported the FOMC's decision in July to further increase the target range for the federal funds rate. I also expect that additional rate increases will likely be needed to get inflation on a path down to the FOMC's 2 percent target.”

Philadelphia Fed President Harker gave prepared remarks titled “On the Flight Path to the Soft Landing” at an event hosted by the Philadelphia Business Journal. Harker started off by acknowledging the data-dependent situation policymakers were currently in. He noted slow progress against inflation and expects a year-end core PCE level of 4%. He expects labor tightness to ease further and a slightly lower rate of growth than we have seen so far this year, creating a soft landing scenario. He believes the Fed is now at a place where it no longer needs to raise rates but will need to remain at the current restrictive level for “a while.” He went on to discuss the Philadelphia area-specific economy, noting weakened activity from both manufacturing and service sector PMIs, although future outlooks have improved. He highlighted a tapering off of rent inflation in the region while the housing market remained tight due to a lack of supply. Harker noted that he was “very sensitive” to the state of commercial real estate, identifying both the financial channels and also main street effects office closing could have. He surmised that the end of the student loan moratorium would be important given the effect it would have on borrowers' ability to consumer elsewhere. He added that an increase in credit card balances and delinquency rates already showed some strains on the health of the household balance sheet. However, he believes the economy will continue to be “resilient.” He announced a new tracking measure by the Philly Fed that looked at the regional economy's dependence on educational and medical sectors, with Philadelphia being higher than the baseline. Concluding his remarks that the initiative would empower local businesses by giving them greater data to make better-informed decisions.
“In sum, I expect only a modest slowdown in economic activity to go along with a slow but sure disinflation. In other words, I do see us on the flight path to the soft landing we all hope for and that has proved quite elusive in the past.”
“First, I recognize the potential impact on financial institutions heavily invested in CRE, should they get pressed into ownership in the event of a loan default. But on a more street level, I have concerns about the health of the businesses traditionally supported by now-remote workers or those only in their offices intermittently, especially in the restaurant and services industries.”
“As we’ve been tracking, credit card balances and loan delinquency rates have both been increasing in recent months. Coinciding with this has been a decrease in bank balances, as consumers have drawn more from their savings to pay their bills, even if this drawdown is of pandemic-era supports they’ve held on to. This is not the ideal consumer finance backdrop in which one would necessarily want to add potentially hundreds of dollars in new monthly student loan payments.”

The latest Quarterly Report on Household Debt and Credit Report showed total household debt rose by $16 billion to reach $17.06 trillion in the second quarter of 2023. Mortgage balances were little changed from the prior quarter, remaining near $12 trillion, as were home equity lines of credit, which stood at $340 billion. Credit card balances rose by 4.6% QoQ or $45 billion to a series high of $1.03 trillion. Auto loan balances increased by 1.3% QoQ, or $20 billion, to $1.58 trillion. Student loan balances declined by -2.2% QoQ, or -$35 billion, to 1.57 trillion. Finally, other balances, which include retail credit cards and other consumer loans, increased by 3% QoQ, or $15 billion, to $527 billion.
Mortgage originations were $393 billion in Q2, an uptick from the 9-year low observed in the previous quarter. New auto loan origination was $179 billion, largely due to the higher dollar values of new purchases as the number of newly opened loans remains below pre-pandemic levels.
Aggregate limits on credit cards were increased by 2%$ QoQ, or $90 billion in the second quarter. Limits on home equity lines of credit increased by 0.7% QoQ or $6 billion.
The median credit score for newly originated mortgages increased by 4 points, to 769. The median credit score on newly originated auto loans declined by 5 points.
Aggregate delinquency rates were roughly flat in the second quarter and remained low, after declining sharply through the beginning of the pandemic. As of June, 2.7% of outstanding debt was in some stage of delinquency, two percentage points lower than in the last quarter of 2019.
The share of debt newly transitioning into delinquency increased for credit cards and auto loans, with increases in transition rates of 0.7 and 0.4 percentage points, respectively. Credit card balances saw the most pronounced worsening in performance in Q2. Transition rates for credit cards and auto loans are now slightly above pre-pandemic (2019Q4) levels.
About 114K consumers had a bankruptcy notation added to their credit reports in Q2, slightly more than in the previous quarter. Approximately 4.6% of consumers have a 3rd party collection account on their credit report, with an average balance of $1,555, up from $1,316 in the first quarter.

*Total household debt rose by $16 billion to reach $17.06 trillion in the second quarter

*Student loan delinquency should pick up moving forward as payments resume, while credit card delinquencies are normalizing

*Consumer credit borrowing costs have moved higher as the Fed raised rates
The Atlanta Fed's Wage Growth Tracker increased to 5.7% in July, a tick higher than 5.6% in June in the unweighted series. For people changing jobs, the tracker was 6.4%, up from 6.1% in June, while job stayers' wage increases were unchanged from June at 5.4%.

The NY Fed’s Liberty Street Blog discussed the evolution of the short-run natural rate of interest, or short-run r*, over the past year and a half according to the New York Fed DSGE model, and the implications of this evolution for inflation and output projections in a post titled “The Evolution of Short-Run r* after the Pandemic.” The authors show that “from the model’s perspective, short-run r* has increased notably over the past year, to some extent outpacing the large increase in the policy rate. One implication of these findings is that the drag on the economy from recent monetary policy tightening may have been limited, rationalizing why economic conditions have remained relatively buoyant so far despite the elevated level of interest rates.”

U.S. Economic Data:
The headline CPI rate rose by 0.2% in July, the same as in June, and matching market expectations, moving the annual rate higher to 3.2% from 3%. Core CPI also rose by 0.2% MoM, the same as in June, and matching expectations, moving the annual core inflation rate lower to 4.7% versus 4.8%. The food index increased slightly, rising by 0.2% MoM verse a 0.1% MoM increase in June. Food at Home increased by 0.3% MoM, mainly due to increases in the cost of meats, while Food Away From Home increased by 0.2% MoM. The energy index cooled to a 0.1% MoM gain verse 0.6% in June, mainly due to a slowing in the increase in gasoline prices, which only rose by 0.2% MoM verse 1% prior. Shelter was again the most significant contributor to the overall monthly gain in inflation, rising 0.4% in July, the same as June, and accounting for 90% of the increase in the overall index. Transportation Service costs rose by 0.3% MoM, with motor vehicle insurance increasing again at a strong pace, rising 2% after a 1.7% increase in the preceding month, while auto insurance was also up a notable 1% MoM, following a 1.3% MoM in June. Prices for education (0.3% MoM) and recreational (0.8% MoM) services also increased in July. Declines were seen in airline fares, which fell -8.1% MoM, its fourth consecutive monthly decline. Used cars and trucks declined by -1.3% MoM, following a decrease of -0.5% MoM in June. Price changes were essentially flat for apparel, new vehicles, while the medical care index declined by -0.2% in July after being unchanged the previous month.
Why it Matters: The ever-important CPI report showed a continued cooling in the inflationary picture with marginal gains for a second month in a row for the core rate. Again the overall monthly inflationary increase was driven by shelter, something we know to be increasingly detached from reality given national rent prices are falling. There is effectively no core inflation when excluding shelter, as the three-month average excluding energy, food, and shelter is now 1.1% annualized. The Fed's favorite CPI cuts all made further progress in Jult, outside of the Atlanta Fed’s Sticky-Price measure, which only rose marginally on an annualized monthly basis. The Cleveland Fed’s Median and Trimmed-Mean CPI indexes rose by 0.2% MoM to 6.1% YoY and 4.8% YoY, respectively, continuing to show disinflationary progress. The NY Fed’s Underlying Inflation Gauge’s “full data set” index moved lower to 3% while the “prices only” index fell to 2.3%, both lower by -0.2% MoM. Finally, the Atlanta Fed’s Sticky-Price CPI Index moved to 3.1% (on an annualized basis), up from 2.9% in June and moving the year-over-year basis to 5.6%, while the Flexible Cut decreased to 0.7% annualized in July, moving the year-over-year basis to -1.6%. Gasoline prices didn’t actually cool over the month at the pump, as seen in the official CPI data, so there may be some payback there in the August CPI report. We find increased worries of renewed inflationary pressures due to the rise in energy costs to be a little premature, but we must respect the price action resulting from it.

*Annual headline inflation ticked higher slightly while core fell by 0.1%

*Monthly gains in both headline and core remain subdued, with core rising 0.2% for a second month in a row

*Supercore rose 0.19% MoM to 4.13% YoY, with the last four months all remaining around 0.2% MoM increases

*Three-month annualized changes declined further, with the headline index now at target and core fast approaching

*The percentage of CPI components greater than 2% declined sharply in July

*”Inflation is basically GONE when you exclude the lagged shelter (i.e. rent) data in CPI. Remember: Rent is the biggest variable in the CPI's biggest category (shelter), and there's a known 12-month lag between asking rents and CPI rents.” - @jayparsons
Producer prices rose 0.3% in July, following no change in June, and above market forecasts of 0.2%. This moved the annual headline PPI rate to 0.8% from 0.2% YoY in June. The core PPI rate also increased by 0.3% MoM, following a decrease of -0.1% in June and moving the annual rate to 2.4%, the same as in June. “Final Demand for Services” prices were up 0.5% MoM, the largest rise since August 2022, rebounding from a -0.1% fall in June, driven higher by portfolio management (7.6%) and transportation and warehousing services (0.5%). Trade also rebounded, rising 0.7% MoM in July after declining -0.8% in June. “Final Demand for Goods” prices rose by 0.1% MoM, after a flat reading in June, led by foods (0.5%), namely meats (5%). The energy price index was notably flat in July after rising 0.7% in June. Within intermediate demand in July, prices for processed goods fell -0.6% MoM, while the index for unprocessed goods rose 1.7% MoM, and prices for intermediate services moved up 0.5% MoM, with half of the broad-based rise can be traced to margins for trade services for intermediate demand, which moved up 1.3% MoM.
Why it Matters: A mixed report with headline PPI rising by the highest monthly amount since January. A large contribution to the headline increase came from increases in Final Demand for Service prices, the highest monthly increase in almost a year, but 40% of the rise was driven by increases in portfolio management costs (we certainly haven't seen that), and it's unclear how inflationary this reading truly is for “main street.” It is notable that margins for trade services expanded at a strong pace, pushing back on our views that reduced pricing power should compress margins, which was seen in the prior two months. On top of this, there were broad price increases in other categories for services for intermediate demand, pushing the annual rate higher for a second month to 4.6%, a trend worth watching.

*Similar to CPI, both headline and core PPI increased by the same amount

*As a result of tougher comparables, the annual Headline PPI rate ticked higher while core was unchanged

*Final Demand for Services is the primary driver of PPI remaining positive, higher by 1.68% YoY, although Final Demand for Goods increased due to rises in food prices

*Intermediate Demand Price Index for Goods was mixed, but the annual total change bounced notably higher off recent lows seen last month
The University of Michigan Consumer Sentiment Index moved lower to 71.2 in August from 71.6 in July in its preliminary estimate, beating forecasts of 71. The Index of Consumer Expectations declined to 67.3 from 68.3, while the Current Economic Conditions index increased to 77.4, the highest since October of 2021, from 76.6. The year-ahead inflation expectations edged down to 3.3% from 3.4% in July and the five-year ahead outlook edged lower to 2.9% from 3%.
Why it Matters: The slight pullback in the expectations index was driven by a decline in the five-year outlook with expected personal finance and one-year outlook unchanged. Otherwise, respondents generally perceived few material differences in the economic environment from last month but continue to see a substantial improvement relative to just three months ago. Further, the decline in the year-ahead inflation outlook showed a marginal improvement, a positive given where the price at the pump has gone, and allowing the Fed to continue to see inflation expectations as well anchored given the long-term inflationary outlook has been in a tight range (2.9% - 3.1%) for around two years.

*Little change in the preliminary reading for August, with the decline primarily due to the five-year outlook and current personal finances marginally falling

*One-year ahead inflation expectations continue to trend lower, although as with other readings, there was little change between July and August
The NFIB Small Business Optimism Index increased to 91.9 in July, a fresh high since last November, coming in higher than market expectations of 90.6. 23% of owners cited labor quality as their top business problem, followed by 21% reporting inflation, down three points from June, followed by 10% citing labor costs, up two points.
A net negative -30% of owners expect better business conditions over the next six months and improvements of 10 points from June, the highest reading since August 2021. 13% of owners report higher nominal sales in the last three months, while -12% of owners expect real sales to improve, an increase of two points from June. The frequency of reports of positive profit trends was a net negative -30%, down six points from June.
A net 25% of owners reported raising average selling prices, a decrease of four points and the lowest level since January 2021. 14% reported lower average selling prices, and 40% reported higher prices. Price hikes were most frequent in finance, retail, and wholesale. A net 27% plan price increases moving forward.
61% of owners reported hiring or trying to hire in July, up two points from June. A net 42% of owners reported having job openings hard to fill, unchanged from June, while 92% reported few or no qualified applicants. 38% reported raising compensation, while 21% plan to raise compensation in the next three months.
A net 55% of owners reported capital outlays in the last six-month, up two points from June, with the majority making expenditures on new equipment followed by acquiring vehicles and investment in facilities. 27% of owners expect to make capex investments in the next few months.
3% of owners reported all their borrowing needs were not satisfied, while 25% reported all credit needs were met, and 62% reported no interest in new borrowing. A net 6% reported their last loan was harder to get than prior attempts.
Why it Matters: Optimism ticked up, as seen in the notable rise in business outlook, although still negative and accompanied by an uptick in the uncertainty index,with the overall rise in the headline index supported by “softer” components, while sales and earnings worsened over the last three months. Despite this worsening sales/earnings picture, a greater share of respondents reported plans to increase employment, capital outlays, and inventories in July. Small businesses are now reporting finding qualified workers is now their top business problem as inflation concerns continue to fall fast. Credit conditions were unchanged, with no notable uptick in demand or trouble accessing loans. For all the talk of tightening financial conditions, it has yet to be acknowledged by small businesses as an issue. If monetary policy has played a significant role in curbing activity, it's not showing up in this report. “With small business owners’ views about future sales growth and business conditions dismal, owners want to hire and make money now from solid consumer spending. Inflation has eased slightly on Main Street, but difficulty hiring remains a top business concern”, said NFIB Chief Economist Bill Dunkelberg. Bill highlights that despite recent improvement, the index still signals a recessionary environment and would be lower if it wasn’t for job openings and intentions to hire readings.

*The overall NFIB Optimism Index rose to its highest level since last November, with soft components driving the gains while uncertainty increased

*The NFIB Optimism Index was primarily driven higher by “softer” components

*Despite the uptick, actual sales and earning trends weakened, although expected sales rose

*Labor quality issues overtook inflation as small business's number one reported single most important problem

25% of small businesses raised prices, the lowest level since January 2021
The Federal Reserve’s June Consumer Credit Report showed total consumer credit rose by $17.9 billion to just under $5 trillion, following an upwardly revised $9.45 billion growth in the previous month and higher than market estimates of a $13 billion increase. Revolving credit (credit cards) fell by -0.6% (on an annual basis) or by -$605 million to $1.26 trillion, compared to an $8.49 billion rise in the prior month. Non-Revolving credit, such as auto and student loans, increased by 6% (on an annual basis) or by $18.45 billion to $3.73 trillion, following an upwardly revised $967 million gain in the prior month.
Why it Matters: Revolving credit, which is mainly credit card balances, decreased for the first time in more than two years. The decline here suggests higher credit card financing rates are weighing on usage or that consumer is potentially cooling their spending more generally (OMG!). On the other side, the value of loans for vehicle purchases increased to a fresh record in the second quarter, driving most of the gains in non-revolving credit balances as student loan levels fell. As we saw in the NY Fed’s Q2 Quarterly Household Debt and Credit Report, where the aggregate dollar amount of auto loans rose while the absolute number of individual loans fell, the monthly uptick doesn’t necessarily mean auto demand is rising, just that cars are getting more expensive.

*Revolving credit’s monthly change fell notably while total increased

*Inflation adjusted revolving consumer credit is still below pre-pandemic levels
Technicals, Positioning, and Charts:
The Russell is outperforming the S&P and Nasdaq on the day with Low Volatility, High Dvd Yield, and Value factors, as well as Energy, Health Care, and Utilities outperforming on the day. Leadership on the week was more defensive tilted, with Low Vol, High Dividend Yield, and Value factors outperforming, as also seen today, and Large Cap Value the best performing size-style factor combo on the week. Energy was the clear winner in regards to sector performance, thanks to the grind higher in oil prices. It was followed by Health Care, which saw some single name outperformance, and more yield-heavy sectors such as Utilities and Real Estate.

@KoyfinCharts
S&P optionality strike levels have the Zero-Gamma Level at 4510 while the Call Wall is 4600 and Put Wall is 4400. The market did very little this week, with the S&P near its Monday level and implied vol little changed despite larger intra-day swings. Support moved lower as the Put Wall fell by 100 points. Spotgamma highlights that despite the negative price tilt, volatility should remain contained around current levels. change. However, larger ST put buying flows on the SPX emerged yesterday and capped gains. Single name IV has been falling as the AI-driven June rally is unwinding and leadership changes. There does not yet seem to be a large demand for longer date puts, as seen in open interests and IV term structure. Spotgamma believes that if downside demand picks up, particularly near 4,400, then IV's would jump, and the daily moves to become much more directional.

@spotgamma
S&P technical levels have support at 4470, then 4550, with resistance at 4490, then 4510. The core technical structure is the yellow down channel, off the July 27th high, a bull flag pattern assuming a positive breakout. This moves critical support of the flag to 4470, and everything inside the flag is consolidation for the next move, with the green down-sloping trendline now inside resistance around 4540. The 4510 area is becoming a key area of gravity, with moves below not lasting until today, indicating a base building is still occurring. Finally, the 4485 area is major June/July resistance level from the ascending triangle formation, and a close below it today would indicate a shift in bull/bear momentum and increase the likelihood that we test 4470.

@AdamMancini4
Treasuries are lower on the day, with the 10yr yield higher by 6bps to 4.17%, while the 5s30s curve is flatter on the session by 5.5 bps, moving to -3.7 bps.

Four Key Macro House Charts:

Growth/Value Ratio: Value is higher on the day and the week, with Large-Cap Value the best-performing size/factor on the week.

Chinese Iron Ore Future Price: Iron Ore futures are lower on the day and the week.

5yr-30yr Treasury Spread: The curve is steeper on the day and the week.

EUR/JPY FX Cross: The Euro is weaker on the day but stronger on the week.
Other Charts:

The S&P is coming up on its 50 DMA as well as an are in saw resistance in June and that should now be support.
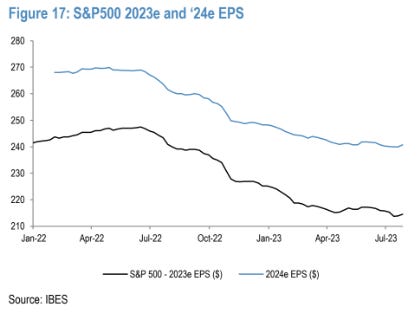
S&P 500 earnings estimates for 2023 and 2024 have improved slightly in recent weeks. - JP Morgan

The US stock/bond correlation flipped positive following the BoJ’s surprise yield curve control adjustment.

“About 43% of companies reviewed in the first half of this year generated negative free operating cash flow after applying high benchmark rates. According to S&P, this also reflects companies continuing to invest in capital expenditures.” – S&P Global Ratings

What would happen if one only holds the top ten S&P 500 stocks, rebalancing monthly? – DailyShot

Despite softer inflation reports, market implied future inflation levels have been rising

Grains are at levels experienced before the grain corridor shut down as improved weather has changed supply estimates.
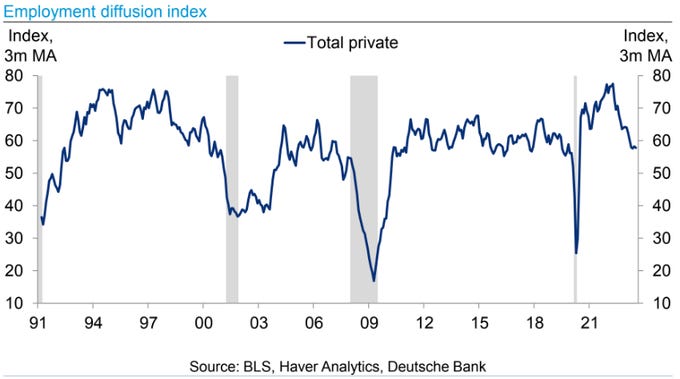
"Breadth of employment gains has declined sharply and near the lower end of the range from the last cycle." - Deutsche Bank

"In July startup job postings on Hacker News, a site for coders, were down by 40% compared with a year ago." – The Economist

American households are earning $121 billion more in investment interest income versus a year ago but are paying $151 billion more in interest on mortgages, credit cards and other loans.
Articles by Macro Themes:
Medium-term Themes:
China’s Post-Pandemic Life:
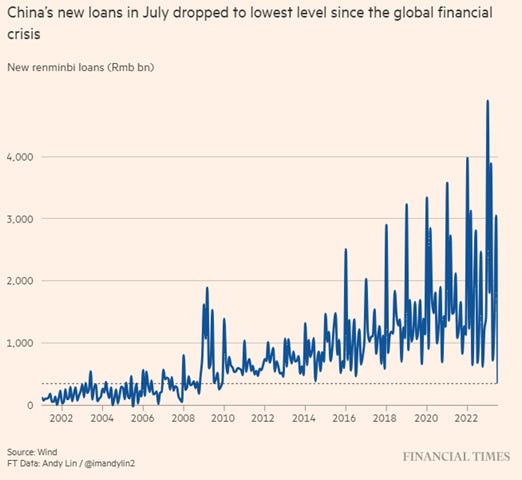
Disappointing: New lending by Chinese banks fell sharply in July to levels not seen since November 2009, underscoring faltering growth in the world’s second-largest economy. Banks extended just Rmb345.9bn ($47.8bn) of new loans in July, down from Rmb3tr handed out in June. Analysts polled by Reuters had expected Rmb800bn. Household borrowings contracted by Rmb200.7bn during the month, pointing to further declines in outstanding mortgages. Property owners have rushed to pay off their mortgages early instead of spending on shopping or other consumption. Further, the persisting deceleration in loan growth shows corporate and households are very cautious about the future and remain less sensitive to any interest rate cut or liquidity injection, showing confidence is yet to improve. - China’s bank lending plummets in further sign of economic woe - FT
Know His Thoughts: The Communist Party leader’s musings on everything from the economy to space missions have long been required reading within the party and China’s government. But with Xi now months into a precedent-breaking third term, study sessions on his ideology have also become mandatory for staff at many state-owned and private-sector companies. The study sessions, viewed by some as time-consuming chores, underscore the growing role of ideology in China as Xi tries to increase the party’s influence over many aspects of local life, including a corporate sector that’s been chastened in recent years by a series of government crackdowns.Some bank executives and business heads have to take around a third of their working time to study “Xi Thought,” join activities and courses, or read four books from Xi every month, according to people familiar with the matter. It all seems strange that a communist government puts so much emphasis on one individual, but what do we know? We are evil capitalists. - Bankers Forced to Study Xi’s Thoughts as Party Tightens Grip - Bloomberg

Longer-term Themes:
A.I. All Day:
Libel AI: Artificial intelligence’s struggles with accuracy are now well documented. The list of falsehoods and fabrications produced by the technology includes fake legal decisions that disrupted a court case, a pseudo-historical image of a 20-foot-tall monster standing next to two humans, even sham scientific papers. Many of the companies behind the technology have made changes in recent months to improve the accuracy of artificial intelligence, but some of the problems persist. However, if an individual is falsely labeled or slandered, legal precedent to correct artificial intelligence is slim to nonexistent. The few laws that currently govern the technology are mostly new. Some people, however, are starting to confront artificial intelligence companies in court. - What Can You Do When A.I. Lies About You? – NYT

Energy’s Midlife Crisis:
Synergies: ExxonMobil is the latest oil producer looking to apply its drilling expertise to lithium exploration as Big Oil seeks new ways to navigate the energy transition. Oil producers are seeking to take advantage of a groundbreaking new technology designed to speed up lithium extraction from brine water at lower costs, for higher returns and with a smaller carbon footprint than traditional methods, even if it remains unproven at scale. ExxonMobil's early interest in the metal stems from a desire to leverage existing skillsets within its core oil and gas business as it prepares for a lower-carbon future. That same strategy has seen it shun wind and solar power, unlike its European rivals, on the grounds that it has little in the way of any competitive advantage to offer. Lithium production "requires a good understanding of the subsurface, requires a good understanding of reservoir management, requires drilling and injections," chief executive Darren Woods says. - ExxonMobil joins Big Oil’s dash for lithium - Argus

Still Peaking: Higher-than-expected well productivity and rising crude prices will help boost US production to a record 12.8 million barrels a day in 2023, up from a previous forecast of 12.6 million, according to a monthly report from the US Energy Information Administration. The US averaged about 11.9 million barrels a day in 2022. Production in both the US and globally is forecast to increase further next year. World output will grow to 103 million barrels a day in 2024, up 1.7 million barrels per day from this year, the EIA said. Over 70% of that growth is expected to come from non-OPEC countries, led by the US, Brazil, Canada, Guyana, and Norway. - US Oil Output to Hit Record This Year, Helping Counter Saudi Cuts - Bloomberg

Food: Security, Innovations, and Climate Change Implications:
ไม่มีน้ำ: Rice prices soared to the highest in almost 15 years in Asia on mounting concerns over global supplies as dry weather threatens production in Thailand and after top shipper India banned some exports. Authorities in Thailand, the second-biggest shipper, are encouraging farmers to switch to crops that need less water as the nation braces for drier conditions with the onset of El Niño. Cumulative rainfall in the key central growing region is 40% below normal, and the move to curb planting is to conserve water for households. The government previously asked growers to reap only one crop this year. - Rice Soars to Highest Since 2008 on Rising Threats to Supply - Bloomberg

Fermented Meat: Protein is critical to a healthy diet, but producing meat is a lengthy and inefficient process. It takes months, if not years, to breed and rear a calf or lamb and vast areas of precious farmland to feed them. Besides, consumers worried about health, cruelty, and environmental impact are increasingly looking for planet-friendly alternatives. MicroHarvest is one of a handful of early-stage companies investigating microbes, which exist in single-celled form, as a potential solution. Microbes are prevalent in nature; they’re found everywhere and already part of our diet. Humans have used bacteria for centuries to produce nutritionally-rich foods including yogurt, cheese, kefir, and kimchi. Best of all, they proliferate exponentially under the right conditions. “Fermentation is an incredibly efficient process, enabling proteins to grow very quickly — sometimes doubling in size within hours, compared to months or years for animals,” says Seren Kell, an expert specializing in sustainable proteins at the Good Food Institute, a non-profit. - A Day in the Life of the Microbe That Wants to Replace Your Steak - Bloomberg

ESG versus the World:
Enough: Environmental protestors have implemented major roadblocks on major motorways in Britain have caused traffic chaos, protests at oil installations in Germany have disrupted supplies, and in France, thousands of activists and police clashed over water usage, leaving dozens injured. Determined to prevent such protests from strengthening further, states in Germany and national authorities in France and the UK are invoking legal powers often used against organized crime and extremist groups to wiretap and track activists. - Europe cracks down after rise in 'direct action' climate protests - Reuters
 activists protest in Berlin")
Asian Tigers 2.0:
Above Trend: Indonesia’s economic growth accelerated last quarter, fueled by consumption that defied the impact of higher interest rates, still-elevated prices, and a commodity slowdown. Gross domestic product rose 5.17% in the three months through June compared to a year ago. That beats the 5% median forecast in a Bloomberg survey of economists and the expansion in the previous two quarters.Last quarter’s performance underlines the resilience of Southeast Asia’s largest economy amid the slump in global commodities, as government and household spending, along with increased investments and manufacturing, helped counter lower exports. The growth surprise gives Bank Indonesia more room to keep borrowing costs at a four-year high to guard the currency, which has declined for three straight weeks. - Indonesia Growth Surprises as Consumers Shake Off Inflation - Bloomberg

Cold Places (Deep Sea, Artic, and Space Colonization):
Laying Rules Down: The US and China need to modernize their submarine cable regulatory provisions. The same is true for the UNCLOS framework, which still fails to address several critical issues. For example, deliberate attacks on cables lying outside territorial seas are unlikely to be crimes under international law. Additionally, coastal states have no legal obligation to adopt laws protecting submarine cables in their territorial seas. If UNCLOS does not update its cable governance regulations to ensure adequate national security protections, states will take their own steps to do so, and the trend of a fragmented undersea cable landscape is likely to persist. The domestic regulations within the US and China are particularly significant given the importance of both countries to the international submarine cable market. As policymakers in both capitals start to analyze, review, and update their respective legal regimes, the regulatory frameworks of subsea cables will remain a critical space to monitor. - U.S. And China Locked In Underwater Tug-of-War – Jamestown Foundation

Other Articles of Interest:
Problems Ahead: Banks were among the biggest decliners earlier this week, although stock prices later rebounded somewhat, as the ratings of 10 midsized US lenders were cut on Monday night, with Moody’s citing a slowdown in deposits, higher funding costs, and asset quality risks, particularly in the commercial real estate sector. The agency also placed six lenders on review, leaving the door open for more downgrades. The news reignited investors’ concerns over the health of the country’s banking sector, which struggled earlier in the year after the collapse of three regional lenders. Financial stocks were also lower in Europe after Italy’s deputy prime minister announced a 40 percent windfall tax on banks that have recently profited from rising interest rates, although this was talked down later in the week. - US bank stocks fall after Moody’s cuts ratings on several midsized lenders - FT

Rolling Recession: There are sector-specific slumps in manufacturing, chemicals, cardboard boxes, freight, tech/electronics, residential and commercial property, mergers & acquisitions, and advertising. “Maybe the country is not in a recession, but real estate is,” Jordan Kaplan, boss of US property-investment firm Douglas Emmett said last week. “Our industry has been in recession and still is,” Jonathan Johnson, chief executive officer of online furnishings retailer Overstock.com said. “I don’t know that we’ve ever seen freight demand fall this far, so far and for so long, without an accompanying economic recession,” David Jackson, the boss of Knight-Swift Transportation Holdings told analysts. If the list of struggling industries gets any longer, we may still get a full-blown recession. For now, though, conditions match the description of a rolling recession, which is when various parts of the economy shrink at different intervals. - A Rolling Recession Is Roiling Lots of Industries - Bloomberg

Podcasts and Videos:
VIEWS EXPRESSED IN "CONTENT" ON THIS WEBSITE OR POSTED IN SOCIAL MEDIA AND OTHER PLATFORMS (COLLECTIVELY, "CONTENT DISTRIBUTION OUTLETS") ARE MY OWN. THE POSTS ARE NOT DIRECTED TO ANY INVESTORS OR POTENTIAL INVESTORS, AND DO NOT CONSTITUTE AN OFFER TO SELL -- OR A SOLICITATION OF AN OFFER TO BUY -- ANY SECURITIES, AND MAY NOT BE USED OR RELIED UPON IN EVALUATING THE MERITS OF ANY INVESTMENT.
THE CONTENT SHOULD NOT BE CONSTRUED AS OR RELIED UPON IN ANY MANNER AS INVESTMENT, LEGAL, TAX, OR OTHER ADVICE. YOU SHOULD CONSULT YOUR OWN ADVISERS AS TO LEGAL, BUSINESS, TAX, AND OTHER RELATED MATTERS CONCERNING ANY INVESTMENT. ANY PROJECTIONS, ESTIMATES, FORECASTS, TARGETS, PROSPECTS AND/OR OPINIONS EXPRESSED IN THESE MATERIALS ARE SUBJECT TO CHANGE WITHOUT NOTICE AND MAY DIFFER OR BE CONTRARY TO OPINIONS EXPRESSED BY OTHERS. ANY CHARTS PROVIDED HERE ARE FOR INFORMATIONAL PURPOSES ONLY, AND SHOULD NOT BE RELIED UPON WHEN MAKING ANY INVESTMENT DECISION. CERTAIN INFORMATION CONTAINED IN HERE HAS BEEN OBTAINED FROM THIRD-PARTY SOURCES. WHILE TAKEN FROM SOURCES BELIEVED TO BE RELIABLE, I HAVE NOT INDEPENDENTLY VERIFIED SUCH INFORMATION AND MAKES NO REPRESENTATIONS ABOUT THE ENDURING ACCURACY OF THE INFORMATION