

Stronger Productivity and a Growing Workforce Challenge Traditional Policy Views – Midday Macro
Stronger Productivity and a Growing Workforce Challenge Traditional Policy Views – Midday Macro
Color on Markets, Economy, Policy, and Geopolitics

Stronger Productivity and a Growing Workforce Challenge Traditional Policy Views
Midday Macro – 4/9/2024
Market’s Weekly Narrative:
Equities are slightly lower today, and there has been little change over the last week, with traders awaiting tomorrow’s CPI report. Internally, a large deal led to the real estate sector outperforming, while higher energy prices have supported the energy sector. Last week’s jobs report reduced the Fed's expected rate cuts this year to somewhere between two and three, which was already on market minds given the high level of Fed officials speaking, although posturing by doves and hawks changed little. The current reflationary narrative was also emboldened by the higher-than-expected payroll print, although more muted wage gains and little change from the JOLTs report on quits kept wage-spiral fears in check. Last week’s ISM Manufacturing was stronger than expected, with inflation picking up. However, the service sector reading cooled, with falling (but still expansionary) price readings pushing back on worries inflation was reaccelerating. Today’s NFIB report showed a further cooling in small business owner sentiment, with sales expectations dropping notably while hiring plans fell further. Construction spending showed a pick up in single-family activity but broader cooling elsewhere, while factory orders rebounded in March after weakness in the prior two months. Treasuries sold off notably over the last week, first on ISM manufacturing and then on the stronger payrolls print. This week brings new supply and of course, the gambit of inflation data from CPI, PPI, and export/import prices.

Oil is pulling back today after rallying for the last week on increased geopolitical risk worries. There are no signs that OPEC or Russia will increase supplies, while Mexico announced it is reducing exports. Copper had a strong rise on the week, with a supply deficit increasingly materializing due to the electrification of all things and more positive sentiment towards China’s overall growth trajectory. The DB agriculture index was slightly higher on the week, although corn, wheat, and bean futures were lower and softer crops led. Finally, the dollar was weaker over the last week, with the $DXY falling below 104 today. The Aussie Dollar, Euro, and Pound have been appreciated, while the yen and Canadian dollar have changed a little.

Headlines:

Deeper Dive:
The message being communicated by Federal Reserve officials recently is increasingly becoming a Rorschach test for markets. Increased data dependence and a more two-sided risk management approach have produced a more uncertain policy path. As a result, this week’s inflation data will be of greater importance, given the recent string of more robust results so far this year and the need to balance out last week’s stronger-than-expected NFP report. A weaker core service CPI reading, especially in “supercore,” could embolden the narrative that a larger workforce population and higher levels of productivity mean that the non-inflation accelerating level of growth is higher than previously thought, allowing disinflation progress to continue (based on further supply-side improvements in labor) and the Fed to cut rates this year without actually loosening policy. At least, this is the argument that the doves are making, and it seems Chairman Powell is also increasingly on board. We believe the next few months will show a more benign inflationary backdrop and a further loosening of labor markets, pushing back on the current reflationary narrative driving markets recently. This change in the narrative will come from a combination of things, and today, we will focus more on domestic factors versus changes in geopolitical risks and the growth picture abroad, which are more uncertain.

*Has disinflationary progress really stalled out? The NY Fed’s MCT inflation model has been rangebound while core PCE continues to trend lower

*The country's overall population has only grown 0.5% YoY, but increased legal and illegal immigration has had a much more pronounced effect on increasing the workforce
As a reminder, last month's CPI increase was driven mainly by energy and shelter cost increases (60% of the increase), along with transportation costs, mainly insurance. These factors could certainly be sticky again, but it will be the breadth of components accelerating or decelerating that we will be watching more closely. If disinflationary progress is truly stalling, and the “last mile” to the 2% target requires a more restrictive stance, then we will expect the Atlanta Fed’s Sticky Price CPI and Cleveland Fed’s Median and Trimmed Mean measures to reaccelerate, something that did not occur in February. Until that meaningfully occurs, January and February’s CPI data remains “bumps in the road.” Further, the disinflationary progress seen on the service sector side in February’s PPI report should continue with reduced pricing power likely outweighing renewed cost/wage pressures. Finally, the Fed focuses on PCE, and core and supercore PCE measures were much more in line with the Fed’s 2% target than CPI in February, something we feel the market has lost sight of. If core CPI is in line with consensus and the final demand for service costs in PPI is flat again, then core PCE will likely be between 0.1% and 0.2% MoM, which will significantly put policymakers at ease.

*Due to how shelter is accounted for and other more marginal differences, PCE has been notably below CPI readings

*ISM service sector PMI report showed reduced inflationary pressures, which is more important than increases seen on the manufacturing side

*ISM price measure has led core PCE service prices
As we explored in a post a few weeks back, labor markets are not as tight as the stronger-than-expected headline NFP result in March would indicate. Manufacturing and service sector PMI readings for March continued to indicate hiring intentions were negative, especially at the current level, while finding qualified workers was no longer as challenging. Of the 54 individual sub-index labor-related business survey measures we monitor (from ISM, regional Fed PMIs, and NFIB), 65% are weaker than they were six months ago. Further, consumers’ job confidence is also weakening, and, combined with reduced turnover (as seen in JOLTs data and business comments), wage growth should continue to normalize as the worker/capital negotiation power balance normalizes. In the end, if wage pressures are declining, not only are cost-push inflationary pressures subsiding for the service sector but there is also reduced real disposable income growth for the worker/consumer, reducing demand-pull pressures.

*Although mixed across consumer surveys, on aggregate, job sentiment is becoming more negative

*High levels of turnover and inability to find qualified workers drove wage increases during an inflationary period. We are now increasingly in the opposite of that
In summary, supply-side improvements, especially in labor, will give the Fed the confidence that inflation will move to target in a timely manner. If things go as we expect over the next few months, the economy will see reduced discretionary spending (increasingly reflected in weaker higher frequency data and retail sales) and renewed disinflationary progress driven by the service sector. Further, current leading weaker hiring intentions will result in future lower payroll gains. This will allow Fed policymakers to frame three rate cuts this year as keeping policy consistent and not a pivot to ease from its current restrictive level. The growing consensus that the economy is simply bigger (hence the level of non-inflation accelerating payroll gains is much higher) and experiencing a stronger level of productivity due to technological advancements (hence higher growth is not as inflationary as previously thought) will gain traction among the more hawkish Fed policymakers, especially if monthly core PCE prints average 0.2%, as was the case between July and December last year.

*Small businesses' hiring intentions continue to fall. Will payrolls follow?

*Consumer headwinds are growing, especially for lower-income cohorts, although spending remains strong for higher-income ones.
What does this all mean for markets? While we are sympathetic to the argument that the Fed’s r* level is now structurally higher due to changes to global trade, geopolitics, growing fiscal deficits, and changing technologies, we aren’t in the business of long-term pontifications given the voodoo economics around the subject. What we are focused on is what the Fed will do with policy this year, which is a much more reasonable time frame to forecast. We believe disinflationary progress will continue, labor markets will loosen further, and growth will trend lower. With this in mind, we see yields going lower across the curve. We also see equities as likely to be more rangebound, with a more neutral Fed policy outlook offset by renewed margin pressures and weaker demand weighing on earnings growth expectations. Interestingly, the dollar will also remain rangebound, in our opinion, with the $DXY bouncing between 103 and 105 as a more neutral Fed outlook over the next two-quarters offsets continued geopolitical worries and more favorable interest rate differentials.

*Portfolio performance has been flat, with our bias to still be short equities and long Treasuries, while our gasoline short is down slightly.
As always, thank you for reading, and please share our newsletter if you like it and know others who may enjoy it. Please feel free to reach out with any questions or comments. – Michael Ball, CFA, FRM
Technicals, Positioning, and Charts:
The Russell has outperformed the Nasdaq and S&P over the last five trading sessions. Real Estate, Energy, and Utlities were the best-performing sectors, while Small-Cap, Growth, and Value were the best-performing factors. Small-Cap Value was the best-performing size/value combo.

@Koyfin
S&P optionality strike levels have the Zero-Gamma Level at 5172 while the Call Wall is 5300 and the Put Wall is 5000.
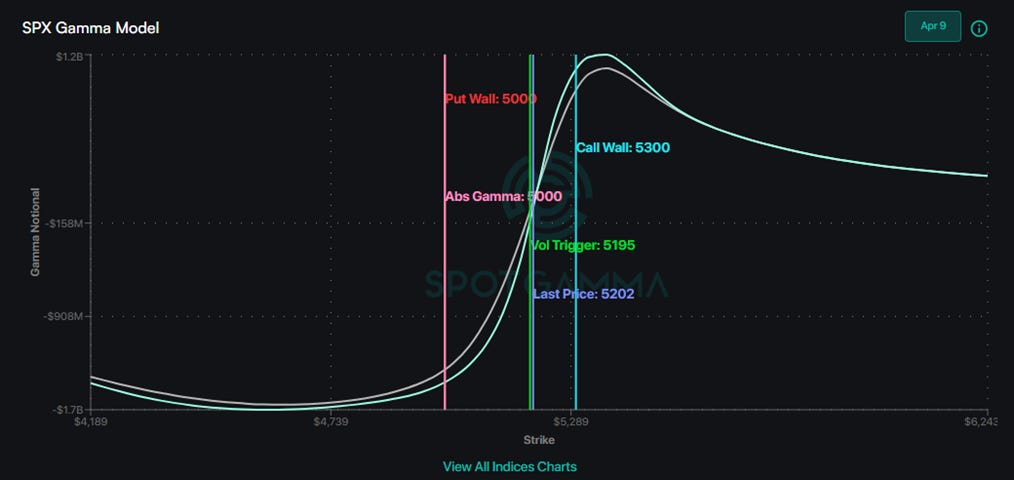
@spotgamma
S&P (/ES Futures) technical levels have key support at 5230, then 5195, with resistance at 5260, then 5305.

@AdamMancini4
Treasuries are higher on the day, with the 10yr yield around 4.37%, while the 5s30s curve is slightly steeper on the session, moving to 13 bps.

Charts:

BofA’s bullish/neutral signals are at a 30-month high, implying an almost synchronized global growth upturn. – BofA

"We are at the cusp of a period when seasonality stops being a tailwind for inflows and goes flat." – Deutche Bank

Goldman sees share buybacks driving demand for stocks this year.

Concentration risks remain extreme. – Truist Advisory Services
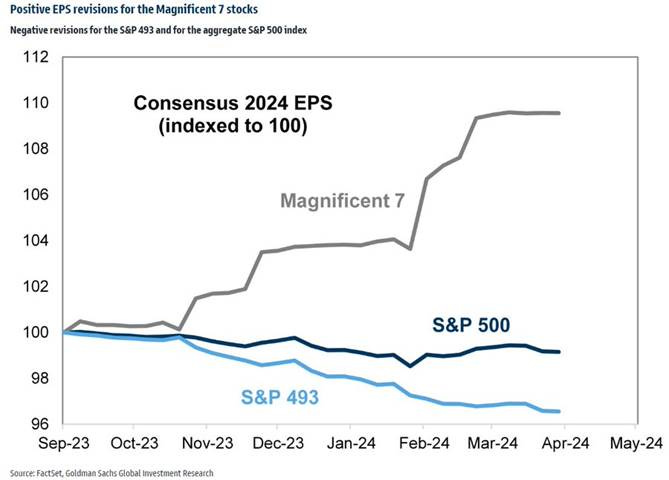
There has been negative earnings revisions for the S&P 493 and for the aggregate S&P 500 index. – @MikeZaccardi

"Performance has pushed the weight of riskiest assets (equities and credit) in all mutual fund & ETF portfolios close to peak levels." – Societe Generale

"The top 10% of US households have around $100T of assets, with around $30T holdings of equities and mutual funds, $20T in real estate, and nearly $14T in private businesses. This means the top 10% own roughly 10 times as many assets as the bottom 50%." - George Goncalves – MUFG

Ned Davis Research's Daily Commodity Sentiment Model is at its highest (most optimistic) since March 2016.

Gasoline futures indicate that the price at the pump should increase.

"A gauge of non-commercial trader positions — a group that includes asset managers as well as hedge funds and other speculative market players — is now the most long since 2022." – Bloomberg

China’s Service PMI improved slightly in March.
Appendix: Policy Talk, U.S. Econ Data Summaries, and Articles by Macro Themes
Policy Talk:
Last week brought another full slate of Fed speakers, with the message remaining generally consistent. Each policymaker generally remained consistent with their own economic and policy outlook/messaging expressed in prior communications. Chairman Powell gave prepared remarks at an event at the Stanford Business School, where he didn’t change his views from the March FOMC presser and Humprey Hawkins Congressional testimony. He noted that recent readings on inflation and job gains have been stronger than expected, leaving him needing further proof that inflation would reach the Fed’s 2% target in a timely manner. “Given the strength of the economy and progress on inflation so far, we have time to let the incoming data guide our decisions on policy,” Powell said in the opening remarks ahead of a fireside chat. Governor Kugler gave prepared remarks on the economy and policy, noting she believes further disinflationary progress could be made without significant pain to the labor market. She highlighted that higher levels of labor supply can keep wage growth contained, something she sees as the primary cost to service sector businesses. “If disinflation and labor market conditions proceed as I am currently expecting, then some lowering of the policy rate this year would be appropriate,” she said. Dallas Fed President Logan voiced concern that deflationary progress was slowing in prepared remarks at Duke University. “My bottom line is that while the benign path back to price stability remains possible, I see meaningful risks to continued progress,” Logan said. She speculated that the neutral rate may have moved higher due to advancements in technology, higher deficit levels, and higher productivity growth, and hence, policy was not restrictive enough. However, she acknowledged that “immigration and innovation have continued to support the supply side of the economy.” Philadelphia Fed President Harker stated that inflation was still too high, and the Fed was not “where we need to be.”

In prepared remarks, Richmond Fed President Barkin believes the Fed can continue to be patient and is confident that the current stance of policy would further slow the economy. However, he needs to see broader disinflationary progress to have the confidence that cuts are warranted. He noted that “while I do hear price-setters increasingly convinced that the era of significant pricing power is behind them, the inflationary experience of the last two years has surely given them more courage to use price as a lever.” Chicago Fed President Goolsbee noted that this year's stronger inflation readings have not changed his views on the broader disinflationary trend. “My overall assessment is that these two months should not knock us off the path back to target,” Goolsbee said in prepared remarks, adding that economic activity right now does not resemble a traditional overheating of demand as more robust immigration is bringing labor markets into a better balance while also supporting higher growth in a non-inflation accelerating way due to gains in productivity growth. He added that the biggest danger to the inflation picture was the continued high inflation in housing services, which continues to run higher than it was before the pandemic, something he expected to come down more than it has. Atlanta Fed President Bostic said the Fed should not cut rates until the end of this year in an interview on CNBC. “If the economy evolves as I expect, and that’s going to be seeing continued robustness in GDP, unemployment, and a slow decline of inflation through the course of the year, I think it would be appropriate for us to start moving down at the end of this year, the fourth quarter,” he said on “Squawk Box.” He noted that his more hawkish stance was due to inflation not moving much in recent months and “some secondary measures in the inflation numbers that have gotten me a bit concerned that things may move even slower.”

Governor Bowman gave three speeches this last week, one broadly on regulation and the Fed’s role in promoting liquidity, a second on how mergers and acquisitions will affect the banking industry's future, and a third reviewing her views on the economy and policy. Being one of the most hawkish FOMC member, Bowman highlighted the risk that the Fed may have to hike again, given that “progress on lowering inflation has stalled.” San Francisco President Daly noted that three rate cuts in 2024 were still a reasonable baseline forecast, though the Fed could remain patient. “I think that is a very reasonable baseline,” Daly said Tuesday during an event in Nevada. For now, “Growth is going strong, so there’s really no urgency to adjust the rate,” she said. Minneapolis Fed President Kashkari reiterated his view that two rate cuts would be appropriate for 2024 but said, “If we continue to see inflation moving sideways, then that would make me question whether we needed to do those rate cuts at all.” He emphasized the importance of letting inflation data guide interest-rate decisions. Cleveland Fed President Mester said she continued to pencil in three rate cuts this year if the economy evolved as expected in prepared remarks at a NABE conference in Cleveland. She expected the pace of disinflation to slow and hence did not see a reason to change her outlook based on stronger inflation readings in the first two months of this year. She noted there continued to be a better supply and demand balance in labor and goods markets. Mester said, "A year ago, firms were saying that they anticipated wage increases would be 5%. Now, when you talk to them, it's 3.5 to 4%. That kind of process is going on, and I think that'll continue, and we'll get back to better balance in the labor market." However, Mester acknowledged she raised her long-run fed funds rate to 3% from 2.5% in the recent March SEPs.
“There may be more supply-side gains to be had… Surveys of businesses still show difficulties in hiring people, difficulties in getting the inputs they need for their businesses — so, there’s some more benefit there.” - Powell
“Importantly, given the strong labor supply growth, supply-demand imbalances can continue to ease even amid a solid pace of net job growth, as we have been seeing. Indeed, I suspect that strong population growth helps resolve the puzzle that forecasters have faced over the past year, in which measures of labor market growth—and growth of other economic variables, like consumption—have been solid even amid easing inflation.” - Krueger
“You might be a demand pessimist. Monetary policy works with a lag, and you might take a signal from the recent increase in consumer delinquencies and the challenges in commercial real estate. You might worry about weaknesses in other interest-sensitive sectors as well, like banking, residential real estate, manufacturing, and home improvement. You might note that nearly three-quarters of last year’s job gains came from just three sectors — health care and social assistance, leisure and hospitality, and government — and worry that the labor market might be nearing a turning point. Or perhaps the risk of geopolitical shocks keeps you up at night.” – Harker
“Given the uncertainties, I’m not ready to put higher trend productivity in my baseline outlook. However, the risks to productivity appear clearly skewed to the upside. Stronger productivity growth would open space for economic activity and wages to rise without generating above-target inflation.” – Logan
“With inflation now moving closer to our goal, the risks to achieving both parts of our dual mandate have become more balanced. When we were tightening policy, we needed to focus on the inflation part of our mandate, because inflation was so high and the labor market was strong. Now, risk management with respect to both parts of our mandate will need to be the hallmark of monetary policy decisions going forward.” - Mester

Total consumer credit increased by $14.12 billion in February, compared to a downwardly revised $17.68 billion rise in the previous month and compared to market expectation of a $15 billion growth. Total credit is higher by 3.4% on an annual basis. Revolving credit increased by $11.2 billion on the month, higher by 10.2% on an annual basis. Non-revolving credit increased by $2.8 billion, which is higher by 0.9% on an annual basis.

*Total credit net monthly changes remain rangebound

*Credit card debt as apercentage of disposable income is normalizing
NY Fed’s March Survey of Consumer Expectations showed that one year ahead, inflation expectations remained unchanged at 3%. The median three-year ahead inflation expectations increased to 2.9% from 2.7%, whereas the median five-year ahead decreased to 2.6% from 2.9%. Overall inflation uncertainty was little changed, with home price (3%) appreciation expectations unchanged, while expected increases in gas (4.5%) and food (5.1%) prices rose slightly, and medical care (8.1%) jumped by 1.3 percentage points. Uncertainty among those aged 40 to 60 about the pace of inflation three years from now rose in March to the highest level in survey data back to 2013. Labor market readings showed expected earnings (2.8%) growth unchanged, unemployment expectations (36.2%) unchanged, the perceived probability of losing one’s own job (15.7%) higher, and the probability of finding a job (51.2%) worse. Household finance readings showed income growth (3.1%) unchanged, spending growth (5%) slightly lower, and perception of credit access improved slightly, but the ability to make debt payments worsened. The perception of households' current financial situation improved, while the future outlook was unchanged.

*Inflation expectations were little changed

*Ability to make debt payments worsened despite access sentiment improving
U.S. Econ Data Summaries:
The Non Farm Payrolls Report for March showed the economy added 303K jobs, the most in ten months, compared to a downwardly revised 270K in February and forecasts of 200K. January data was revised higher, with employment in January and February adding 22K more than previously reported. In March, the largest job gains occurred in health care (72K), government (71K), leisure and hospitality (49K), and construction (39K). Employment showed little or no change in other major industries. The unemployment rate declined to 3.8% in March from the previous month's two-year high of 3.9%, missing market expectations of unchanged. The U-6 unemployment rate was unchanged at 7.3%. The participation rate increased to 62.7% from 62.5% in the prior month, with the civilian labor force increasing by 469K to 167.9 million. Average hourly earnings increased by 0.3% MoM in March after an upwardly revised 0.2% increase in February. Over the past 12 months, average hourly earnings have increased by 4.1%, following a 4.3% advance in the prior month and matching market estimates. Finally, the average workweek increased by 0.1 hours to 34.4 hours in March, which was in line with market forecasts.
Key Takeaways: The main takeaway is that the higher-than-expected NFP print (and revisions higher for January) left markets reducing their Fed cut expectations, moving the odds of a June cut below 50%. The optics are simple: employment gains remain elevated by historical standards, surpassing the modeled 70K to 100K needed monthly to keep up with the expanding working-age population. As a result, the Fed does not need to change policy as it is not restrictive enough to warrant a below-trend period of growth needed to suppress demand enough to move inflation back to target, as indicated by the belief that high levels of job creation lead to inflation. We feel this narrative is wrong. There has possibly been a greater structural change in our economy than understood, with high immigration levels and stronger worker productivity leading to the current high job creation dynamics being less inflationary than textbooks would dictate. With the household survey showing that the civilian labor force has increased, the new non-inflation-accelerating levels of NFP job growth per month could be much higher. Markets are still “shocked” by the higher print, but in reality, a larger population and better productivity mean the supply-side benefits from more workers may outweigh the increased demand from higher aggregate income levels. Add in the reduced level of turnover seen in the JOLTs report and business surveys indicating a better ability to find and retain workers, reducing wage pressures, and despite the high NFP print shock, the March jobs report is not indicative of a tightening labor market. Overall, the labor force continues to move into a non-inflation-accelerating balance of supply and demand. Further, at a more micro level, leisure and hospitality have returned to its pre-pandemic level. This area has been pushing wages higher until recently, and it will likely be a more negative contributor moving forward if discretionary spending normalizes. Job growth in March was again concentrated in a few industries versus a broader pulse. Finally, March’s jobs reports illustrate why monthly changes (and even short-run trends) in household employment are tough to interpret. March’s 498K surge in household employment followed declines in each of the prior three months averaging 299K per month, and the jump in March did not resolve the discrepancy in strong NFP growth versus soft household employment. NFP has risen an average of 244K per month over the last year, whereas household employment is up only 54K per month over this same period.

*NFP beat expectations by around +100K

*Job gains remain concentrated in three sectors: Leisure and Hospitality, Healthcare, and Government.

*There has been a growing level of part-time employment

*The household survey bounced higher in March after two months of weakness

*The unemployment rate was little changed, with an almost equal amount of new workers entering the workforce and also finding jobs on the month

*The participation rate looks to be topping after rising from pandemic lows over the last four years

*Wage growth continues to trend lower, although goods-providing industries have been moving sideways
The number of job openings increased by 8K from the previous month to 8.756 million in February, above market expectations of 8.75 million. The job openings rate was unchanged on the month at 5.3%. Job openings increased in finance and insurance (+126K), state and local government, excluding education (+91K), and arts, entertainment, and recreation (+51K). On the other hand, job openings decreased in information (-85K) and in the federal government (-21K). Regarding regional distribution, job openings fell in the Northeast (-2K), the South (-62K), and the Midwest (-9K) but rose in the West (+81K). The number of hires rose to 6.06 million (vs. 5.69 in Jan), moving the hires rate to 3.7% (vs. 3.6% in Jan). Total separations increased slightly to 5.55 million (vs. 5.45), keeping the separation rate at 3.5%, with the quits rate also unchanged at 2.2%. The layoffs rate edged higher to 1.1% (vs. 1%).
Key Takeaways: February’s report showed that openings, hires, and quits all ticked up slightly, even as layoffs rose, too. The data, although lagged, suggests a stable labor market continues. The openings-unemployed ratio, a key metric for Fed officials, fell below 1.4, with the most recent reading at 1.36 (2nd lowest since Aug 2021). The labor market remains tight on this metric but only slightly tighter than pre-pandemic levels (the ratio was around 1.2 in 2019). Meanwhile, the stable quit rates suggest a reduced turnover level, which implies a moderation in labor cost growth that will help ease broader inflation fears. The smallest reporting businesses (1-9 employees) continued to report the highest job openings rate at 8.1%, unchanged from January. These are also the types of businesses most likely to keep ghost openings to appease overworked existing employees. The hires rate was highest in firms with 10-49 employees, increasing to 4.5%(vs. 4.1% in Jan). The quits rate was highest in mid-sized firms, and so was the layoff rate. Although the layoff rate was little changed, it did increase somewhat more notably for construction (2.6% vs. 2.3%), leisure and hospitality (1.8% vs. 1.1%), and information (0.9% vs. 0.6%).

*Openings are trending lower at a slower pace, with gains in the West offsetting declines elsewhere

*Construction openings continue to trend higher, while retail fell notably

*The number of quits ticked up slightly, although the quits/UE ratio declined

*Quits to hires are also back to a more normal pre-pandemic level
The Challenger Jobs Report showed firms cut 90,309 jobs in March, compared to 84,638 in February. The government announced 36,044 job cuts, the highest monthly total since September 2011. Technology companies announced 14,224 cuts in March. In Q1, companies announced plans to cut 257,254 jobs, down from the 270,416 cuts announced in Q1 2023 but up 120% from the 117,163 in Q4 2023. The leading reason for job cuts in Q1 was “Cost-Cutting,” which accounted for 66,302 reductions, followed by “Restructuring.” Employers announced plans to add 36,795 positions in the first quarter, a 48% decrease from the 70,638 hiring plans announced during the same period last year. This is the lowest number of announced hiring plans since 2016.
Key Takeaways: Layoffs increased in the first quarter, picking up in March from February by 7%, compared to the fourth quarter. However, the 2023 first quarter total was still lower than the 2022 first quarter. With that said, the breadth of layoffs across industries seems to be broadening, as technology drove last year's cuts. While this year has seen nearly equal amounts, they are still concentrated in a few industries. There is also a lack of a clear macro narrative message in which industries cut more or fewer. “Layoffs certainly ticked up to round out the first quarter, though still below last year’s levels. Many companies appear to be reverting to a ‘do more with less’ approach. While Technology continues to lead all industries so far this year, several industries, including Energy and Industrial Manufacturing, are cutting more jobs this year than last,” said Andy Challenger, Senior Vice President of Challenger, Gray & Christmas, Inc.

*Job cuts in March ticked higher, with consistent gains each month throughout Q1

*Cost-cutting is the main reason for job layoffs this year so far
The ISM Services PMI declined to 51.4 in March from 52.6 in February and below forecasts of 52.7. Business Activity (57.4 vs. 57.2) was stable, with twelve industries reporting expansion, but demand measures weakened, with New Orders (54.4 vs. 56.1) cooling but still expansionary, with eleven industries reporting growth. New Export Orders (52.7 vs. 51.6) expanded at a stronger pace. However, only five industries reported expansion in orders. The Backlog of Orders (44.8 vs. 50.3) moved back into contractionary territory, with six industries reporting expansion. Supplier Deliveries (45.4 vs. 48.9) shortened at a faster pace, and Imports (52.4 vs. 54.3) expanded at a slower pace. Inventories (45.6 vs. 47.1) contracted for the fourth month, with only three industries reporting increases, while Inventory Sentiment (55.7 vs. 56.7) cooled slightly but still indicated that respondents feel inventories are too high. Employment (48.5 vs. 48) changed little, with six industries reporting an increase in employment in March. Finally, Prices (53.4 vs. 58.6) rose at a reduced rate, with 12% of respondents indicating lower prices (a recent high), although thirteen service industries reported an increase in prices paid.
Key Takeaways: The March report showed that twelve service sector industries reported growth, but generally at a slower rate. Anthony Nieves, ISM Chair, said, “The decrease in the rate of growth in March and the decline in the composite index is a result of slower new orders growth, faster supplier deliveries, and a contraction in employment. The report continued to reflect growth month over month. Respondents indicated continuing improvement in logistics and the supply chain. Employment challenges remain a combination of difficulties in backfilling positions and/or controlling labor expenses. The Prices Index reflected its lowest reading since March 2020, when the index registered 50.4 percent; however, respondents indicated that even with some prices stabilizing, inflation is still a concern.” Selected respondent comments skewed more positively but varied by industry. Notable comments included, “Stronger sales and improving guest traffic resulting in increased employee hours” and “General business activity is good — inflation trend is downward, employment is strong, and investors have positive feelings” regarding business activity. Regarding labor conditions, respondents noted “Attrition and slow backfill approval processes” and “Still working through year-end retirements and positions still not filled.” Despite this, labor was reported as a commodity that was up in price for the fortieth month and in short supply for the second.

*ISM Service PMI moved closer to neutral in March

*Employment reading moved slightly higher while inflation fell notably

*Overall activity stayed elevated, but the majority of other sub-indexes fell

*Selected comments did not skew in any particular direction
The ISM Manufacturing PMI increased to 50.3 in March, up from 47.8 in February and beating market expectations of 48.4. Demand and activity measures were broadly stronger during the month. New Orders (51.4 vs. 49.2 in Feb) moved back above 50, with twelve industries reporting growth. New Export Orders (51.6 vs. 51.6) were unchanged and expansionary, with eight industries reporting growth, while the Backlog of Orders (46.3 vs. 46.3) was also unchanged and still contractionary, with only three industries reporting growth. Production (54.6 vs. 48.4) notably rose, moving into expansionary territory, with 13 industries reporting growth. Supplier Deliveries (49.9 vs. 50.1) were marginally faster, with respondents indicating that logistics continued to improve. Inventories (48.2 vs. 45.3) contracted at a slower rate, with three of the big six industries increasing their stock. Customer Inventories (44 vs. 45.8) decreased at a faster pace, with respondents saying their customers continue to have shortages of their products. Imports (53 vs. 53) were unchanged and expansionary, with seven industries reporting growth. Employment (47.4 vs. 45.9) contracted at a slower rate but remained negative for six months now, with eight industries reporting employment growth and many respondent comments noting intentions to reduce headcounts. Prices (55.8 vs. 52.5) increased at a faster pace, with eleven industries reporting rises. Finally, the average commitment lead time for Capital Expenditures in March was 176 days, a decrease of one day compared to February.
Key Takeaways: March’s above 50 reading marks the first expansion in the manufacturing sector after 16 months of contraction. Nine industries reported growth in March, which was led by textile mills, nonmetallic minerals, paper products, and petroleum. Six contracted, including furniture, plastics and rubber products, and electrical equipment. “Demand remains at the early stages of recovery, with clear signs of improving conditions. Production execution surged compared to January and February,” Timothy Fiore, chair of the ISM Manufacturing Business Survey Committee, said in a statement. He went on to say, “Thirty percent of manufacturing GDP contracted in March, down from 40 percent in February. More importantly, the share of sector GDP registering a composite PMI calculation at or below 45 percent — a good barometer of overall manufacturing weakness — was 1 percent in March, the same as in February but categorically healthier than the 27 percent recorded in January.” Overall, despite the increase in the price reading, the continued improvement in “supplier performance,” seen in the reading and comments, as well as no change in still contracting backorders, indicates that inflationary pressures are potentially more subdued than the outright price reading indicates. Further, respondents continued to reduce headcounts through layoffs, which accounted for 76% of reduction activity in March versus 50% in February, although comments were more 50/50 on adding and reducing personnel.

*Notable jump higher in the overall PMI reading with six of the sub-readings improving

*Increases in the production reading were notable, while employment was still contractionary

*Five out of ten sub-readings are in expansionary territory

*Comments were notably more upbeat on Q2 expectations
New orders for manufactured goods increased by 1.4% to $576.8 billion in February, following an upwardly revised -3.8% decline in January and above market expectations of a 1% increase. Excluding transportation, factory orders rose by a softer 1.1% MoM (vs. -0.6% MoM in Jan). Durable goods industries increased by 1.3% MoM (vs. -6.9% MoM), lifted by transportation equipment (3.3% MoM vs. -18.3% MoM), machinery (1.9% MoM vs. -0.8% MoM), and fabricated metal products (0.8% MoM vs. -1.2% MoM). Core capital goods increased by 0.7% MoM (vs. -0.4%). Nondurable goods industries increased by 1.6% MoM (vs. -0.8% MoM). Total shipments increased by 1.4% MoM (vs. -0.8% MoM), with core capital goods shipments decreasing by -0.4% MoM (vs. 0.8% MoM). Total unfilled orders were unchanged for a second month, while inventories rose by 0.3% MoM (vs. 0.1% MoM).
Key Takeaways: There was a rebound in manufacturing activity in February, with a partial retracement in new orders and stronger shipment activity after notable declines in January. Increases in core capital and consumer goods indicated that the strength went beyond a rebound in transportation activity due to the resumption at Boeing.

Construction spending declined by 0.3% in February, following a 0.2% decrease in the previous month and missing market expectations of a 0.7% rise. Total private construction was unchanged, while total public construction declined by -1.2% MoM due to declines in educational (-1.8% MoM) and highway and street (-1.6% MoM). Private residential construction increased by 0.7% MoM due to rises in single-family (1.4% MoM), while multifamily (-0.2% MoM) was little changed. Private nonresidential declined by -0.9% MoM, driven lower by broad declines. Manufacturing construction declined by -0.6% MoM (the third month of declines in a row).
Key Takeaways: February’s decline is the second consecutive monthly decrease in total construction spending, led by broad total public and private nonresidential construction declines. The broad categorial declines were likely not weather-induced, as may have been the case in January. As a result, it is possible construction will be a reduced tailwind for growth in the coming months (despite manufacturing picking up) as fiscal incentivized spending and reduced private sector fixed-asset investment cool construction starts.

*Nonresidential construction looks to have peaked while residential, driven by single-unit, continues to trend higher
The NFIB Small Business Optimism Index declined to 88.5 in March, the lowest since December 2012, and it was below forecasts of 90.2. 25% (+2 points since Feb) of owners reported inflation as their single most important problem. The Optimism Index declined to 88.5 (vs. 89.4), with hard components falling more than soft. The Uncertainty Index rose slightly to 77 (vs. 76).
Sales and Earnings: -10% (+3) reported higher sales in the past three months, while -18% (-8) expect higher sales. -29% (+2) of owners reported positive profit trends, with weaker sales (29%), rising costs (17%), and price changes (12%) being the main reasons for those reporting lower profits. For owners reporting higher profits, higher sales volumes (53%), usual seasonal change (23%), and higher selling prices (12%).

Labor and Compensation: 37% (unchanged) of owners reported job openings they could not fill, with the difficulty particularly acute in the transportation, construction, and services sectors, although openings fell in construction. 18% (+2) of owners reported labor quality as their single most important problem. However, labor costs as the single most important problem declined to 10% (-1). 11% (-1) of owners plan to create new jobs in the next three months. 38% (+3) of owners reported raising compensation, while 21% (+2) plan to raise compensation in the next three months.

Capital Spending and Inventories: 56% (+2) of owners reported capital outlays in the last six months, with new equipment (38%), vehicles (24%), and facilities (17%) being the largest reasons. 20% (-1) plan capital outlays in the next few months. -7% (-6) of owners reported inventory increases, with -5% (-1) viewing current stocks as “too low.” -7% (unchanged) of owners plan inventory investments in coming months.

Credit Markets: 2% (-1) of owners reported all their borrowing needs were not satisfied, 27% (+3) reported all were met, and 59% (-2) were not interested in a loan. 8% (+1) reported their last loan was harder to get, with 17% (+1) reported paying a higher rate on their most recent loan. The average rate paid on short-maturity loans was 9.8 percent, up by 1.1 points from last month, and 28% (+3) of owners reported borrowing on a regular basis.

Inflation: 28% (+7) of owners reported raising selling prices. Price hikes were most frequent in finance (61% higher, 10% lower), retail (54% higher, 6% lower), construction (51% higher, 4% lower), wholesale (50% higher, 17% lower), and transportation (44% higher, 0% lower) sectors. 25% (+2) of owners reported inflation as their biggest problem.

Key takeaways: The overall index indicated further negative sentiment for a third month from small business respondents. There was some divergence in sub-index readings, especially among the “softer” ones, with expected sales falling notably, but expectations for the economy to improve increased. Also, March’s report showed a large increase in the percentage of businesses increasing selling prices and, to a lesser degree, an increase in the percentage of firms raising compensation, leading to increased inflationary pressures. Further, inflation again became the single biggest business problem reported. At the same time, owners’ plans to fill open positions continued to slow, especially in the construction industry.

*The overall index declined; however, the business outlook became less negative

*There was a broad decline at the subindex level outside price and compensation measures

*The Optimism Index declined on the month again

*The Uncertainty Index was little changed but remained trending higher
Articles by Macro Themes:
Medium-term Themes:
China’s Rebalancing Act:
Steady Fix: China stuck to a pattern of keeping yuan weakness contained as pressure from a resilient dollar and poor investor sentiment pushes it toward a policy red line. Traders have been eyeing the fixing for signs of where Beijing wants to guide the yuan after it weakened to within a whisker of the edge of its trading range last week. China’s policymakers have been vigilant of currency pressure which can spill over to local stocks and bonds, despite the fact that the country’s export engine would benefit from a weaker yuan. - China Maintains Yuan Defense After Currency Nears Red Line - Bloomberg

Longer-term Themes:
The Singularity is Near (AI Developments) and Cyber Life (More Generally):
Legal Troubles: In recent months, Google has raced to settle a backlog of lawsuits ahead of major antitrust showdowns with the Justice Department later this year. On Monday, the company resolved its fourth case in four months, agreeing to delete billions of data records it compiled about millions of Chrome browser users, according to a legal filing. The suit, Chasom Brown, et al. v. Google, said the company had misled users by tracking their online activity in Chrome’s Incognito mode, which they believed would be private. Since December, Google has spent well over $1 billion to settle lawsuits as it prepares to fight the Justice Department, which has targeted Google’s search engine and its advertising business in a pair of lawsuits. - Google to Delete Billions of Chrome Browser Records in Latest Settlement - NYT

AI Guidelines: The U.S. government issued new rules Thursday requiring more caution and transparency from federal agencies using artificial intelligence (AI), saying they are needed to protect the public as AI rapidly advances. The new policy from the White House Office of Management and Budget (OMB) will guide AI use across the federal government. Among other things, it mandates that agencies establish guardrails for AI uses that could impact Americans’ rights or safety, expands what agencies share in their AI use case inventories, and establishes a requirement for agencies to designate chief AI officers to oversee their use of the technology. – AI Executive Order
The Demise of Unipolarity: A World of Rising Regional Sphere:
Making Choices: A survey of 1,994 Southeast Asians by the ISEAS-Yusof Ishak Institute published Tuesday shows China’s popularity in a head-to-head race with the US climbing from 38.9% last year to 50.5% in 2024. Among individual nations, Beijing garnered some three out of four votes in Muslim-majority Malaysia, Indonesia and Brunei. Southeast Asian nations have largely embraced the US as a necessary security presence as the Biden administration ramps up military-to-military cooperation in a bid to counter Bejing’s growing defense prowess. But the region also counts on China as a key financier and trading partner at a time regional leaders seek new investments to bolster their own economies. - China Topples US as SE Asia’s Favored Partner, Survey Shows - Bloomberg

Food: Security, Innovations, and Climate Change Implications:
Direct Exposure: A person who worked on a dairy farm and had “direct contact with dairy cattle” tested positive for avian flu in Texas late last week, the state’s Department of State Health Services said Monday. The case was confirmed by the U.S. Centers for Disease Control and Prevention over the weekend, the department said. The CDC said the person who has the H5N1 virus is recovering and was told to isolate. The department is working with local, state, and federal health partners to investigate the case and has issued an alert asking health care providers to monitor for any additional cases of avian influenza. “The case does not change the risk for the general public, which remains low,” the Texas Department of State Health Services said in a statement. - CDC confirms second reported case of bird flu in a person in the US - CNN

Automated Warfare:
Attacking Drone Factories with Drones: A Kyiv intelligence source said the attack on Tatarstan hit a facility where Russia produces Shahed drones, which are frequently used in assaults on Ukrainian territory. This comes after Ukraine’s military spy agency said “significant damage” had been caused to a military target.Reuters analysis of photographs posted online suggests that one of the drones also hit a unit at Tatarstan’s Taneco oil refinery which accounts for roughly half of its annual production capacity. - Russia-Ukraine war live: drones strike Russian factories more than 1,000km from Ukraine – The Guardian
Other Articles of Interest:
Rapid rises: Many Americans are worried about the seemingly inexorable rise in U.S. debt, whether government debt, household debt, or business debt. They are right to be concerned. Rapidly rising debt is a problem not just in the United States but in many other countries too, including China, parts of Europe, and most of the developing world. In today’s environment, it seems, reasonable levels of economic growth cannot be achieved unless boosted by even faster growth in debt. Long post by Michael Pettis on why rising debt isnt bad. - Why U.S. Debt Must Continue to Rise – China Financial Markets - Carnegie Endowment For International Peace

Excess Capacity: The U.S. and European Union are threatening to raise trade barriers to Chinese-made electric vehicles and renewable-energy gear. Now, emerging economies, including Brazil, India, Mexico and Indonesia, are joining the backlash, zeroing in on Chinese imports of steel, ceramics and chemicals that they suspect are being dumped on their domestic markets at knockdown prices.“China is too large to export its way to rapid growth,” Treasury Secretary Janet Yellen said Friday in Guangzhou, her first stop on a trip to China in which she repeatedly warned her hosts against revving up its economy by churning out cheap goods. “And if policies are oriented only at generating supply and not also at generating demand, global spillovers will result.” The growing resistance shows how the new China shock is stoking tensions in a global trading system already showing signs of fraying, thanks to Russia’s invasion of Ukraine and efforts by the U.S.-led West to boost domestic industries and untangle parts of their economies from China. - China Shock 2.0 Sparks Global Backlash Against Flood of Cheap Goods – WSJ

Pricey Insurance: U.S. home insurance rates are expected to reach a record high this year, with the biggest increases occurring in states prone to severe weather events, according to a new analysis. The average premium for homeowners insurance in the US is expected to hit $2,522 by the end of the year, driven largely by intensifying natural disasters, rising reinsurance costs and higher fees for home repair, according to Insurify, a Massachusetts-based insurance-comparison platform. That figure would represent a 6% increase over the average US premium at the end of 2023, and follows a roughly 20% increase over the past two years. Home insurance is becoming a flashpoint in the US as damage from thunderstorms picks up and as climate change increases the frequency and severity of natural disasters. - US Home Insurance Premiums May Hit a Record This Year, Report Warns - Bloomberg

Podcasts and Videos:
Economic Reforms In Argentina Under Milei - The First 100 Days - Fitch
Global Data Pod Weekender: Looking for a pickup in global capex – JP Morgan
Washington Weekly Podcast: US-China meetings, Trade policy, Ukraine aid - UBS
For Fun:
VIEWS EXPRESSED IN “CONTENT” ON THIS WEBSITE OR POSTED IN SOCIAL MEDIA AND OTHER PLATFORMS (COLLECTIVELY, “CONTENT DISTRIBUTION OUTLETS”) ARE MY OWN. THE POSTS ARE NOT DIRECTED TO ANY INVESTORS OR POTENTIAL INVESTORS AND DO NOT CONSTITUTE AN OFFER TO SELL -- OR A SOLICITATION OF AN OFFER TO BUY -- ANY SECURITIES AND MAY NOT BE USED OR RELIED UPON IN EVALUATING THE MERITS OF ANY INVESTMENT.THE CONTENT SHOULD NOT BE CONSTRUED AS OR RELIED UPON IN ANY MANNER AS INVESTMENT, LEGAL, TAX, OR OTHER ADVICE. YOU SHOULD CONSULT YOUR OWN ADVISERS AS TO LEGAL, BUSINESS, TAX, AND OTHER RELATED MATTERS CONCERNING ANY INVESTMENT. ANY PROJECTIONS, ESTIMATES, FORECASTS, TARGETS, PROSPECTS AND/OR OPINIONS EXPRESSED IN THESE MATERIALS ARE SUBJECT TO CHANGE WITHOUT NOTICE AND MAY DIFFER OR BE CONTRARY TO OPINIONS EXPRESSED BY OTHERS. ANY CHARTS PROVIDED HERE ARE FOR INFORMATIONAL PURPOSES ONLY, AND SHOULD NOT BE RELIED UPON WHEN MAKING ANY INVESTMENT DECISION. CERTAIN INFORMATION CONTAINED IN HERE HAS BEEN OBTAINED FROM THIRD-PARTY SOURCES. WHILE TAKEN FROM SOURCES BELIEVED TO BE RELIABLE, I HAVE NOT INDEPENDENTLY VERIFIED SUCH INFORMATION AND MAKE NO REPRESENTATIONS ABOUT THE ENDURING ACCURACY OF THE INFORMATION. I MAY OR MAY NOT HAVE POSITIONS IN ANY STOCKS OR ASSET CLASSES MENTIONED. I HAVE NO AFFILIATION WITH ANY OF THE COMPANIES OTHER THAN EXPLICITLY MENTIONED.