
The Dot Plot Thickens: Powell’s Dovish Message Increases Dual Mandate Focus with Higher Growth Expectations – Midday Macro – 3/22/2024
Color on Markets, Economy, Policy, and Geopolitics

The Dot Plot Thickens: Powell’s Dovish Message Increases Dual Mandate Focus with Higher Growth Expectations
Midday Macro – 3/22/2024
Market’s Weekly Narrative:
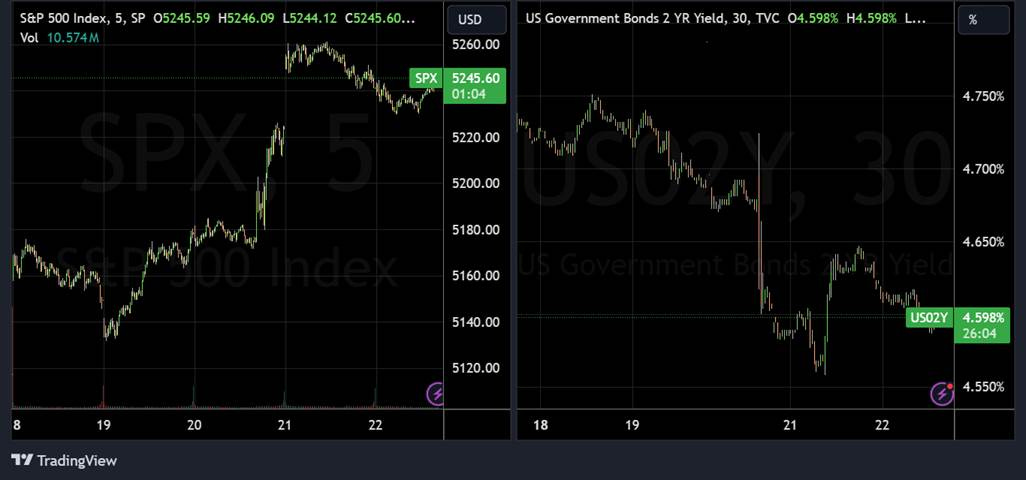
The S&P is ending a positive week on a more somber note after a post-Fed rally is losing some steam. Momentum and growth factors drove gains at the factor level, while communication, industrials, and discretionaries sectors outperformed. Homebuilders and semiconductors also performed well on the week. The main event of the week was the Fed’s ability to deliver a dovish message out of their March FOMC meeting despite upgrading their growth and, to a lesser degree, inflation outlook. Treasuries were higher on the week but, again, were not without volatility, especially in the long end, with the curve ending the week marginally steeper. The economic data calendar was on the lighter side, with S&P PMIs showing manufacturing activity reaccelerating while the service sector expanded at a reduced rate. Housing data was better than expected, with higher existing home sales showing some movement by previously low mortgage locked-in sellers. Of course, inventories still remain historically tight, keeping starts and homebuilder sentiment high. The Philly Fed Manufacturing Index was broadly unchanged, although there were broad improvements at the sub-index level. Outside the U.S., there were plenty of central bank moves, with policymakers generally signaling they expect the inflation slowdown to resume and maintaining their lower-rate outlook. The world’s nearly 12-year experiment with negative interest rates is over now that the last holdout, the Bank of Japan, moved its key policy rate back to at least zero. Two of the Bank of England’s most ardent hawks withdrew their support for interest rate hikes as the UK’s central bank voted for a fifth-straight meeting to keep policy unchanged at 5.25%. The Swiss National Bank became the first among global advanced market peers to cut interest rates, while Norway signaled no such move until the end of the year. The Reserve Bank of Australia said it still can’t rule out the possibility that interest rates will need to be raised further, adding that inflation remains too high and is expected to remain elevated for some time yet. There were also numerous EM policy actions. It was a busy week, to say the least.
Oil was relatively unchanged this week, with traders reaccessing the bullish exuberance last week. The increased likelihood of a peace deal in Gaza and the U.S. urging Ukraine to refrain from further attacks on Russian energy infrastructure reduced the geopolitical risk premium. Copper also fell on the week, as the picture out of China, whose central bank was one of the few not to change its tune, became more bearish while momentum was stretched. However, iron ore prices rebounded slightly, countering any more risk-off messaging copper indicated. The agg index was higher during the week, although grains, corn, and beans only changed slightly. Finally, despite the more dovish messaging from the Fed, the dollar was stronger on the week, with the $DXY close to 104.5. More dovish messaging from other central banks led to weakness in major crosses.

Headlines:

Deeper Dive:
The Fed continues to see supply-side normalization as driving inflation back to target, albeit in a “bumpy” manner. The improved outlook for growth and stable unemployment expectations, accompanied by no meaningful increase in inflation projections for this year, indicate that the Fed does not believe its policy is currently at a restrive enough level to elicit a below-trend period of growth, nor, as a collective, does it want that, despite what more hawkish individual policymakers have voiced. This has led markets to put a heavier emphasis on realized inflationary data in the coming months as the driver of future policy decisions. However, in the presser, Powell seemingly indicated he would be more closely watching labor market conditions, which, although still categorized as “tight,” he sees as potentially moving faster than inflation. This means the “totality” of the data is still very much being discussed around the FOMC table despite the recent firming in official inflationary data suggesting a reduced two-sided risk management approach to future policy decisions. Given our view that labor markets may begin to loosen faster than markets may expect over this year, we still believe June is the likeliest meeting for the Fed to start its easing cycle, although we expect more clarity on tapering asset sales coming out of the May meeting. We see disinflationary progress as likely continuing, albeit annual rates will now be more sticky due to harder monthly comparables. Still, reduced wage-spiral concerns and a greater focus on the full employment mandate will balance Fed policymakers’ rhetoric out more evenly moving forward, even if the “last mile” in the inflation fight proves to be harder than thought in the coming months.

*Monthly CPI increases will need to be below 0.3% to maintain a disinflationary downward trend

*Some measures of financial conditions indicate they are at very loose levels

*Rate sensitivity has been exceptionally low in the U.S. due to the low rate environment following the pandemic and the fixed rate nature of our mortgage market
Labor market readings are becoming more of a mixed bag, but the mosaic of what we see is indicating that we are starting to move out of a “tight” dynamic into a more neutral balance. Flow-related measures remain strong due to initial claims remaining historically low, although the job-finding rate, or the rate at which unemployed workers transition into employment, has materially weakened. Survey-based employer behavior measures such as job openings and hiring rates/plans have cooled the most. This has been clearest in the NFIB Small Business Survey and, to a lesser degree, in the ISM PMI surveys. Regional Fed surveys, although often volatile, have largely indicated reduced demand for workers, although differentials between current and forward readings have sometimes been notable, muddying the picture. Overall, utilization measures have cooled with a greater level of part-time for economic reasons as a percentage of the workforce, while marginally attached workers have grown. Wage data continues to convincingly trend lower, albeit from a still historically elevated level. With the quits rate falling and reduced levels of skilled worker shortages indicated as firms find workers more easily, this trend looks highly likely to continue in the medium term. Finally, consumer survey-based job confidence and perception readings have also cooled with workers’ perceptions of job availability weaker, although similar to business surveys, there is a level of volatility and often an inconsistent message there. In summary, the most widely watched measures of employment (NFP and claims) have been solid (although NFP has been prone to large negative revisions). Wage growth has continued to slow, and unemployment has steadily inched up from 3.4% last April to 3.9% in February. Layoff measures and announcements have grown while hiring intentions have, on aggregate, contracted. Further, the quits rate has dropped in line with the perceptions of job availability, while at the same time, firms see workers' availability as notably improved, balancing out wage negotiation powers.

*The Atlanta Fed’s Labor Market Spider Chart is showing broad moderation in various labor market metrics
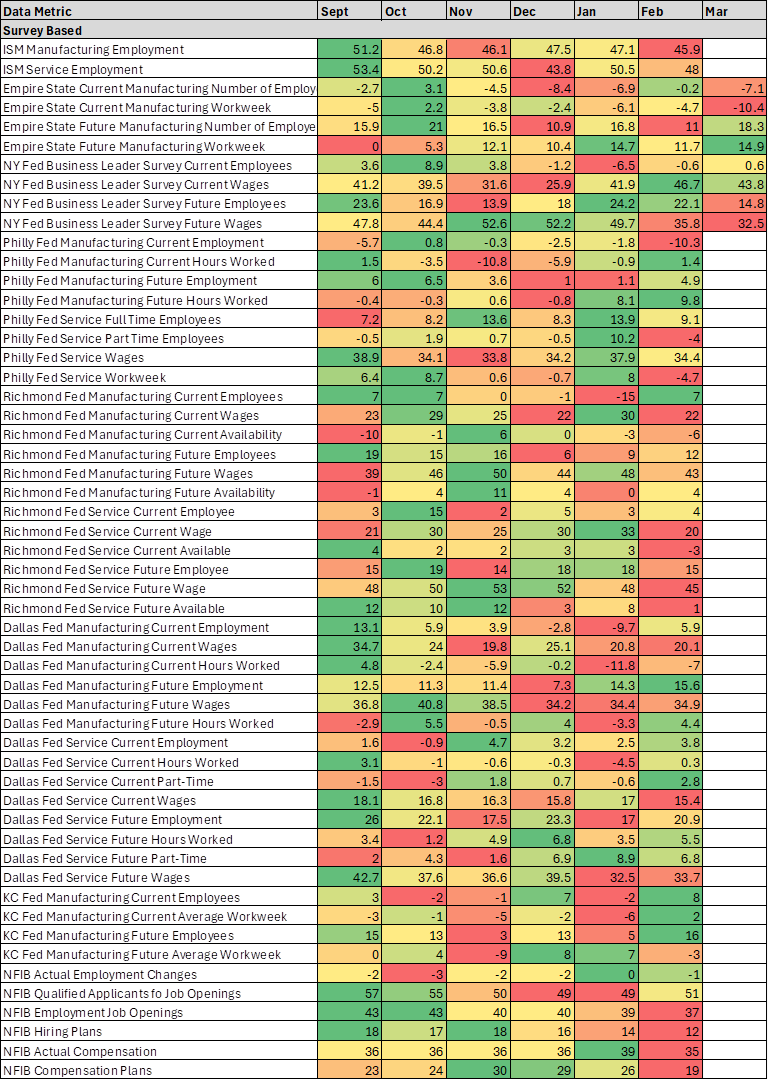
*Our own heat map on survey-based measures is less definitive but does indicate pockets of cooling
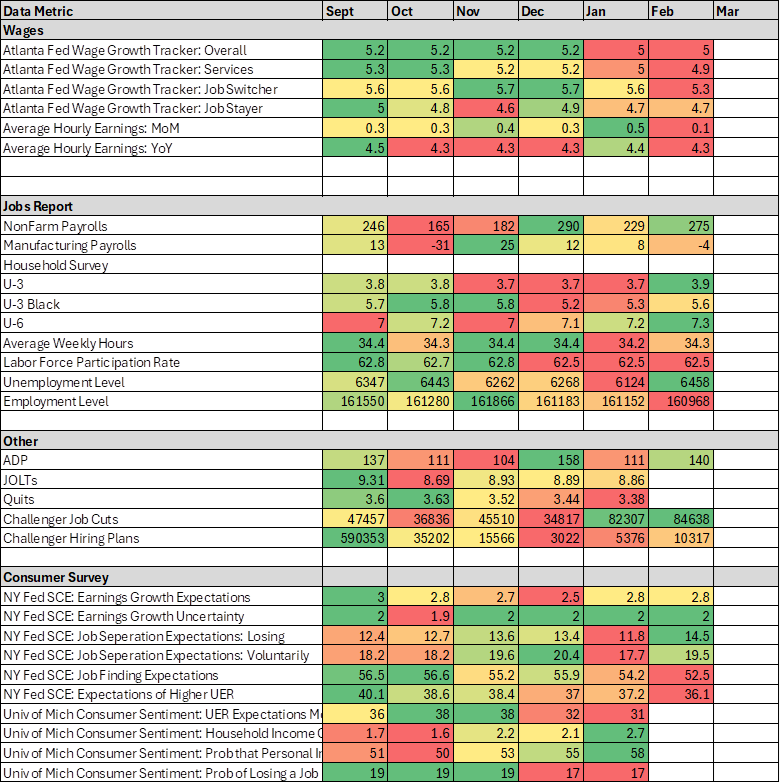
*Labor metrics elsewhere are more mixed, with wages notably lower in February, while the jobs report delivered a varied message
Putting it all together and focusing on what the Fed told us this week, hotter-than-hoped-for inflation readings this year aren’t bothering Fed officials as much as feared. Had Powell wanted to send a more hawkish message, he would have emphasized the increase in inflation forecasts rather than characterized recent higher readings as “bumps.” Powell also stressed that the dots aren’t a contractual commitment, and as we have seen, their predictive track record has been very poor. Further, the disconnect between stronger growth forecasts and still stable headline inflation and UER views shows Fed officials will be more responsive to weaker economic data, especially regarding labor markets, than hotter inflation data, altering the policy reaction function skew. As a result, the risk, in our view, is that the market is underpricing the number of cuts coming this cycle. Consumer spending is cooling by many measures, and the tailwinds that households had coming out of the pandemic in the form of a tight labor market and excess savings are fading. The recent better-than-expected economic activity driven by housing market activity could continue due to the structural supply shortage there but is not necessarily indicating a cyclical pick-up in demand from increased household formation. Further, this activity could be countered by reduced private and public fixed asset investment as firms increasingly become more defensive with capex plans in many industries. Overall, risk assets seem to be priced to perfection, with sentiment extremely bullish and positioning increasingly stretched. There looks to be an assumption that above-trend growth will continue based on supply-side improvements, and a soft landing is all but guaranteed. Instead, we believe that the effects of the tighter policy will increasingly weigh on domestic activity (increasingly through looser labor markets, as discussed) while the global backdrop is not rebounding as materially as many think and is fraught with geopolitical risks. As a result, earnings growth forecasts are too high (even with AI and greater productivity and increased cost-cutting initiatives in vogue), and we believe that although an outright recession may still be quarters away, equities and credit should reflect a more somber outlook. However, with the Fed increasingly taking a more two-sided risk management approach to its policy reaction function, any pullback in risk assets due to a deterioration in economic activity will be floored by increased easing expectations. This leaves us still tactically defensive, expressed through our short Russell index position and, to a lesser extent, our gasoline futures short (which we elaborate further on below). We closed our long Chinese equity and copper positions this week, given our worry that momentum has been lost there due to a more murky narrative. The high level of uncertainty regarding domestic stimulus effects and geopolitical risks makes us want to clip tactical gains when dealing with China quickly. We have also closed our long Euro position with a slight gain given the more dovish stance of the ECB expressed recently and weaker economic data persisting in February. Finally, we are adding a long two-year Treasury position through the June T-Note future (ZTM2024). This adds to our more defensive tactical bias currently, and we believe yields will fall more in the front end, given the views on the Fed we have expressed.
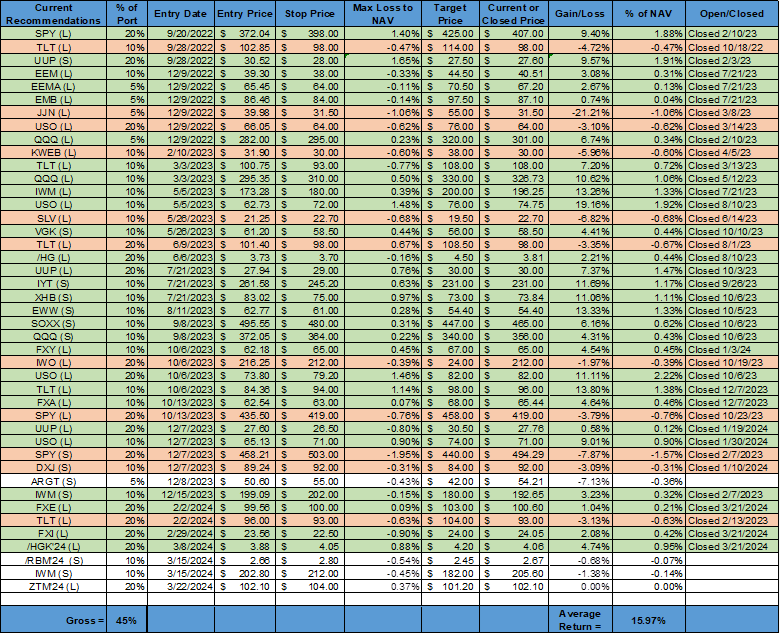
*We locked in positive gains in our China and long Euro trades while entering a long 2yr Treasury note position

*Economist and Barron's covers are always a sign that a tactical top may be near
Thoughts on Gasoline Future Prices…
Oil and gasoline futures prices are ending the week slightly higher after gaining around 3% last week due to views that demand was improving, supply was becoming more uncertain, and larger inventory drawdowns. The prospect of a ceasefire in the Middle East and a stronger dollar have caused momentum to fade this week, along with no further attacks on Russian energy infrastructure. A perception of lower U.S. gasoline demand by traders also helped temper prices, even though fuel inventories booked another weekly decline, per the EIA’s latest inventory report. Year to date, gasoline futures are higher by 30% thanks to bullish fundamentals. There was an unusually heavy maintenance period these past months as refineries, which finally had the needed labor and materials that were previously impaired by the pandemic, took on larger delayed projects. This followed a significant level of unplanned production outages, both for drillers and refiners, due to frigid weather at the beginning of the year. This lack of production and heavier maintenance period has led U.S. gasoline storage to fall to near historical seasonal lows, leaving little room for any further disruptions in what traders see as a tight market. Further, markets may get even tighter based on where octane blend component pricing is and the fact that summer RBOB-ULSD spreads are still negative, limiting gasoline yields and disincentivizing output increases. Finally, middle distillate inventories are also tight, and any further improvement in global manufacturing activity could boost diesel demand. The combination of all the events has supported gasoline future prices and moved near-term crack spreads wider.

*The pandemic disrupted deeper maintenance projects due to a lack of skilled workers and costly materials, while frigid weather weighed on January’s production

*Reduced production earlier in the year has driven inventory levels lower

*Lower supply and inventories have driven crack spreads higher
We believe that disruption to gasoline production earlier in the year has largely normalized while rising crack spreads will incentivize greater production due to better profitability. Furthermore, the higher price at the pump is starting to marginally weigh on demand, especially for lower-income cohorts showing greater signs of financial stress. We have a broader view that household consumption will normalize as the labor market becomes balanced, reducing discretionary spending, especially on leisure and hospitality, weighing on the summer driving season. To be clear, this is highly uncertain, and although retail sales have been trending lower and consumer confidence readings look to be losing momentum (likely due to higher gas prices and more neutral views on labor markets), betting against the resilience of the U.S. consumer has been a losing trade. Further, the IEA suddenly revised its global demand forecast to be higher, likely due to the uptick in global manufacturing PMIs. We are less certain this recent acceleration in global activity will have legs, instead seeing it as a restocking after a stronger holiday period. Firms will likely continue to be cautious about normalizing inventories due to uncertain demand moving forward. Turning to geopolitics, it does look like a ceasefire is possible, which may reduce tensions in the region, especially in the Red Sea. Specific to Russia, despite the attacks on energy infrastructure, lower refining capacity would lead to greater crude oil exports, helping keep net energy exports flat. As a result, we think the geopolitical risk premium is near its tactical high. Putting it all together, we have U.S. refiners more incentivized to increase gasoline production into what we view as a potentially overly exuberant domestic demand outlook. The resumption of production at the BP Whiting refinery will make a material difference. Globally, an excess supply balance in the oil market could materialize quickly, especially if OPEC+ loosens its quota stance and further production comes online in various countries, something we could envision with prices at current levels. Asia refineries are going into turnaround, and crack spreads there have been cooling, both reducing their ability and incentives to increase production. Nevertheless, inventories are high, and shipping costs may decline if a peace deal is reached, reducing global prices even if our view on demand cooling is wrong. To be clear, our short position on gasoline through RBOB futures is a contrarian trade, and we are betting against momentum, with technicals indicating an overbought condition. However, we think there should be a tactical correction and look to capture a 5-10% pull back in the next weeks.

*Global manufacturing PMIs have been rising, but we question the sustainability of this

*Global growth has largely been driven by a few places, and it is still unclear if momentum will sustainably change

*U.S. refinery inputs are rising, and capacity utilization is moving higher, increasing production levels and future supply

*Bigger picture, there is still room for more crude production in the U.S, which could drive energy prices lower globally
As always, thank you for reading, and please share our newsletter if you like it and know others who may enjoy it.
We will be off next week. Further, we are changing the time we publish to either Thursday or Monday, given our upcoming summer schedule changes. We are also receiving a lot of feedback that the piece is too long, so we will be working on continuing to consolidate and divide the piece, likely moving much of the policy and economic analysis into an end appendix while putting more emphasis on the “Deeper Dive,” and “Technicals, Positioning, and Charts” sections.
Please feel free to reach out with any questions or comments. – Michael Ball, CFA, FRM
Policy Talk:
The FOMC left the Fed funds target rate range unchanged at 5.25-5.5% at their March meeting and continued to indicate that three 25bp rate cuts are the most likely path ahead for 2024 in their updated Summary of Economic Projections. There was only one major change in the official statement, changing “…moderated since early last year but remain” with “remained” when describing U.S. job gains. Despite no change to the median estimate for the Fed funds rate at the end of 2024, there was a change in the distribution of expectations, with nine members lined up behind three cuts versus six in December and five expecting more than three cuts. One dot also shifted from two to one, so the median was very close to moving to an expectation for two cuts instead of three on the year. If we use the mean rather than the median, it rose by 11 basis points to 4.81%, which implies that two cuts from here are more likely than one. The forecasted levels of GDP growth over the next three years materially moved higher, with this year now moving to 2.1% from 1.4%, while the unemployment rate for 2024 and 2026 rose slightly. Finally, headline PCE inflation remained the same while core PCE for this year shifted slightly higher to 2.6%.

*Growth projection jumped higher compared to UER and PCE, while the expected level of Fed funds for ’25, ’26, and the long run all rose

*There were bigger moves higher in ’25 and ’26 and more of a consolidation for this year around three cuts
Powell made no hugely dovish pronouncements during the press conference statement and Q&A, unlike in December when he was rightly perceived to have more dovishly pivoted but declined to say anything hawkish, either. Powell conceded that inflation had been stickier than anticipated over the past two months and cautioned that policymakers shouldn’t be “dismissing data that we don’t like,” indicating that he believed there were seasonal factors at play, but it didn’t fully diminish the stronger readings. He also struck a more balanced tone, noting that the hotter inflation over the last two months after the better-than-expected disinflationary progress in the second half of last year “haven’t really changed the overall story, which is that of inflation moving down gradually on a sometimes-bumpy road toward 2%.” He did push back on recent official shelter readings again, noting greater progress in rent measures falling in non-official. Powell didn’t see the increase in the long-term medium-Fed funds level, or r*, as notable, dismissing it as noise. Powell still saw financial conditions as restrictive. He also elaborated on the coming taper of QT, noting it was still being discussed but likely to be announced in the coming meetings. He said there wasn’t a specific number for how they intended to slow runoff yet. He believed that a slower level of runoff might lead to a greater ability to shrink the balance sheet without stressing markets, noting liquidity can be uneven in the system. He hinted he would like to see a greater reduction in MBS, which, due to low prepayments, hasn’t fallen as much as Treasuries. Powell seemed confident the committee would be able to identify the proper “ample” reserve level, avoiding being too short reserves as was the case before. He also highlighted that once the RRP facility fell to zero, the Fed would have greater control over reducing reserves and determining the level that allows policy to function with the right level of liquidity.

Since there is always pressure to use binary categorization (dovish vs. hawkish), the presser was modestly dovish, but with the growth and inflation projections revised higher in the new SEPs, and hence more hawkish, the message was balanced with the Fed still seeing disinflationary progress intact but also believing that interest rates could be higher than previously thought over the longer term.
“But I would say the January number which was very high—the January CPI and PCE numbers were quite high. There’s reason to think that there could be seasonal effects there. But, nonetheless, we don’t want to be completely dismissive of it.”
“I also mentioned—and we don’t see this in the data right now—but if there were a significant weakening in the data, particularly in the labor market, that could also be a reason for us to begin the process of reducing rates again. There’s nothing in the data pointing at that, but those are the things that we’ll be looking at at the coming meetings, and without trying to refer to any specific meeting.”
“But I would say that the story is really essentially the same, and that is of inflation coming down gradually toward 2% on a sometimes bumpy path, as I mentioned. I think that’s what you still see. We’ve got nine months of two-and-a-half percent inflation now, and we’ve had two months of kind of bumpy inflation. We were saying that we’ll—it’s going to be a bumpy ride.”
“In many, many respects, things are returning more to their state in 2019, which we can think of as “normal” for this purpose. That’s job openings and quits. And surveys of workers and businesses are always interesting on this. You know, how tight is the—how easy is it to find a job? How hard is—how easy is it to find a worker? Those have both—those surveys have both come down. So the labor market’s in—it’s in good shape.”
Speaking to tapering: “And I think now we have a better sense of what are the indicators. It isn’t—it wasn’t so much in the banking system as it was around, for example, where federal funds is trading relative to the administered rates and where secured rates are relative to the administered rates—those sorts of things. We will always be watching the banking system for similar signs, though.”

The Atlanta Fed’s year-ahead business inflation expectations remained relatively unchanged at 2.4%, on average. Sales levels and profit margins "compared to normal" remained relatively unchanged over the month. However, year-over-year unit cost growth increased significantly to 2.8%, on average. The quarterly question asked firms' long-term inflation expectations to remain relatively unchanged at 2.8%, on average. The month’s special question asked about firm's expectations for the prime rate, sales revenue, number of employees, and capital expenditure expectations for year-end 2024. They were also asked about their expectations regarding sales revenue, number of employees, and capital expenditures if the borrowing rate is either 2 percent higher or 2 percent lower than their original expectations.

*Inflation expectations remained unchanged

*Current price changes continued to trend lower while expectations have firmed
The Chicago Fed’s National Financial Conditions Index (NFCI) decreased to –0.53 in the week ending March 15, suggesting looser financial conditions. Risk indicators contributed –0.24, credit indicators contributed –0.19, and leverage indicators contributed –0.10 to the index in the latest week.

*Looser credit conditions drove much of the recent loosening of financial conditions
U.S. Economic Data:
Housing starts increased by 10.7% month-over-month to an annualized rate of 1.521 million in February after falling by -12.3% in January, beating forecasts of 1.425 million. Single-family housing starts jumped 11.6% to 1.129 million, while multi-unit starts increased by 8.6% to 377 thousand. Starts jumped in the Midwest (50.7% to 202K) and the South (+15.7% to 883K) but fell in the Northeast (-10.3% to 122K) and the West (-7.9% to 314K). Building permits increased by 1.9% to 1.518 million SAR in February, exceeding market projections of 1.495 million and marking the highest level since August. Approvals for multi-units increased by 4.1% to a rate of 487 thousand, while single-family authorizations increased by 1.0% to 1.031 million, reaching the highest level since May 2022. Across different regions, permit gains in the Midwest (3.8% to 216K) and the Northeast (36.2% to 203K), offsetting declines in the South (-1.3% to 783K) and the West (6.8% to 316K).
Key Takeaways: Homebuilding continues to be supported by a historically low level of existing homes for sale due to most homeowners being locked into lower mortgage rates and less incentivized to sell/move. Recent better-than-expected activity has also been supported by the average rate on the popular 30-year fixed-rate mortgage falling in recent weeks after flirting with the 7% level in late February. As a result of the combo of lower rates and expectations for further drops as well as low inventory levels persisting, the number of single-house permits reached a one-and-a-half-year high in February. Builders are also cutting prices, offering other incentives to increase sales, and reducing the size of the homes being built to manage higher material costs. "Single-family starts could remain strong in the next couple of months as builders continue to see demand for new builds despite the headwinds facing buyers," said Daniel Vielhaber, an economist at Nationwide. "Rate incentives from builders continue to help buyers afford homes on the new side of the market."

*Housing starts are above last year's level but still well below 2022

*Residential starts increased 10.7% in February, the largest since May, mainly driven by single-unit

*Authorizations for one-family homes increased to the highest level since May 2022, and permits for multifamily construction also rose

*The number of multi-unit completions is picking up notably while the level of units under construction is declining
Existing-home sales increased by 9.5% to 4.38 million units (SAR) in February, the highest level in a year, compared to 4 million in January and market forecasts of 3.95 million. Among the four major US regions, sales jumped in the West, South, and Midwest and were unchanged in the Northeast. Total housing inventory was 1.07 million units, up 5.9% from January and 10.3% from one year ago (970K). Unsold inventory sits at a 2.9-month supply at the current sales pace, down from 3.0 months in January but up from 2.6 months in February 2023. Meanwhile, the median existing home price for all housing types in February was $384,500, an increase of 5.7% from the prior year ($363,600). All four US regions posted price increases.
Key Takeaways: February was the biggest upside surprise since July 2020 and the second biggest in over two decades. With rates now elevated for a while, homeowners may become increasingly impatient and begin to get on with life event-driven selling. "Additional housing supply is helping to satisfy market demand," said NAR Chief Economist Lawrence Yun. "Housing demand has been on a steady rise due to population and job growth, though the actual timing of purchases will be determined by prevailing mortgage rates and wider inventory choices."

* Existing home sales jumped in February to the highest level since last February

*According to the NAR, inventory increased to 1.07 million in February from 1.01 million the previous month
The NAHB/Wells Fargo Housing Market Index increased to 51 in March, compared to 48 in February, beating forecasts of 48. The current sales conditions sub-index increased by four points to 56. The sales expectations in the next six months sub-index rose by two points to 62. Finally, the traffic of prospective buyers sub-index increased by two points to 34. Looking at the three-month moving averages for regional HMI scores, the Northeast increased two points to 59, the Midwest gained five points to 41, the South rose four points to 50, and the West registered a five-point gain to 43. In March, 24% of builders reported cutting home prices, down from 36% in December and the lowest share since July 2023. However, the average price reduction in March held steady at 6% for the ninth straight month. Meanwhile, the use of sales incentives is holding firm. The share of builders offering some form of incentive in March was 60%, and this has remained between 58% and 62% since last September.
Key Takeaways: It was the strongest homebuilder confidence reading in eight months. The low level of existing inventory continues to drive buyers to new home construction while demand increased on the month due to mortgage rates falling. All three of the major HMI indices posted gains in March. “With the Federal Reserve expected to announce future rate cuts in the second half of 2024, lower financing costs will draw many prospective buyers into the market. However, as home building activity picks up, builders will likely grapple with rising material prices, particularly for lumber”, said NAHB Chief Economist Robert Dietz.

*Homebuilder confidence has retraced much of the late 2023 weakness

*All three sub-indexes improved on the month
The Philadelphia Fed Manufacturing Index decreased to 3.2 in March from 5.2 in February, exceeding market estimates of -2.3. Demand and shipment measures broadly improved. New Orders (5.4 vs. -5.2 in Feb) and Unfilled Orders (1 vs -11.7) both moved back into expansionary territory. Shipments (11.4 vs. 10.7) also expanded at a greater pace. Delivery Times (-16.7 vs. -21.1) continued to shorten, although at a reduced rate, while Inventories (4.4 vs. -2.8) moved into an overstocked level. Labor market measures remained contractionary, with Employees (-9.6 vs. -10.3) little changed and remaining contractionary, while the Average Workweek (-0.2 vs. 1.4) remained near neutral. Inflation measures dropped notably, with Prices Paid (3.7 vs. 16.6) and Prices Received (4.6 vs. 6.2) both dropping, notably so for prices paid. Future readings were more positive, with a broad increase in sub-index readings contributing to a jump higher in the six-month ahead general business activity index. Demand and activity measures increased, as did hiring intentions. There was a notable jump in the future capex measure.
Key Takeaways: The decrease in the current headline general business index is a little misleading, given the broad improvement in the underlying subindexes. Future readings rose notably, too, especially regarding demand and activity measures. Price measures notably fell, especially for prices paid, reversing gains seen in recent months and moving price pressure back to a level more aligned with the Fed’s 2% target. All in all, this was a positive report for further disinflationary progress and solid growth. The month’s special questions asked firms to estimate their total production growth for the first quarter ending this month compared with the fourth quarter of 2023. A higher share of firms reported an increase in production (41%) compared with the share reporting a decrease (27%). Regarding firms’ capacity utilization for the current quarter and one year ago, the median current capacity utilization rate reported among the responding firms was unchanged at 70 to 80%. Most firms reported labor supply as at least a slight constraint to capacity utilization, with the share of firms reporting it as a moderate or significant constraint (38%) edging up since December (35%). Just over half of the firms reported supply chains were not a constraint in the current quarter, a similar share to the previous quarter.

*Current general activity readings fell despite broad improvements at the sub-index level, while future general activity jumped notably

*There were broad increases at the sub-index level for current and future readings
The New York Fed’s March Service Sector Business Leader Survey increased to 0.6 from -7.3 in February. However, the Business Climate (-26.4 vs. -24.2 in Feb) sub-index worsened. Labor measures were mixed, with the Number of Employees (0.6 vs. -0.6) little changed and now slightly expansionary, while Wages (43.8 vs. 46.7) were slightly lower but still highly expansionary. Inflation measured rose, with Prices Paid (55.1 vs. 50.6) and Prices Received (27.8 vs. 24.5) both higher. Capital Spending (-0.6 vs. 7.9) declined to a more neutral reading. Forward-looking indicators weakened for activity and labor while inflation expectations rose.
Key Takeaways: The headline overall activity reading moved to neutral on the month. The current sub-readings were mixed, with a worsening in the business climate outlook, but the employment reading was little changed. Inflationary measures increased, although wages expanded at a slightly reduced pace. Current capex turned notably lower, moving to neutral, while forward indicators declined but remained expansionary. The future outlook for general business activity was little changed, with worsening views on business climate and hiring but higher price pressures, similar to current readings.

*Business Activity moved to neutral while current views on the business climate remained negative

*Both current and forward price measures rose in February
Technicals, Positioning, and Charts:
The Nasdaq outperformed the S&P and Russell on the week. Communication, Industrials, and Consumer Discretionary were the best-performing sectors, while Momentum and Growth were the best-performing factors. Large-Cap Growth was the best-performing size/value combo of the week.

@Koyfin
S&P optionality strike levels have the Zero-Gamma Level at 5172 while the Call Wall is 5250 and the Put Wall is 5240.

@spotgamma
S&P (/ES Futures) technical levels have support at 5250, then 5220, with resistance at 5320, then 5340.

@AdamMancini4
Treasuries are higher on the day, with the 10yr yield around 4.25%, while the 5s30s curve is slightly steeper on the session, moving to 19 bps.

Four Key Macro House Charts:

Growth/Value Ratio: Growth is higher on the week, with Large-Cap Growth the best-performing size/factor on the week.

Chinese Iron Ore Future Price: Iron Ore futures are higher on the week.

5yr-30yr Treasury Spread: The curve is steeper on the week.

EUR/JPY FX Cross: The Euro is stronger on the week.
Other Charts:
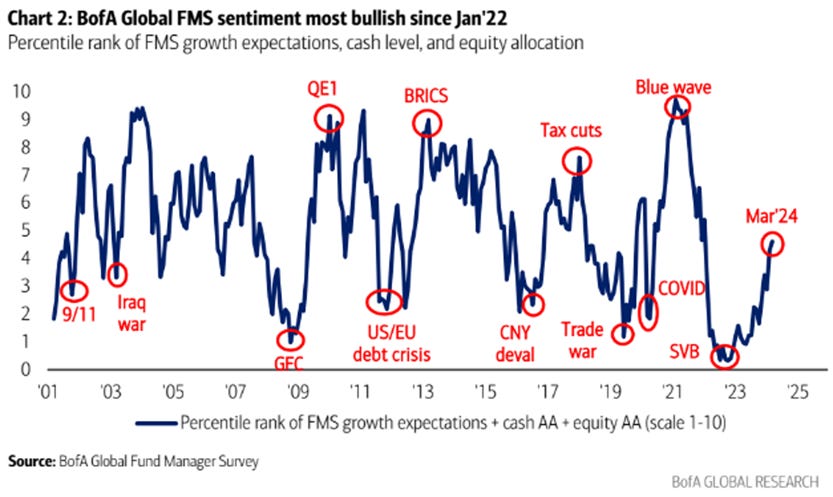
BofA’s Global Fund Manager Survey shows sentiment is most bullish since 2022.

Goldman's equity positioning indicator surged over the past week to the highest since March 2021.

CTAs are long $165 billion of global equities, the most long they’ve been in 3 years
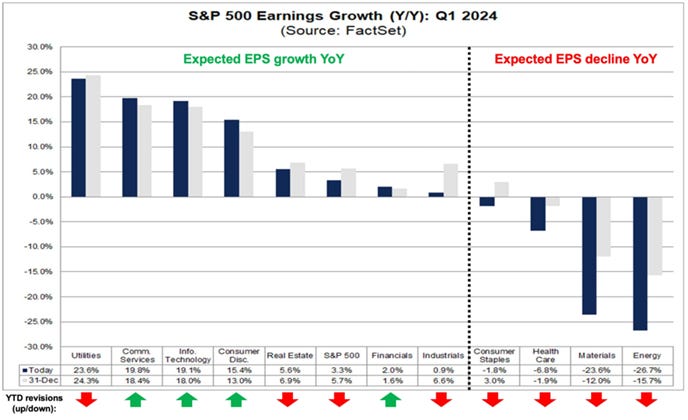
Seven sectors are expected to see EPS growth in Q1. Of those sectors, four (Comm. Svcs., Discretionary, Tech, and Financials) have seen positive YTD earnings revisions. – Factset

The forward P/E of the 10 largest TMT stocks peaked at 52x in 2000 and 43x in 2021. Today, they trade at “just” 28x forward earnings. – Goldman Sachs

“In January, fund managers were worried about geopolitics and the possibility of an economic hard landing, a natural environment to expect rates and inflation to come down. Now, their biggest concern, by far, is higher inflation. That psychology in itself may make it harder for the Fed to cut aggressively.” - @johnauthers
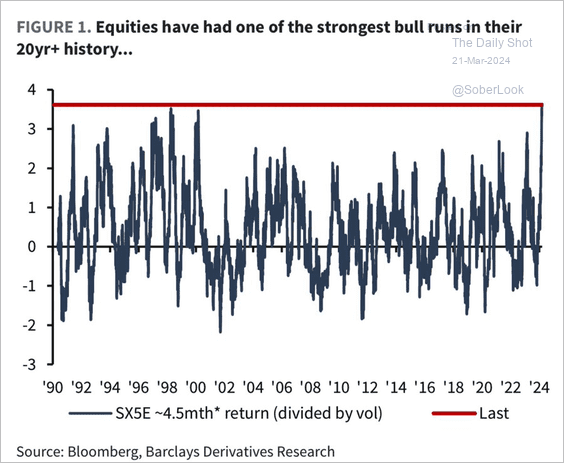
The recent large-cap rally in Eurozone equities has been impressive. – Barclays @DailyShot

The signal from the Global Wave remains positive for the third consecutive month as macro data globally continues to strengthen. “2024 could be an earnings-led recovery driven by a broader range of stocks.” – BofA

"Today is a landmark day as last night we passed the longest continuous US 2s10s inversion in history." - Deutsche Bank via @samro

Bitcoin $BTC ETF outflow just hit its highest amount this year.
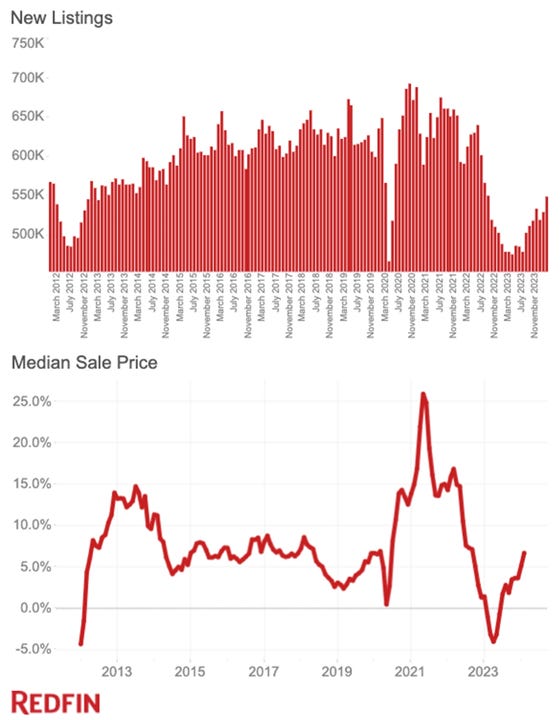
"Housing supply is finally rebounding as sellers get used to elevated mortgage rates, but it’s not rebounding enough to curb home price growth." – Redfin

Household equity asset allocation is at record highs, while cash holdings have fallen.

Although increasing, credit card debt levels are not yet at pre=pandemic highs in real terms.

"Inflationary pressures picked up in March. The rate of input cost inflation quickened to a six-month high amid faster increases across both monitored sectors." – S&P Global

Today, our real neutral rate model is at 1.6%. Again using the Fed's YE 2024 PCE projection (still 2.4%), this implies a nominal policy rate of 4%, while Jan 25 Fed funds futures currently imply 4.5%. This suggests the market may now be underestimating the amount of cuts coming from the Fed the rest of the year. - @Variant Perception
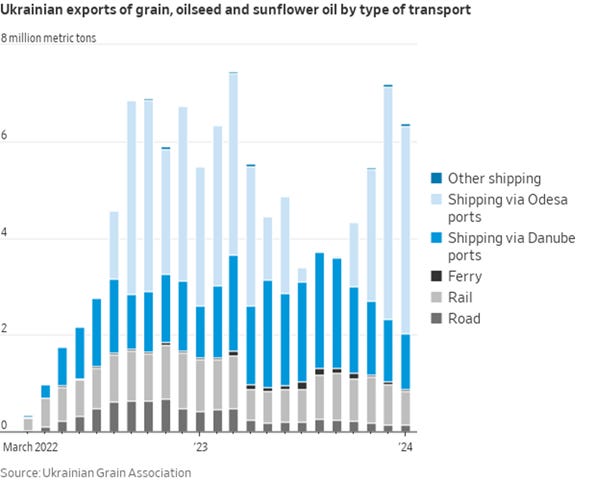
“Grain exports more than doubled to more than 5 million metric tons in December compared with around 2 million tons in September. That’s a boost for global grain markets that have been rattled since Russia’s invasion of Ukraine, one of the world’s top five grain exporters.Ukraine has also worked with international insurers to help grain ships find affordable coverage.The program was expanded this month to all nonmilitary cargo, including steel and iron ore.” - WSJ
Articles by Macro Themes:
Medium-term Themes:
China’s Rebalancing Act:
Patience: China’s monetary policymakers are in an “observation period” after the economy showed a strong start to 2024, according to state media, a signal the central bank won’t adjust rates in the coming months. China’s central bank held a key policy rate in March while Chinese lenders maintained their benchmark loan rates. That signaled monetary policy is “staying put” as authorities take time to observe where the economy will be heading, according to the report. The People’s Bank of China isn’t expected to cut banks’ reserve requirement ratio or interest rates in the second quarter, Citic Securities analyst Ming Ming told the state-run Shanghai Securities News. Encouraging economic data and low expectations for the US Federal Reserve to cut rates soon were both factors cited in the Thursday report. - Chinese Policymakers in Wait-And-See Mode on Easing, Report Says - Bloomberg

Too Strong: China’s strong factory output and investment growth at the start of the year raised doubts over whether policymakers will step up further support. Industrial output rose 7% in January-February from the same period a year earlier, the fastest in two years and significantly exceeding estimates. Growth in fixed-asset investment accelerated to 4.2%, strongest since April. Retail sales increased 5.5%, roughly in line with projections. “With the recovery in these data, policymakers will likely not see the need to do more than what they plan to do,” said Michelle Lam, Greater China economist at Societe Generale SA. It will take a “much bigger slowdown” for authorities to shift their policy focus to stimulating household income and spending to support consumption, she said. - China’s Growth Bump May Dent Urgency for More Stimulus - Bloomberg

No Growth: New bank lending in China fell more than expected in February from a record high the previous month. Outstanding yuan loans grew 10.1% from a year earlier - the lowest on record - compared with 10.4% growth in January. Analysts had expected 10.2%. A pull-back in February from January was widely expected, because Chinese banks tend to front-load loans at the beginning of the year to get high-quality customers and win market share. The timing of the week-long Lunar New Year holiday, which fell in February this year versus late January in 2023, may also have weighed on lending activity last month. Growth of outstanding total social financing (TSF), a broad measure of credit and liquidity in the economy, slowed to 9.0% in February from a year earlier and from 9.5% in January. Any acceleration in government bond issuance could help boost total social financing (TSF), a broad measure of credit and liquidity. Outstanding TSF was 9.5% higher at the end-January than a year earlier, the same as that at end-December. - China Feb new bank loans dip more than expected, lending growth at record low - Reuters

Longer-term Themes:
The Singularity is Near (AI Developments) and Cyber Life (More Generally):
Unlicensed: As the market for artificial intelligence models consolidates around Microsoft, OpenAI, and a handful of other proprietary systems and players, some companies are aiming to compete by offering their AI models free. OpenAI accounted for nearly 80% of the global generative AI market in 2023, according to an estimate from market research firm Valuates Reports. The open-source approach of freely distributing technology for the public to use, share, and modify helped create the modern internet, cloud-computing, and billion-dollar companies. Unlike open-source software, which was developed decades ago, the commercialization of open-source AI is very much uncharted territory. - Open-Source Companies Are Sharing Their AI Free. Can They Crack OpenAI’s Dominance? – WSJ

The Demise of Unipolarity: A World of Rising Regional Sphere:
Slow Withdrawal: Microsoft will reportedly suspend access to its cloud services for Russian users this month as a result of European sanctions imposed on Russia after its invasion of Ukraine. According to Microsoft’s letter to its Russian customers, the latest restrictions were adopted in response to European Union sanctions that prohibit Microsoft from supplying certain management or design software, including cloud-based solutions, to entities incorporated in Russia. This includes popular business intelligence tools such as Power BI, Microsoft’s Azure services, SQL Server, OneDrive, and PowerShell. - Russians will no longer be able to access Microsoft cloud services, business intelligence tools – The Record

Heavier Pressure: When the U.S. and Europe tried to sever Russia from the Western financial system, Moscow found workarounds. Key among them: banks in the Gulf and Europe that maintained ties with Russia. Now, Washington’s efforts to close these loopholes appear to be paying off. Dubai’s main state-owned bank has shut some accounts held by Russian oligarchs and traders of Russian oil. Turkish lenders are growing wary of handling Russia-related business. The U.S. has also put bankers in Vienna, another important financial hub, on notice. The moves follow visits by U.S. officials, and recent rounds of sanctions against trading firms and others. In late December, the White House gave the Treasury Department greater sanctions power, enabling it to penalize foreign banks for dealings involving Russia’s military-industrial base. - Russia’s Backdoor to the Global Banking System Is Slamming Shut – WSJ

Food: Security, Innovations, and Climate Change Implications:
Frustration: Farmers have a history of discontent with the EU, whether over how to tackle climate change or bureaucracy. Now another target for their anger risks escalating into a bigger political confrontation. A move by the EU this week to extend free trade measures with Ukraine has poured fuel on the already growing frustration among grain producers from Poland to France. A provisional deal early on March 20 to suspend duties and quotas for another year means Ukraine would be able to continue to sell wheat in the common market. - Europe’s Support for Ukrainian Wheat Gets Farmers Even Angrier - Bloomberg

Cold Places (Deep Sea, Artic, and Space Capitalization):
New Challenges: China, Iran, and others are pushing the boundaries of what types of activities are sanctioned on Antarctica and are contemplating future territorial claims. The arrival of great-power competition on Antarctic shores would mark a break from a long era in which the continent was a place of international cooperation. The Antarctic Treaty, which entered into force in 1961, prohibits using the continent for military purposes and instead champions scientific cooperation. Antarctica offers reach into the Atlantic, Indian, and Pacific Oceans. On and offshore, it boasts vast deposits of precious minerals, oil, and natural gas, as well as large krill fisheries. The continent is also central to global communications because it holds the clearest shot to space, as moisture in the air freezes, making Antarctic ground stations crucial for operating satellites. - Great-Power Competition Comes to Antarctica – Foreign Affairs

Hundreds: SpaceX is reportedly building a network of hundreds of spy satellites under a classified contract with the U.S. National Reconnaissance Office (NRO). The network is being built by SpaceX’s Starshield business unit under a $1.8 billion contract signed in 2021. If successful, the program is expected to significantly advance the ability of the U.S. government and military to quickly spot potential targets almost anywhere on the globe. Such continuous imagery of activities on the ground would aid intelligence and military operations, NRO officials said. - Musk's SpaceX is building spy satellite network for US intelligence agency - Reuters

Undersea Failures: Disruption to internet services for millions of users in Africa could take weeks or even months to fix, following damage to undersea cables off the continent’s west coast. Eight West African countries were suffering a second day of major connectivity issues on Friday with users in South Africa also affected, after damage to four sub-sea cables. MainOne, one of the cable owners, said that an “external incident” resulted in a cut to its cable system in the Atlantic Ocean near the Ivory Coast. It ruled out human activity as a cause. The cable issues came less than a month after three telecommunications cables were severed in the Red Sea. - Internet outage hits several African countries as undersea cables fail – AP News
Hacking Biology (Medical Innovations):
Potential HIV Cure: Working like scissors, but at the molecular level, it cuts DNA so "bad" bits can be removed or inactivated. The hope is to ultimately be able to rid the body entirely of the virus, although much more work is needed to check it would be safe and effective. Existing HIV medicines can stop the virus but not eliminate it. The University of Amsterdam team, presenting a synopsis, or abstract, of their early findings at a medical conference this week, stress their work remains merely "proof of concept" and will not become a cure for HIV any time soon. And Dr James Dixon, stem-cell and gene-therapy technologies associate professor at the University of Nottingham, agrees, saying the full findings still require scrutiny. "Much more work will be needed to demonstrate results in these cell assays can happen in an entire body for a future therapy," he said. - Scientists say they have successfully eliminated HIV from infected cells, using Nobel Prize-winning Crispr gene-editing technology. - BBC

Automated Warfare:
Land Drones: In August, a Ukrainian assault team steered an armored vehicle silently for 2.5 miles before firing 300 bullets at a group of startled Russian soldiers. The vehicle had no driver or gunner, and was instead a land drone, an early example of the robot-like vehicles that Ukraine is increasingly using to hit enemy forces, clear and lay land mines and rescue injured soldiers. Since Russia’s invasion two years ago, Ukraine has revolutionized warfare with its use of drones in the air and at sea. Now it wants to do the same with unmanned ground vehicles, or UGVs, aiming to replicate the low-cost, do-it-yourself approach that it has used to such deadly effect. - Robots Are Entering the Ukraine Battlefield – WSJ

Podcasts and Videos:
VIEWS EXPRESSED IN “CONTENT” ON THIS WEBSITE OR POSTED IN SOCIAL MEDIA AND OTHER PLATFORMS (COLLECTIVELY, “CONTENT DISTRIBUTION OUTLETS”) ARE MY OWN. THE POSTS ARE NOT DIRECTED TO ANY INVESTORS OR POTENTIAL INVESTORS AND DO NOT CONSTITUTE AN OFFER TO SELL -- OR A SOLICITATION OF AN OFFER TO BUY -- ANY SECURITIES AND MAY NOT BE USED OR RELIED UPON IN EVALUATING THE MERITS OF ANY INVESTMENT.THE CONTENT SHOULD NOT BE CONSTRUED AS OR RELIED UPON IN ANY MANNER AS INVESTMENT, LEGAL, TAX, OR OTHER ADVICE. YOU SHOULD CONSULT YOUR OWN ADVISERS AS TO LEGAL, BUSINESS, TAX, AND OTHER RELATED MATTERS CONCERNING ANY INVESTMENT. ANY PROJECTIONS, ESTIMATES, FORECASTS, TARGETS, PROSPECTS AND/OR OPINIONS EXPRESSED IN THESE MATERIALS ARE SUBJECT TO CHANGE WITHOUT NOTICE AND MAY DIFFER OR BE CONTRARY TO OPINIONS EXPRESSED BY OTHERS. ANY CHARTS PROVIDED HERE ARE FOR INFORMATIONAL PURPOSES ONLY, AND SHOULD NOT BE RELIED UPON WHEN MAKING ANY INVESTMENT DECISION. CERTAIN INFORMATION CONTAINED IN HERE HAS BEEN OBTAINED FROM THIRD-PARTY SOURCES. WHILE TAKEN FROM SOURCES BELIEVED TO BE RELIABLE, I HAVE NOT INDEPENDENTLY VERIFIED SUCH INFORMATION AND MAKE NO REPRESENTATIONS ABOUT THE ENDURING ACCURACY OF THE INFORMATION. I MAY OR MAY NOT HAVE POSITIONS IN ANY STOCKS OR ASSET CLASSES MENTIONED. I HAVE NO AFFILIATION WITH ANY OF THE COMPANIES OTHER THAN EXPLICITLY MENTIONED.