


Historical Equity Rally Pauses as Markets Weigh a Mixed Macro Backdrop
Color on Markets, Economy, Policy, and Geopolitics

Buying the dip in equities proved to be the correct move, but with growth worries still lurking, will the rally continue?
We believe a further melt-up is likely, but an increasingly unclear macro backdrop due to a more sensitive consumer, reduced investment appetite, weaker global tailwinds, and increased domestic political and international geopolitical uncertainty means markets could easily see increased volatility again
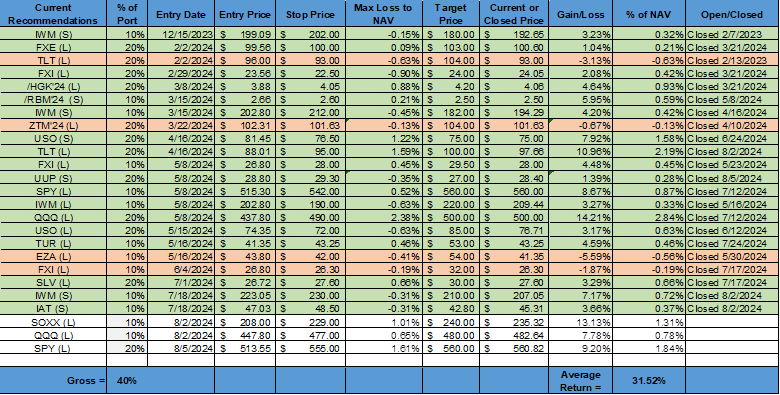
As a result, we remain long U.S. equities, moving our stops higher to lock in profits, but are uninspired in rates, FX, and commodities, waiting for Powell’s J-Hole message and NVDA earnings to determine next levels
The recent generally better-than-expected economic data and bounce back in equities and credit vindicated our belief that the spike in volatility and sell-off in risk several weeks ago was unwarranted. As we wrote, last week’s new economic data would determine if the rally in equities continued, and low and behold, it turns out things just aren’t that bad (yet).

As a result, markets are still looking at a “Goldilocks” scenario with disinflationary progress allowing the Fed to cut by 25bps several times this year (starting in September) into a slowing, but not crashing, economic growth backdrop.
Markets will continue to be hyper-focused on growth (rather than inflation), and any increased pricing of Fed easing (due to weaker growth readings) will not support risk assets (as it had in Q2). However, with 1.5% GDP growth being our expected outcome for the second half of this year, recession fears/predictions still look premature to us.

The length and magnitude of the current relief rally in U.S. equities is truly remarkable. There is an almost linear quality to the slope of the bounce back, which supports the idea of strong, consistent buying (algorithmic in nature), often starting on the market open and working until the markets close.
With positioning and sentiment now somewhat more balanced, we still see room for a further melt-up in stocks. However, a tactical pullback into Powell’s Jackson Hole speech would not be surprising given the degree of the bounce from the lows, VIX OPEX this week, and lack of further positive catalysts until then.

The continued decrease in Treasury yields indicates portfolio managers are increasing diversification away from equities and credit (despite the rebound in both), with the correlation between Treasuries and risk assets returning to a more neutral reading, supporting greater risk tolerance and limiting any new sell-offs.
However, the most recent BoA Global Fund Manager Survey indicated a heavy overweight in bonds by hedge funds, mutual funds, and institutions now.

With our belief that sentiment from the economic forecasting community is near maximum negativeness and “good data is good for markets” again, given the Fed’s coming easing cycle is more set (due to the cooling growth and continued disinflationary progress), we should now start to see more “beats” from new economic data versus forecasted consensus, and this should elicit greater positive price responses in risk assets.
Economic surprise indexes tend to mean-revert over time. When the economy cools, surveyed economists are slow to appreciate the degree of weakening, switching to a more bearish outlook often as things are bottoming and beginning to improve, causing the surprise index to crash lower and then recover quickly.
Currently, the U.S econ surprise index looks to be bottoming, with recent better-than-expected data catching forecasters that had become more negative over the summer by surprise. As a result, the skew is now that the data comes in stronger-than-expected as the forecasters again lag the realities on the ground.

It’s worth highlighting a few other factors that may support a further melt-up in U.S. equities:
Flows have become more positive from so-called trend-following systematic funds (CTAs)
Strong buyback seasonals are coming out of the ending earnings season, with Goldman estimating $6.62 billion of daily purchasing power until the corporate blackout window closes for some 50% of firms on Sept. 13.
Any further reduction in volatility will support Vanna-driven buying from dealers due to a more positive gamma tilt
Volatility-control funds are expected to boost their exposure after the VIX posted its biggest nine-day decline in history, as their positioning remains well below the allowable maximum levels
Risk parity systematic strategies reenter longs as cross-asset correlation normalizes
Cash from money market funds may increasingly be deployed into equities, with yields starting to materially decline (and likely to fall further with Fed cuts). Current US money market assets under management are about $7.3 trillion.
As a result of the above points and renewed outperfromance of momentum and growth, it is not surprising that short interest on the S&P and Nasdaq are near recent lows. Combined with a low put/call ratio, this reduces short-covering rally pulses but also indicates the current rally is backed by improving longer-term sentiment.

To be clear, the longer-term picture is still a challenging one as the economy downshifts to a slower growth level and more price-sensitive consumer…
Margin pressures will likely continue as pricing power is diminished while input costs are more sticky, especially with firms reluctant to reduce hard-found skilled labor. Eventually, the current exuberance will be more meaningfully weighed on by this and why we still favor large-cap growth over small-cap value.

In fact, earnings expectations are declining for the remainder of 2024, as a more uncertain macro backdrop, clearly noted in Q2 earnings calls, is forcing a more cautious outlook.

Inflation is done and any future increased disinflationary progress will now be perceived as economic weakness…
July’s CPI came in as expected, with the exact print being 0.165%, and officially ending the era of people being hyper-focused on inflation data. The focus is now squarely on labor market data.
In other words, the number itself probably doesn’t move the dial much for the Fed as a stand-alone piece of new information. But if the inflationary wave is over, as seems to be the case, the Fed can try to calibrate its policy with an eye on the weakening labor market and not worry so much about the stable prices side of the mandate.

Perceptions of the labor market continue to weaken consumer sentiment…
The NY Fed’s SCE Labor Market Survey indicated that more workers are looking for jobs and expect higher levels of unemployment in the months ahead. Greater uncertainty regarding future income is starting to show despite layoffs not meaningfully increasing on aggregate.

This new consumer labor sentiment data from the NY Fed, supported by other readings in recent University of Michigan and Conference Board consumer sentiment surveys, indicates that consumers feel less confident about job market opportunities.
One has to wonder if the Fed is as focused on labor market expectations in gauging whether policy is appropriate for its full-employment mandate as it was on inflation expectations regarding its price stability mandate.
It’s not all gloom and doom; roughly 19% of respondents said they had received at least one job offer in the past four months, which is about the same as in July 2023. Further, the NY Fed’s regular Survey of Consumer Expectations showed that labor market and household income expectations are still stable.
Finally, although spending plans and the ability to meet debt payments have worsened, the household’s current perception of their own financial situation improved slightly in the recent July survey.

This still somewhat stable but more insecure consumer outlook was echoed by Walmart, which raised its full-year outlook on strength in the first half of the year, saying it had seen steady consumer health but was more cautious about the second half given the uncertainties.
Walmart’s CFO said the firm has not noticed a shift in consumer behavior and that every month of the quarter was “relatively consistent,” and the back-to-school season “was off to a pretty good start.” Target and TJ Max noted similar trends at the expense of higher-end retailers such as Macy’s.
Stepping back, despite July’s retail sales beating expectations and consumer spending ending Q2 with solid momentum, the lack of a corresponding increase in personal income or use of revolving credit means spending power is increasingly coming out of savings. As we know, this is the least sustainable way to support consumption.

Finally, last Friday’s University of Michigan Consumer Sentiment Survey is worth quickly highlighting. As expected, the rise of Kamala has increased sentiment among Democrat- and Independent-leaning respondents. We would expect to see a step down in future readings from business surveys akin to this move (but in the opposite direction), especially in the NFIB survey, where an overwhelming majority of the “owners” are Republican-leaning and are now looking at an increased probability of a continuation (and potential increase) in current less business-friendly policies.

Turning to the Fed, today’s July FOMC minutes have swung open the door for a 50bps cut in September, a sentiment that Powell will likely echo in his Jackson Hole speech. The downward revisions to payrolls seen today also support the idea that the labor market is weaker than thought and now loosening meaningfully enough (in combination with the ongoing/expected disinflationary progress) to warrant 100 to 150bps of cuts without materially easing policy, instead adjusting it to a more appropriately neutral level.

The market and an increasing amount of Fed officials now perceive policy as too tight…
We believe that 75bps of cuts are the modal case for the rest of the year with our worry that the Fed is behind the curve and may start with a 25bp cut in Sept and November only to increase to 50bps by December if labor markets materially weaken (which we give a non-trivial probability of occurring).

In summary, many of the themes we have discussed for some time are still intact:
Consumer spending is cooling, but from high levels, due to growing concerns over the labor market and diminished savings
Disinflation progress continues and looks intact until at least year-end, allowing the Fed to adjust policy without really changing its policy stance
For the Fed to signal it wants to truly ease policy, we will need a further step down in labor market conditions with an increase in layoffs jeopardizing what is still positive consumer spending levels and growth momentum (albeit at a lower 1.5%ish final domestic demand level)
Hence, equities can melt up further tactically, and rates can remain at current levels until the August payrolls report challenges the soft landing “Goldilocks” narrative.
However, we are moving higher our stops to lock in profits on our equity longs, given our worry that growth concerns could quickly reappear
As always, thank you for reading, and please share our newsletter if you like it and know others who may enjoy it. Please feel free to reach out with any questions or comments.
We will be on vacation until Labor Day catching up on our reading and working on second-half macro themes! – Michael Ball, CFA, FRM
VIEWS EXPRESSED IN “CONTENT” ON THIS WEBSITE OR POSTED IN SOCIAL MEDIA AND OTHER PLATFORMS (COLLECTIVELY, “CONTENT DISTRIBUTION OUTLETS”) ARE MY OWN. THE POSTS ARE NOT DIRECTED TO ANY INVESTORS OR POTENTIAL INVESTORS AND DO NOT CONSTITUTE AN OFFER TO SELL -- OR A SOLICITATION OF AN OFFER TO BUY -- ANY SECURITIES AND MAY NOT BE USED OR RELIED UPON IN EVALUATING THE MERITS OF ANY INVESTMENT. THE CONTENT SHOULD NOT BE CONSTRUED AS OR RELIED UPON IN ANY MANNER AS INVESTMENT, LEGAL, TAX, OR OTHER ADVICE. YOU SHOULD CONSULT YOUR OWN ADVISERS AS TO LEGAL, BUSINESS, TAX, AND OTHER RELATED MATTERS CONCERNING ANY INVESTMENT. ANY PROJECTIONS, ESTIMATES, FORECASTS, TARGETS, PROSPECTS AND/OR OPINIONS EXPRESSED IN THESE MATERIALS ARE SUBJECT TO CHANGE WITHOUT NOTICE AND MAY DIFFER OR BE CONTRARY TO OPINIONS EXPRESSED BY OTHERS. ANY CHARTS PROVIDED HERE ARE FOR INFORMATIONAL PURPOSES ONLY AND SHOULD NOT BE RELIED UPON WHEN MAKING ANY INVESTMENT DECISION. CERTAIN INFORMATION CONTAINED IN HERE HAS BEEN OBTAINED FROM THIRD-PARTY SOURCES. WHILE TAKEN FROM SOURCES BELIEVED TO BE RELIABLE, I HAVE NOT INDEPENDENTLY VERIFIED SUCH INFORMATION AND MAKE NO REPRESENTATIONS ABOUT THE ENDURING ACCURACY OF THE INFORMATION. I MAY OR MAY NOT HAVE POSITIONS IN ANY STOCKS OR ASSET CLASSES MENTIONED. I HAVE NO AFFILIATION WITH ANY OF THE COMPANIES OTHER THAN EXPLICITLY MENTIONED.