


The Unlikely Resilience of Risk Appetite
Midday Macro - Color on Markets, Economy, Policy, and Geopolitics

The melt-up in U.S. equities continues as growth and inflation trends support risk sentiment
“Trump Trades” may be stretched with the election still too close to call, and as a result, it is unclear how much of the expected year-end rally in equities has been pulled forward
The dollar and rates will maintain a holding pattern until fiscal deficits and trade policies are clearer
The risk-positive macro narrative continues…
The “perceived” macro backdrop continues to be supportive of risk sentiment, leading equity markets to keep melting higher while rates have sold off. Both are now pricing a “soft” to “no landing” outlook, with the Fed’s ultimate cutting path being dialed back without adversely weighing on risk appetite.

With the U.S. election fast approaching and with the outlook 50-50, we continue to exercise caution and patience. There has been strong momentum in “Trump Trades,” but actual polling still indicates an even race, with VP Harris losing momentum following Hurricane Helene, but certainly not out of it (as was Biden). Congress also continues to look like it will flip.

We have no edge on calling the election outcome, and as a result, we would rather not misrepresent and mislead our readers and suggest chasing trends that could quickly reverse. Luckily, there are other things to discuss and ponder.
The dips are being bought in equities…
Selloffs in the S&P have been a rarity in recent weeks, and incredibly, since the September 6th low, the S&P has been unable to put in two consecutive red days in a row, with every single dip being bought the next day. This rally picked up steam last week after the S&P broke out of its picture-perfect bull flag (which it had been in from 9/26 until 10/7)

The S&P also remains in a stable positive gamma stance above 5,750. Friday’s October OPEX (and Wednesday’s VIX OPEX) will release positive gamma and could result in a pullback, given its call-heavy nature. However, any drawdown would be limited as the market remains well hedged. Instead, all eyes are on the 6,000 strike level for the S&P, now just 2-3% away, and will likely be an upside magnet into month end.
As a result, it looks like the expected post-election rally has moved forward. The setup remains bullish, especially with implied volatility falling more meaningful now, creating positive Vanna flow dynamics. However, this bullish view has become super consensus and may be predicated on a Trump victory.

This now consensus bullish outlook and coming change in gamma somewhat bolster the idea that a mild correction is due tactically (due to OPEX and if Trump’s polling weakens). Further, should this rally continue, one has to think it is “pulling forward” a lot of the post-election bullish sentiment no matter what the outcome is.
Treasury yields may be near the high of their range…
There is a similar story in rates, with Treasury yields higher in a curve-steepening move over the last week that may have had as much to do with the re-imposition of “Trump Trades” than anything macro or Fed-related. That said, the solid retail sales data acted as a catalyst to embolden those trades following the flattening that occurred post-payrolls.
With our view that Q3 growth was above trend (and will cause Q4 negative payback) and energy prices will fall (reducing inflation worries and supporting Fed rate cuts in 2025), we believe yields may trend lower into the election despite fiscal deficit concerns.

There will be a growth payback in the fourth quarter…
Despite the stronger third-quarter growth result, something that will now support stronger-than-expected earning results, we see a weaker fourth quarter developing. Better-than-expected inventory accumulation and export activity (due to dock strikes and election front-loading) pulled growth forward and will likely now be a drag. This does not mean we will see a dramatic drag on growth from these channels; it is simply a return to a more sustainable run rate.

Is the data fishy?
We question the actual strength of the recent economic data.
There was a notable positive seasonal adjustment factor in the September labor report and retail sales data. Low response rates and high levels of revisions also mean that things are not what they initially seem, making the recent stronger data points less reliable.
“September is a difficult month for the BLS to process because the composition of the labor force changes drastically when summer ends, and fall begins,” Chris Low, Chief Economist at FHN Financial
“The extremely low response rate to the payroll survey waves a red flag. We think that small businesses are disproportionately late responders and are cutting back on hiring more than large businesses. We are convinced, therefore, that September’s print will be revised much lower over the coming months.” Samuel Tombs, Chief US Economist at Pantheon Macroeconomics

However, momentum is still positive for growth…
Logistical companies confirmed this earlier peak volume activity in Q3 (due to port strike worries) helped stabilize the sagging U.S. freight market.
J.B. Hunt CEO Shelley Simpson said the company has “seen a return to more normal seasonal demand patterns,” and many of its customers are maintaining their shipping projections and still expect a relatively normal peak season through the fourth quarter.
The Logistical Manager’s Index shows that upstream and downstream inventory levels have risen, something also seen in the mosaic of various PMI readings. The current inventory trajectory suggests that retailers are expecting a healthy fourth quarter and holiday season.

This rosier outlook is due to the consumer still being healthy…
Earning calls from the big banks did not indicate any material change in consumer spending trends, simply indicating that they continue to normalize and vary between lower and higher income cohorts.
“We see the spending patterns as being sort of solid and consistent with the narrative that the consumer is on solid footing and consistent with the strong labor market and the current central case of a kind of no-landing scenario economically.” - JPM CFO Jeremy Barnum
“Both our consumer and commercial customers have remained resilient... Both credit card and debit card spending were up in the third quarter from a year ago. And although the pace of growth has slowed, it is still healthy.” – Wells Fargo CEO Charlie Scharm
Even if there was a drag on fourth-quarter GDP growth from inventories and trade while investment slowed (as seems to be the trend), steady consumer spending momentum means there is a floor to how far growth could fall.
As a result, the K-shaped recovery continues…
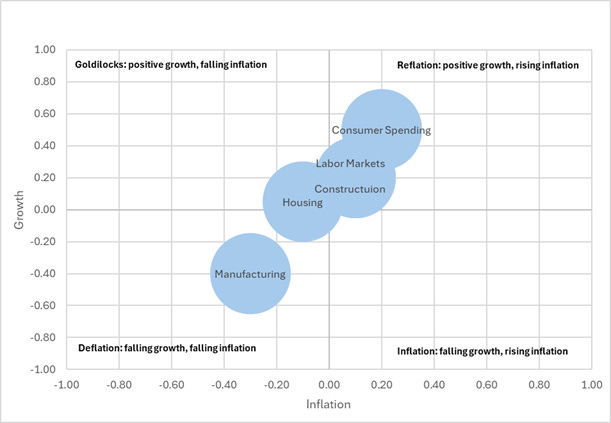
Putting it all together, there is still a clear bifurcation in the economy.
Consumer spending indicates above-trend growth and the potential for inflation to remain more sticky, while Labor Markets and Construction indicate a more neutral standing. Manufacturing and Housing have been experiencing more negative growth and greater deflation trends.
Using a matrix that quadrants positive and negative growth and inflation, it is easier to picture how the areas mentioned above of the economy fall. We take some subjective liberties in assigning values but stand by the message we are telling.
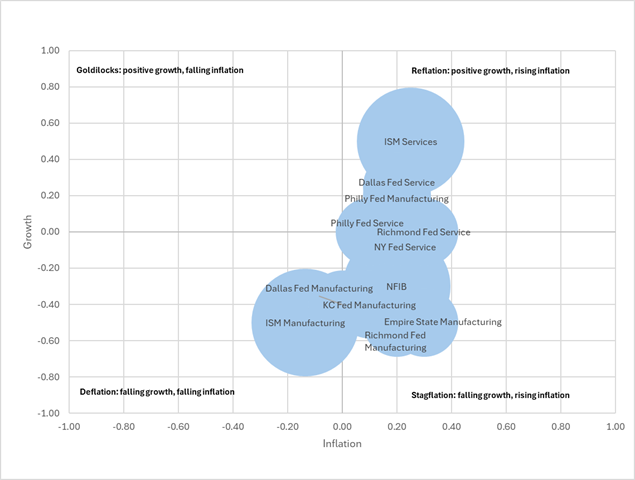
Softer survey data also varies in its growth/inflation narrative…
When applying this same matrix approach to PMIs and NFIB, it is also clear that there are areas of strength and weakness. For example, the two ISM PMI reports couldn’t be more opposite.
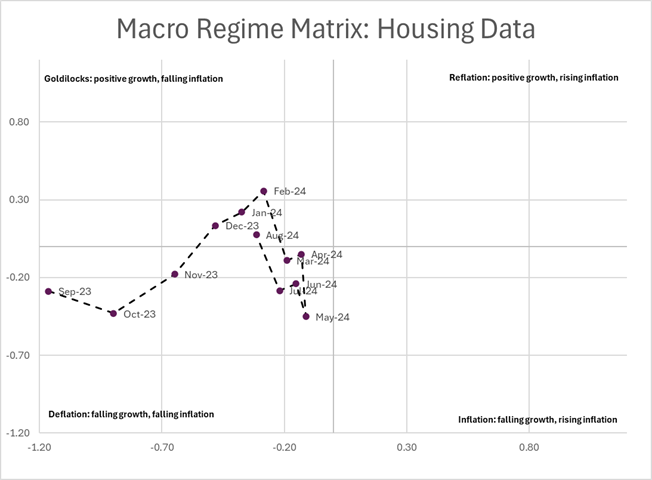
This approach helps identify changes in the narrative…
None of what these matrices are showing should come as a surprise to anyone paying attention, and we share using this simple framework to set up a method of seeing how things are evolving.
For example, when combining building permits, housing starts, home sales, homebuilder sentiment, and the national housing price index, we can see that housing “growth” has improved while disinflation progress continues. This may be a surprise to many who are more headline-driven.
Although we standardize the data and take a more quantitative approach, it is still somewhat subjective in terms of how you want to think about growth and inflation per various parts of the economy.
The bottom line is that the economy remains in a unique place where resilient consumer spending has kept more rate-sensitive areas from causing an outright recession.
We believe the normalization of final domestic demand will lead to a below-trend period of growth in the fourth quarter. The inventory and trade channels that supported third-quarter growth may turn into headwinds.
However, momentum remains strong, and the passage of the election should improve both consumer and business sentiment and, subsequently, spending and investing activity.
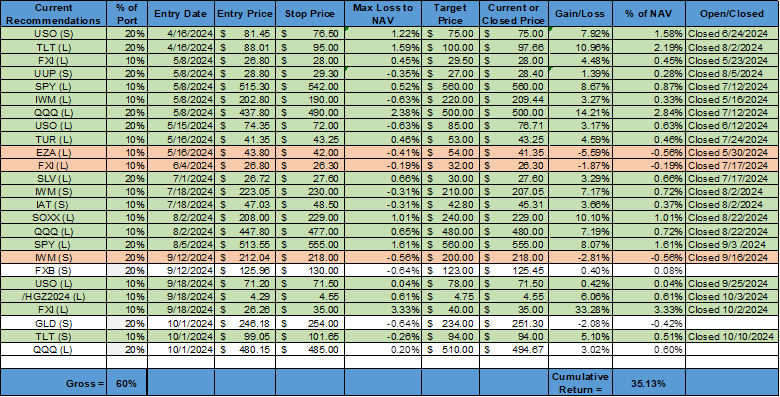
As of now, there are still no red flags, and we maintain our preference to be long U.S. equities and the dollar with a more neutral view on rates. We have moved up our stop on our gold short, seeing the current wave higher as near completion and still believing there will be a correction lower.
We will be off next week due to a pilgrimage to the Mecca of capitalism, Disney World. Wish us luck, and as always, thank you for reading.
Please share our newsletter if you like it and know others who may enjoy it.
Please feel free to reach out with any questions or comments. – Michael Ball, CFA, FRM
VIEWS EXPRESSED IN “CONTENT” ON THIS WEBSITE OR POSTED IN SOCIAL MEDIA AND OTHER PLATFORMS (COLLECTIVELY, “CONTENT DISTRIBUTION OUTLETS”) ARE MY OWN. THE POSTS ARE NOT DIRECTED TO ANY INVESTORS OR POTENTIAL INVESTORS AND DO NOT CONSTITUTE AN OFFER TO SELL -- OR A SOLICITATION OF AN OFFER TO BUY -- ANY SECURITIES AND MAY NOT BE USED OR RELIED UPON IN EVALUATING THE MERITS OF ANY INVESTMENT. THE CONTENT SHOULD NOT BE CONSTRUED AS OR RELIED UPON IN ANY MANNER AS INVESTMENT, LEGAL, TAX, OR OTHER ADVICE. YOU SHOULD CONSULT YOUR OWN ADVISERS AS TO LEGAL, BUSINESS, TAX, AND OTHER RELATED MATTERS CONCERNING ANY INVESTMENT. ANY PROJECTIONS, ESTIMATES, FORECASTS, TARGETS, PROSPECTS AND/OR OPINIONS EXPRESSED IN THESE MATERIALS ARE SUBJECT TO CHANGE WITHOUT NOTICE AND MAY DIFFER OR BE CONTRARY TO OPINIONS EXPRESSED BY OTHERS. ANY CHARTS PROVIDED HERE ARE FOR INFORMATIONAL PURPOSES ONLY AND SHOULD NOT BE RELIED UPON WHEN MAKING ANY INVESTMENT DECISION. CERTAIN INFORMATION CONTAINED IN HERE HAS BEEN OBTAINED FROM THIRD-PARTY SOURCES. WHILE TAKEN FROM SOURCES BELIEVED TO BE RELIABLE, I HAVE NOT INDEPENDENTLY VERIFIED SUCH INFORMATION AND MAKE NO REPRESENTATIONS ABOUT THE ENDURING ACCURACY OF THE INFORMATION. I MAY OR MAY NOT HAVE POSITIONS IN ANY STOCKS OR ASSET CLASSES MENTIONED. I HAVE NO AFFILIATION WITH ANY OF THE COMPANIES OTHER THAN EXPLICITLY MENTIONED.