


The Three Horseman (Fed, Mega-Cap Earnings, and Jobs Report) Fail to Kill the Rally - MIDDAY MACRO WEEKEND READ – 2/3/2023
Color on Markets, Economy, Policy, and Geopolitics

The Three Horseman (Fed, Mega-Cap Earnings, and Jobs Report) Fail to Kill the Rally - MIDDAY MACRO WEEKEND READ – 2/3/2023
Overnight and Morning Recap / Market Wrap:
Price Action and Headlines:
Equities are lower, with an initial rally at the NY-open following a strong jobs report and ISM service PMI failing to last as higher rates and weakness in commodities weighed on risk sentiment after a historic week
Treasuries are lower, but little changed on the week despite the dramatic backup in yields today as dovish central banks, mixed earning results, and stronger economic data left the 10yr yield still near 3.5%
WTI is lower, ending today’s session near $73 and down notably on the week as demand expectations fell due to reduced China reopening exuberance while inventories grew

Narrative Analysis:
Despite today’s broad risk-off tone, the January rally lives on in many ways but has certainly cooled in some areas. The week brought a massive amount of new information to the markets. The economic data front shed further light on labor markets, with JOLTs and today’s job report coming in stronger than expected while drops in the AHE and ECI reduced wage spiral inflationary fears. Business surveys generally improved with a notable bounce back into expansionary territory in today’s ISM service sector PMI reading. The earnings picture continues to be on the whole weak, but not as bad as feared, and somewhat bifurcated results (depending on the company/sector) have muted index-level price reactions. The 800-pound gorilla in the room, aka the Fed, came across much more dovish than expected and is likely the real reason why risk assets continue to hang tough. When coupled with a more covertly cautious tone from the ECB, it is clear that monetary policy is entering a new phase of the cycle and will be more two-sided in its reaction function. Treasuries, after explosive moves higher in yields today, are still little changed on the week. Oil was the real loser on the week, down notably due to reduced optimism for China’s reopening while supplies look to be growing. Following energy markets, industrial metals also had a down week, with copper retracing recent gains despite backwardation in its future curve and continued worries regarding future supply. Finally, the dollar had an active week given the new data and policy shifts, ending up today with the $DXY moving close to 103 due to broad weakness across major crosses.
The Russell is outperforming the S&P and Nasdaq with Momentum, Small-Cap, and High Dividend Yield factors, as well as Energy, Healthcare, and Consumer Staples sectors are all outperforming on the day. The week had a clear tilt and favored small-caps and growth and communications and technology despite some reversals today.

@KoyfinCharts
S&P optionality strike levels have the Zero-Gamma Level at 4070 while the Call Wall is 4200 and Put Wall is 4000. There was record options volume yesterday, driven by frenetic call activity in mega-caps. As a result, it was a “stock up, vol up” day as traders chased the upside across the board. Anytime you see IV moving up in context with price, it’s generally a sign of exuberance and often creates price moves that are very hard to sustain. This is because as the stock rises, options values rise asymmetrically (due to vega/rising IV), and dealers are left buying/chasing the stock. Once the upside momentum pauses, those options immediately start to lose value, and dealers can then start to sell, which presses the stock lower. This is likely what is happening today. However, SpotGamma still thinks the market should remain well supported inside of the 4100’s, with 4200 – 4215 (SPY 420) functioning as resistance.

@spotgamma
S&P technical levels have support at 4130, then 4000 (major), with resistance at 4170, then 4210. Last Wednesday, S&P broke out of its core downtrend line from January 2022 at 4022. We then rallied for a few days, then Tuesday of this week, we back-tested 4020. Afterward, we went into vertical lift-off, rallying 200 points. While the broad structure remains bullish,we have had a monster run and are likely in for some tactical/corrective trading now.
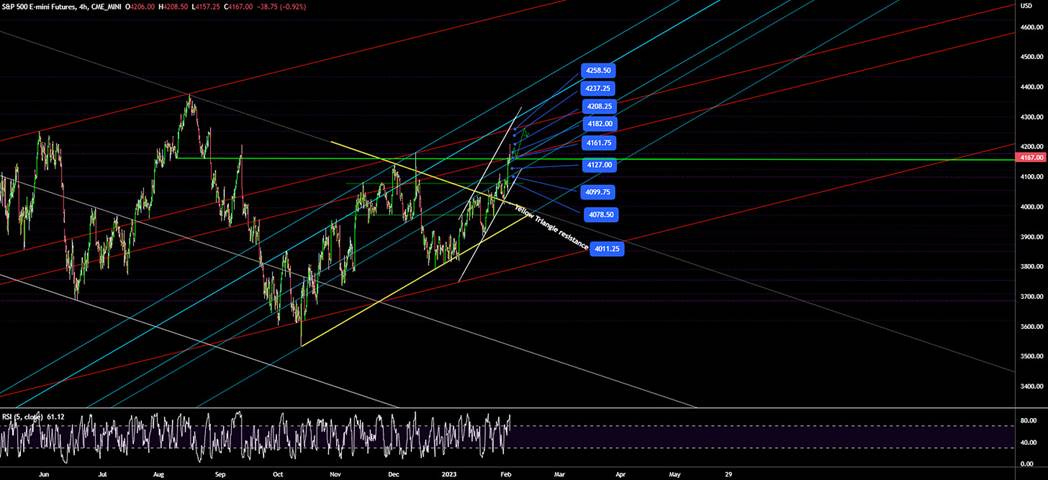
@AdamMancini4
Treasuries are lower, with the 10yr yield at 3.53%, higher by 14 bps on the session, while the 5s30s curve is flatter by 10 bps, moving to -4 bps.

Deeper Dive:
This week brought markets a large amount of new economic and earnings data as well as central bank policy events from the Fed, ECB, and BoE. Our general takeaway is that equities are holding up pretty well given what has transpired, leading us to still see the rally as sustainable but not chasable. We, however, are now in our third week of having this mentality, and although ending the week off highs, equity indexes are still being driven higher by bullish momentum and technicals, even as fundamentals remain uninspiring. Cross-asset price action is also beginning to push back on January’s risk-on picture. The China reopening trade has fizzled in recent sessions, as seen in A-shares and commodity prices cooling. Energy markets also continue to indicate a lower global growth outlook, although there are many factors affecting supply and demand there, which muddy the picture. The dollar looks to be basing, reducing tailwinds for EM, as an improving growth outlook in the U.S. is leading to recalibrations in FX markets. As a result, we are closing our dollar-short position. In summary, monetary policy is entering the next stage of the cycle, becoming more two-sided and data-dependent, which is dovish if you believe core-service inflation is not sticky. Earnings have generally been in-line (when accounting for guidance) and not as bad as feared despite some notable misses, and hard and soft data have been more positive on the week, with labor market strength reducing recessionary fears but keeping inflation stickiness views alive.
Despite some hiccups, this week's remarkably heavy set of first-order data and policy events showed a continued improving macro backdrop. Policymakers came across as more confident that their accumulative policy actions to date were working. The Fed stressed deflationary forces growing in a new development and did not push back against market-implied rate cuts. At this point, it seems clear the Fed wants to get to 5% and let the data make a case for when and where the next move should be. As a result, the weekly mosaic of new information keeps the soft landing trade alive with no significant revision to that narrative. However, recent cross-asset price action indicates a need to see a follow-through in the actual data (globally), as risk assets have moved a considerable amount higher based on “hope.” We now increasingly look for “good to mean good” as the policy pulse, which is stabilizing, becomes secondary to actual economic growth results in producing price responses. This is also based on our more controversial belief that further falls in inflation will not require a material loosening in labor markets.

*These are the sub-components of core-service inflation X-shelter that the Fed will be watching

*Globally, inflation is increasingly falling, giving central banks reason to change their tune slightly

*January saw some significant moves higher in certain asset classes, and we are now needing a cooling in RSIs
Turning to the earnings front, the general mantra has been “in-line,” with guides not being as negative as feared. In the end, labor markets remain too strong for consumer fears to worsen too much further. Improvements in consumer confidence juxtapose against weakening balance sheets at the household level, and as a result, recessionary fears and negative earnings growth projections can only fall so much further. Simply put, the slowdown is here, but labor is not feeling it yet, and consumers still see their job prospects as good. This, in combination with a more stable housing market backdrop and falling inflation, manifests into improving confidence and, as a result, a stronger wealth/income effect on real activity. To be clear, we do not yet know the full effect that the cumulative policy tightening will ultimately have on growth and labor markets. The current economic environment is unlike any before. There looks to be a high level of labor stickiness currently, given how hard it was for firms to find and retain skilled workers. This may mean labor markets are significantly less rate-sensitive than in past cycles. We also believe that the U.S. economy is less rate-sensitive given how low rates were during the pandemic, allowing consumers and firms to lock in lower for longer financing. Putting it together, this gives us greater confidence that despite the historic tightening of policy, the slowing in activity already upon us will not lead to a prolonged or drastic drop below potential growth, and hence earning forecasts may begin to improve for the second half of the year slowly.

*Q4 earnings reports have been disappointing relative to historical surprises, but expectations were very low

*We question what this really means. Is it negative or positive? Would people save more if they had greater uncertainty in job prospects? Or are people really one paycheck away from the street?
In summary, nominal economic activity has decelerated with slowdowns in both growth and inflation. Monetary and fiscal policies continue to be contractionary. However, increased credit creation by the private sector has offset this somewhat. This offset is likely to be transient as demand falls. The belief is that the current economic backdrop will increasingly pressure business profitability, which will pressure labor markets. But the lagged effects of tighter policy and starting strength of household and business balance sheets are muddying the picture. Real disposable incomes are rising as inflation falls, and as a result, firms may have better pricing power than feared while costs also fall. Business surveys show a bifurcated playing field, with some sectors/industries doing much better than others depending on demand and capacity constraints. As a result, we continue to believe in a softer landing cautiously and, as a result, see the current rally maintaining momentum increasingly on improving fundamentals. Finally, we are closing our dollar long after realizing a 10% gain due to the belief that the dollar may see a relief rally as the growth outlook for the U.S. improves and what that means for future policy and real yields.

*Volatility continues to trend lower, allowing financial conditions to ease and risk assets to rise, but bouts of volatility will continue to flare up as recession and inflation uncertainty ebb and flow

*Our portfolio has pulled back this week due to drops in copper, oil, and EM. We are now 75% invested after closing our dollar short for a 6.5% return since inception
Econ Data:
The NFP Jobs Report showed an addition of 517K jobs in January, the most since July, and way above an average monthly gain of 401K in 2022, easily beating market forecasts of 185K. Job growth was widespread in January, led by gains in leisure and hospitality (128K), professional and business services (82k), and health care (58K). Temporary help employment also rose by 26K. Employment also increased in government (74K), partially reflecting the return of workers from a university strike in California. There were also revisions, with employment gains in November and December combined being 71K higher than previously reported. The U3 unemployment rate fell to 3.4%, the lowest level since May 1969 and below market expectations of 3.6%, as the number of unemployed people declined by 28K to 5.69 million and the number of employed increased by 894K to 160.1 million. The U6 unemployment rate rose slightly to 6.6% from 6.5%. The labor force participation rate edged up to 62.4% from 62.3% in the previous month and is still below its pre-pandemic February 2020 level of 63.3%. Average hourly earnings rose by 0.3% MoM, following an upwardly revised 0.4% gain in the prior month and matching market forecasts. Over the past 12 months, average hourly earnings have increased by 4.4% YoY. Finally, the average weekly hours worked increased to 34.70 hours from 34.40 Hours in December of 2022.
Why it Matters: A significant beat in the jobs report shows that economists are currently very bad at predicting data due to the lingering effects of the pandemic and uncertainty on how cumulative policy tightening measures are hitting the real economy. However, given where other labor market data indicators have been, it is not truly surprising. A balance of 69.0% of industries reported increases in employment in January, up from 65.4% in December. Total private sector hours worked jumped by 1.2% MoM, and even manufacturing hours worked rose by 0.9% MoM, despite indications elsewhere that the sector was seeing falling demand. The increase in hours worked ran counter to other data in business surveys showing a trend of shorter work weeks for some time now. The contraction here was previously seen as an indicator that labor demand was cooling as firms reduced production capacity due to falling demand/backorders. This new development indicates that firms are now expanding capacity, likely due to better availability of material inputs and skilled labor. The length of time people stay jobless was also unchanged, with the long-term unemployed accounting for 19.4% of the total unemployed in January, signaling no loosening in labor demand. Finally, the number of people employed part-time for economic reasons, at 4.1 million, was little changed in January while temporary workers increased. These indicators of labor strength contradict the smallest growth in average hourly earnings in four months. However, average hourly earnings were revised higher in 2022, and therefore, wage growth has slowed by less than previously estimated. In conclusion, this report indicates stronger manufactured output growth and wage income gains are potentially coming. It also is problematic for the Fed since it weakens the case for a fast return to 2% inflation within the framework of Fed thinking on the inflation process.

*Leisure & Hospitality and Education & Health Services were the largest gainers, but no category was negative on the month

*The lowest U3 UER since the 1950s. However, the participation rate continues to be a full percentage point below its pre-pandemic level

*The real surprise in the report was the increase in the average weekly hours worked, bouncing out of its recent downtrend

*Seasonalities played a role in the large beat, along with new population estimates to the household survey. Still, the increase and revisions higher to December and Novembers data were impressive
The number of job openings increased to 11.0 million in December, above market expectations of 10.25 million. Over the month, the largest increases were in accommodation and food services (+409K), retail (+134K), and construction (+82K). On the other hand, the number of available positions decreased in information (-107K). The number of hires and total separations changed little at 6.2 million and 5.9 million, respectively, while the rate of hires stayed at 4%. Within separations, quits (4.1 million) and layoffs and discharges (1.5 million) changed little. The ratio of openings to unemployed people rose to a near record-high 1.9 from 1.7 a month earlier and compared to 1.2 before the pandemic.
Why it Matters: Sizeable miss to the upside in Decembers JOLTs data with a large increase in accommodation and food services openings and no real change in hiring and separations. Small businesses continue to have the highest level of openings and separations, with mid and large-sized firms seeing decreases in both. Layoffs increased to 1.5 million in December and are now 15% higher than a year earlier when there were 1.3 million layoffs. December layoffs were driven by job cuts in infrastructure, business services, and hospitality industries. Overall, this data series is looking increasingly suspicious, but it may just be that firms are waiting to close openings in the new year, something we will find out next month.

*Despite our expectations for a cooling in labor markets, given headlines and weaker demand reading seen elsewhere, the level of openings jumped higher, driving the openings to available workers ratio back to near highs at 1.9

*Lower-paying service jobs were the primary driver of the increase in openings, with higher-paying service openings falling

*Layoffs ticked higher, as expected, but remain well below pre-pandemic levels, while quits remain well above.
The Challenger Job Cuts Report showed that U.S.-based employers announced 103K job cuts in January, the most since September 2020, and compared to 43.651K in December. The technology sector announced the most cuts with 41.8K, 41% of all cuts, and the second highest on record. Retailers announced the second-most cuts with 13K, followed by real estate with 2.2K. Meanwhile, employers announced plans to hire 32.8K workers, primarily in entertainment/leisure. This is down 58% from a year earlier and 37% from December 2022.
Why it Matters: It was the highest January total since 2009, when 241.7K were announced, and companies look to increasingly be preparing for an economic slowdown, cutting workers and slowing hiring.“We’re now on the other side of the hiring frenzy of the pandemic years,” said Andrew Challenger, labor expert and Senior Vice President of Challenger, Gray & Christmas. With hiring plans also falling after a tick higher in December and those being highly concentrated in one sector, it looks like this is the canary in the coal mine, indicating a cooling in labor markets has meaningfully started even as NFP and UER remain historically strong.

*The largest level of job cuts for January since the GFC, with the Tech sector below 50% of those cuts as well as hiring plans falling too, indicates that firms are increasingly cutting costs

*“Market/Economic Conditions” was overwhelmingly given as the reason for the cuts
Compensation costs for workers increased 1% in Q4 ‘22, below a 1.2% rise in the previous quarter and slightly lower than market forecasts of 1.1%. Wages and salaries increased by 1%, and benefit costs rose by 0.8%, also lower than 1.3% and 1%, respectively, in the previous period. Year-on-year, compensation costs rose 5.1%, slightly above 5% in Q3, but adjusted for inflation, they fell by -1.3%.
Why it Matters: The trend lower in overall compensation is certainly a positive for Fed officials, helping them take comfort that inflation, especially wage increases, has peaked. Service-providing industries rose by 1% QoQ, decelerating from 1.2% QoQ. Education and health services compensation costs rose by the most in Q4, with wages higher by 1.4% QoQ. However, this was a deceleration from 1.7% in Q3. Likewise, Goods-producing industries also saw a deceleration to 1% QoQ from 1.3%. It’s likely that ECI will continue to cool moving forward, given the loosening of labor markets and the coming decrease in turnover.

*Quarterly increases in total compensation cooled slightly in Q4, and moving forward, annual comparables will become increasingly challenging, driving the YoY rate lower

*The Philips curve was thrown “out of wack” due to the pandemic but looks to be slowly reapproaching a more historically normal range
Construction spending declined by -0.4% month-over-month to $1.81 trillion in December, falling from an upwardly revised 0.5% expansion in the previous month and missing market forecasts of flat growth. Both spending in private and public construction sank by -0.4% on the month. Residential construction fell by -0.3% MoM, driven lower by private single new family (-2.3% MoM), while private multi-unit (3.2%) rose. Nonresidential fell by -0.5%, with decreases in office (-0.5% MoM) and manufacturing (-2.2% MoM) being the largest drivers, while commercial (0.5% MoM) increased. On the public side, highway and street (1.1% MoM) was the largest gainer by size, while education (-0.3% MoM) was the largest detractor.
Why it Matter: There was a broader cooling in construction activity in December, with ten out of the 27 sub-level categories lower for both private and public sector activity contracting. Multi-unit residential construction and road works continue to be strong. On the other hand, single-family residential and increasingly manufacturing and educational construction continue to contract. Total private new single-family construction is now lower by -14.7% on an annual basis, and as the most significant contributor, it is driving the overall headline reading lower. However, as other housing activity readings have stabilized, this area may no longer be a significant drag to overall construction activity moving forward.

*Private nonresidential may now be peaking as well, following private residential lower as demand cools for manufacturing and offices
The S&P CoreLogic Case-Shiller 20-city home price index rose 6.8% year-on-year in November, the least since September of 2020 and well below an upwardly revised 8.7% rise in October. The National Home Price NSA Index fell to a 7.7% annual gain in November from 9.2% in the previous month. The 10-City Composite annual increase came in at 6.3%, down from 8.0% in the previous month. Before seasonal adjustments, the U.S. National Index posted a -0.6% month-over-month decrease in November, while the 10-City and 20-City Composites posted decreases of -0.7% and -0.8%, respectively.
Why it Matters: The monthly decline was little changed for Case-Shiller in November from October, but in combination, and given comparables a year earlier, continues to lead to a notable drop in the annual rate. Elsewhere, the nationwide FHFA Home Price Index House prices fell by -0.1% in November compared to October. “U.S. house prices were largely unchanged in the last four months and remained near the peak levels reached over the summer of 2022,” said Nataliya Polkovnichenko, Ph.D., Supervisory Economist, in FHFA’s Division of Research and Statistics. “While higher mortgage rates have suppressed demand, low inventories of homes for sale have helped maintain relatively flat house prices.” Basically, prices aren’t coming down as much as simply not rising further, and as a result, annual index increases are lessening.

*Monthly decreases in home prices have moderated, but given the substantial gains in the prior year, comparables are leading annual readings to fall fast

*FHFA HPI has shown weaker monthly declines than Case-Shiller, keeping the nationwide annual increase higher
The Conference Board’s Consumer Confidence Index decreased to 107.1 in January, following an upwardly revised increase to 109 in December. The Present Situation Index (based on consumers’ assessment of current business and labor market conditions) increased to 150.9 from 147.4 last month due to increases in both assessments of business and labor conditions. The Expectations Index (based on consumers’ short-term outlook for income, business, and labor market conditions) fell to 77.8 from 83.4, partially reversing its December gain due to declines in business and labor markets expectations, although short-term income prospects held steady. Both present situation and expectations indexes were revised up slightly in December.
Why it Matters: An Expectations Index below 80 often signals a recession within the next year. “Consumers’ assessment of present economic and labor market conditions improved at the start of 2023. However, the Expectations Index retreated in January, reflecting their concerns about the economy over the next six months. Consumers were less upbeat about the short-term outlook for jobs. They also expect business conditions to worsen in the near term. Despite that, consumers expect their incomes to remain relatively stable in the months ahead. Meanwhile, purchasing plans for autos and appliances held steady, but fewer consumers are planning to buy a home, new or existing. Consumers’ expectations for inflation ticked up slightly from 6.6 percent to 6.8 percent over the next 12 months, but inflation expectations are still down from its peak of 7.9 percent last seen in June,” said Ataman Ozyildirim, Senior Director, Economics at The Conference Board. Present assessments of the labor market are the only positive contributor to the overall index currently.

*Declines in the headline index were driven by a drop in future expectations, as the assessment of current conditions improved due to views on the labor market

*Consumers were “less upbeat” about short-term business conditions and labor market outlooks
The ISM Services PMI increased to 55.2 in January, rebounding from over a 2-1/2 year low of 49.2 in December and beating market forecasts of 50.4. Demand and activity measures all improved, with New Orders (60.4 vs. 45.2) massively increasing, followed by a notable jump higher in New Export Orders (59 vs. 47.7, and Back of Orders (52.9 vs. 51.5). Inventories (49.2 vs. 45.1) normalized to a more neutral reading, although inventory sentiment remained expansionary. Employment (50 vs. 49.4) was unchanged. Inflationary pressures eased somewhat, with Price (67.8 vs. 68.1) readings falling slightly and Supplier Deliveries (50 vs. 48.5) rising to a more neutral reading.
Why it Matters: There was a large bounce back in demand and activity sentiment, to say the least, after a move at the headline level into contractionary territory in December. This sizeable retracement back into expansionary territory, especially seen in the moves higher in new orders and exports, shows the danger in using survey-based softer data over hard data, as respondents can let their emotions get the best of them. However, with that said, it is still a positive sign that service sector respondents indicated a pick-up in demand and activity after slowing somewhat dramatically in December. The majority of companies indicated that business is trending in a positive direction. “Business Survey Committee respondents indicated that capacity and logistics performance continues to improve. Although responses varied by industry and company, the majority of panelists indicated that business is trending in a positive direction. Employment was unchanged for the month. Some companies still find it difficult to fill open positions, while others are facilitating staff reductions,”said Anthony Nieves, Chair of the Institute for Supply Management.
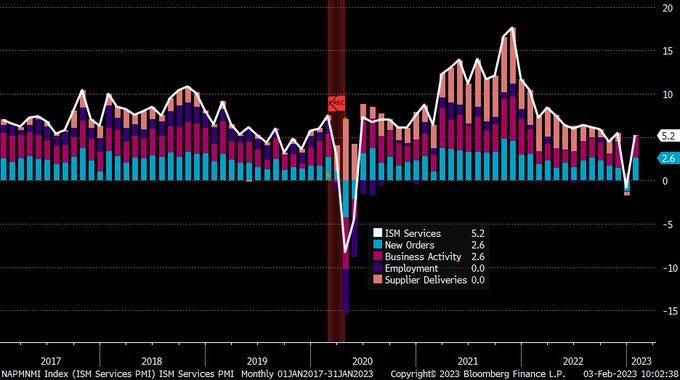
*Notable bounce back in the headline survey reading due to large moves into the expansionary territory by New Orders and Business Activity

*Broad rises in all but Prices and Inventory Sentiment, which were little changed

*It continues to be a tale of two cities with certain firms reporting growing businesses and improving supply chains and other, well, not
The ISM Manufacturing PMI fell to 47.4 in January from 48.4 in December and below market forecasts of 48. Demand and activity measures were mixed, with New Orders (42.5 vs. 45.1 in Dec), Production (48 vs. 48.6), decreasing, but the Backlogs of Orders (43.4 vs. 41.4), Imports (47.8 vs. 45.1), and New Export Orders (49.4 vs.46.2) improving, albeit still in contractionary territory. Inventories (50.2 vs. 52.3) moved to a more neutral level, while Supplier Deliveries (45.6 vs. 45.1) were little changed. Prices (44.5 vs. 39.4) increased but remained well in contractionary territory. Employment (50.6 vs. 50.8) remained near a neutral level.
Why it Matters: Declines in new orders, production, and inventory measures drove the headline reading lower, while elsewhere, other sub-indexes expanded. In general, demand cooled further, output/consumption was negative, and inputs remained accommodative. Only one of the six biggest manufacturing industries, transportation equipment, registered growth in January. Electronic components continued to be short in supply, now pushing over two years at that status. Respondent comments were more neutral, with several firms noting stable/growing demand while cost pressures fell. However, others noted a softening in demand and customers demanding price cuts. “New order rates remain depressed due to buyer and supplier disagreements regarding price levels and delivery lead times; these should be resolved by the second quarter. In the meantime, panelists’ companies are attempting to maintain headcount levels during the anticipated slow first half in preparation for a strong performance in the second half of 2023. 86% of manufacturing gross domestic product is contracting, up from 85% in December. However, 26% of sector industries had a composite PMI calculation of below 45% in January (a stronger indication of industry sluggishness), down from 35% the previous month,” says Timothy Fiore, Chair of the Institute for Supply Management.

*Employment and Inventories are the last sub-indexes to remain in expansionary territory, with firms continuing to note a desire to retain qualified workers.

*Five up, five down, with the manufacturing sector contracting at a faster pace for three months now

*Comments were bifurcated, with some firms coming across optimistic and others predicting a recession
The Chicago PMI fell to 44.3 in January from 44.9 in December and compared to market forecasts of 45. Production rose 8.5 in January to 48.6 but remained contractive. Demand measures, as seen in New Orders (-2.7 points to 40.6) and Order Backlogs (-19.2 points to 35.5), fell, reversing gains seen in December. Employment (-0.6 points to 42.0 ) fell to a four-month low as one-quarter of firms reported lower employment levels. Supplier Deliveries (1.4 points to 54.9) rose while Inventories (-4.6 points to 44.9) declined as firms continued to work down excess inventory. Prices Paid (7.4 points to 72.5) increased in January, breaking a five-month streak of declining prices.
Why it Matters: The reading pointed to a fifth consecutive month of contraction in business activity in the Chicago region. Responses continued to flag a slowing economy and weaker sentiment/outlook, filtering into lower production levels alongside harsh winter conditions. Labor shortages continued to hamper business activity and were reported by some firms as making up the greatest bottleneck to production.

*Price increased somewhat notably, while activity and demand measures continued to show contractionary readings
The Dallas Fed’s Manufacturing Index showed that general business activity in Texas rose to -8.4 in January from an upwardly revised -20 in December. Production (0.2 vs. 9.1 in Dec) fell to a near-neutral level, while New Orders (-4 vs. 11) improved but remained contractionary. Other measures of demand/activity, such as the Growth Rate of Orders (12.3 vs. 9.3), Unfilled Orders (-6.7 vs. -1.3), and Shipments (-6.3 vs. 0.4), all declined. Price pressures fell further, with Prices Paid (20.5 vs. 21.9) and Received (9.9 vs. 10.9) both lower, while Delivery Times (-0.2 vs. -1) moved closer to neutral. Employment measures were mixed, with overall Employment (17.6 vs. 13.6) increasing, while Wages (30.5 vs. 34.2) and Hours Worked (3.8 vs. 5.6) both fell. Finally, Inventories (-8.9 vs. -3.3) contracted further while Capital Expenditures (11.6 vs. -2.5) increased notably. The six-month ahead future outlook was significantly more positive despite the headline General Business Activity index remaining negative. Every category other than delivery times and prices paid and received increased, which is what you want to see.
Why it Matters: Despite the headline rise, current readings on demand and activity moved further into contractionary territory. Employment data was also more neutral, while price pressures eased further, painting a more supportive picture that inflation was continuing to fall. Increases in capital expenditure bucked the trend seen elsewhere, with a notable move back into expansionary territory there. The forward outlook indicated a much higher level of business confidence while also showing a further belief that future inflationary pressures would continue to ease. On the whole, the report was more positive than the headline general business readings indicated due to the more positive future outlook.

*The General Business Activity index improved but remained contractionary, although new orders moved back toward neutral

*Employment readings were more neutral with the number of employees growing, while compensation and workweek readings cooled

*Future readings improved broadly, especially for demand readings, while inflationary pressures were expected to fall further
Policy Talk:
The FOMC raised its benchmark Fed funds rate by 25 bps, as expected, to a target range of 4.5%-4.75%. The prepared remarks were more balanced, with the committee retaining its pledge to have “ongoing increases” in rates, confirming plans in the December SEPs to hike by an additional quarter point in both March and May. Powell said it would take a “couple more” hikes to get to an appropriately restrictive policy in the presser. Still, Powell noted the committee believed the disinflationary process had started. He cited supply-chain improvements and falling prices in new leases as evidence of this. However, the focus remained on the services sector, excluding housing, where a very tight labor market may influence prices, he said. Powell did not push back on the recent easing in financial conditions, focusing more on the long-term tightening that had occurred. He also didn’t dispute the market pricing of the future Fed’s rate path, saying it mainly reflects a market view that inflation will come down more quickly than he expects. The market put heavier weight on Powell’s press conference remarks verse the official statement, which mentioned deflation numerous times and again did not push back on looser financial conditions or rate-cut pricing. In summary, the Fed’s attempt to project “hawkish resolve” did not stick, and instead, the “disinflation is underway” message indicated that the path to reaching the terminal rate in March after one more 25 bps hike if the data continued to break the right way on inflation and wages was possible.
“So it is important that overall financial conditions continue to reflect the policy restraint that we’re putting in place in order to bring inflation down to 2 percent, and, of course, financial conditions have tightened very significantly over the past year. I would say that our focus is not on short-term moves but on sustained changes to broader financial conditions...”
“We do see wages moving down. If you look across the rest of the labor market, you still see very high payroll job creation, and you know, quits are still at an elevated level. So by many, many indicators, the job market is still very strong.”
“We expect to see that disinflation process will be seen, we hope soon, in the core services ex-housing sector that I talked about. We don’t see it yet. You know, it’s seven or eight different kinds of services and not all of them that are the same. And, you know, we have a sense of what’s going on in each of those different subsections. Probably the biggest part of it, probably 60 percent of that, is—research would show it is sensitive to slack in the economy. And so the labor market will probably be important.”
“I would look across the rate—the spectrum of rates and see that real rates are now positive by—you know, by an appropriate set of measures, are positive across the yield curve. I think policy is restrictive. We’re trying to make a fine judgment about how much is restrictive enough, that’s all. And we’re going to—you know, that’s why we’re slowing down to 25 basis points. We’re going to be carefully watching the economy and watching inflation and watching the progress of the disinflationary process.”
“I do think there are a number of dimensions through which the labor market can soften. And so far we’ve got, as I mentioned in goods, we have inflation moving down without a softening in the labor market. I think most forecasters would say that unemployment will probably rise a bit from here, but I still think, I continue to think, that there’s a path to getting inflation back down to 2 percent without a really significant economic decline or a significant increase in unemployment.”

*The official Fed funds rate is now higher than the annual core PCE rate, indicating that policy is undoubtedly in restrictive territory

*Markets continue to price in 50bps of cuts in the seconf half of ‘23

*Important to use effective Fed funds as rate hikes end, but QT continues
Technicals and Charts:
Four Key Macro House Charts:
Growth/Value Ratio: Growth is little changed on the day and the week, and Mid-Cap Growth is the best-performing size/factor on the day.

Chinese Iron Ore Future Price: Iron Ore futures are lower on the day and the week.

5yr-30yr Treasury Spread: The curve is flatter on the day and the week.

EUR/JPY FX Cross: The Euro is stronger on the day and the week.

Other Charts:

The Nasdaq has definitively broken through the ’22 downtrend resistance but, unlike the S&P, is still some ways from forming a golden cross given the greater losses it incurred

Option mania is back following Meta’s beat and outsized bullish reaction, with option volumes exceeding the prior peak of 1/27/21 during the "Meme Stock Top," which shortly thereafter saw the peak in other speculative areas of the market, such as SPACs and profitless tech. “We see yesterday as another medium-term peak in speculation.” - Julian Emanuel, Evercore ISI

Recent gains in equities came from multiple expansions, while forward EPS estimates continue to fall

Credit spreads continue to tighten and are now at historical levels that suggest little further upside despite an improving economic outlook and the end of Fed tightening. “A chart that should make every investor think “ - @fkronawitter1

Bank of America’s strategist Savita Subramanian said tech might have more jobs to cut because the industry remains bloated. While the hiring spree in the past three years drove employee growth of 80%, real sales only grew 60% over that period. The data seem to imply that even after the first big round of job cuts, some companies are still 20% too big on average. Further, the estimated cost-cutting of 1.7% (of sales) so far should help to minimize margin compression, but sales have historically been a bigger driver of margins, and BofA strategists still see weakening demand and negative operating leverage as significant contributors to margin pressure moving forward.

RBC Capital Markets head of US equity strategy, Lori Calvasina, wrote that the stock market often bottoms well before layoffs are finished in industries of excess. Therefore, it’s not necessarily surprising that the market has rallied on some apparently awful news. But while it’s always difficult to tell exactly where we are in the cycle, the past performance of US equities during periods of layoff suggests that the end of the bear market is not yet in sight.

The IMF increased its global growth expectations, forecasting a rebound to 3.1% in 2024. For advanced economies, the slowdown will be more pronounced, with a decline from 2.7% last year to 1.2% and 1.4% this year and next. Nine out of 10 advanced economies will likely decelerate. Emerging market and developing economies have already bottomed out as a group, with growth expected to rise modestly to 4% and 4.2% this year and next. – IMF

Fourth-quarter Productivity and Cost data showed that productivity (3% vs. 1.4% in Q3) was higher than expected, while unit labor costs (1.1% vs. 2% in Q3) were down more than expected. It is the smallest increase in labor costs since the first quarter of 2021, reflecting a 4.1% increase in hourly compensation and a 3% increase in productivity.
Articles by Macro Themes:
Medium-term Themes:
China’s Pandemic:
Bouncing Back: China’s manufacturing and services expanded for the first time in four months in January as the reopening from Covid Zero continued and the Lunar New Year holiday spurred travel and spending. A sub-index measuring services activity jumped to 54 from 39.4, suggesting residents became more willing to travel and spend money during the holiday season after three years of stringent mobility rules. The employment sub-index for non-manufacturing improved to 46.7 from 42.9, the highest level in five months. The International Monetary Fund on Tuesday raised its global economic growth outlook to 2.9%, the first increase in a year, alongside an upgrade to China’s estimated expansion. It now expects China's economy to grow by 5.2% in 2023. - China’s Economic Activity Rebounds Sharply After Reopening - Bloomberg

Rural Spread: Public health experts and economists have been closely watching the situation in China’s countryside around the holidays because of concerns that migrant workers returning to their rural hometowns could bring a surge in Covid cases and swamp local healthcare systems. Remittances by migrant workers to family members in rural areas fell during the pandemic, with eight out of 10 households that rely heavily on such contributions seeing an income drop of at least 10% during China’s initial effort to eradicate the virus in 2020. It isn’t known how remittance levels have changed more recently, although many migrant workers have reported continuing to struggle financially. - Covid Hits China’s Rural Poor: ‘The Impact on the Village Economy Is Huge’ – WSJ

Longer-term Themes:
Energy’s Midlife Crisis:
Postponed Retirement: According to a federal power ministry notice, India has asked utilities not to retire coal-fired power plants until 2030 due to a surge in electricity demand, just over two years after committing to phasing them down. The government had not set a time frame for shutting down coal-fired power plants but said last year that it would reduce the electricity output of at least 81 of the 179 coal-fired power plants operating in India over the next four years. This plan now looks delayed. India is the world’s second-largest importer of coal, which accounts for three-quarters of its annual electricity generation. Separately, last month, the government announced plans to build more nuclear power plants to boost India’s clean energy generation. - India asks utilities to not retire coal-fired power plants till 2030 - Reuters

Growing Concern: German Chancellor Scholz is using a trip to Latin America to help Germany secure additional supplies of the lithium that its car giants will need for their electric-vehicle batteries. Chile is the world’s second-largest supplier of lithium after Australia, and much of its output is currently gobbled up by China. Part of Germany’s strategy to get Chile on board is to have more of the production process based locally and to help make extraction and processing less damaging to the environment. Major developed nations like Germany are competing fiercely for increasingly scarce resources, and access to metals and rare earths is crucial for the transition to cleaner and more technologically advanced economies. - Scholz Seeks to End China’s Lithium Dominance in South America - Bloomberg

Scenarios Lower: The latest annual energy outlook from the economists at BP says Russia’s war in Ukraine will accelerate the shift away from oil and gas as countries around the world prioritize domestic renewable energy sources as a way to increase the security of supply while also cutting carbon emissions. The oil major sees a much sharper decline in demand for fossil fuels by 2035 compared with its analysis conducted before last year’s invasion. The British oil major’s annual energy outlook posits three potential scenarios that differ in how quickly climate action cuts carbon emissions. All of them see oil and gas demand declining as renewables grow and transport electrifies in the coming decades, but the pace of change is uncertain. - Russia’s War in Ukraine is Accelerating the Shift Away From Oil and Gas, BP Says - Bloomberg

Rapidly Cutting: Total fossil generation could drop by 20% this year in the Eurozone, with relatively expensive natural gas-fired generation falling the fastest, according to Ember, a UK-based energy think tank. Europe has raced to find alternative energy sources after Russia cut gas flows in the wake of its invasion of Ukraine, sending energy costs soaring. That led to greater reliance on fossil fuels, partially due to a drop in nuclear and hydropower, and contributed to an increase in emissions. Still, solar and wind energy filled in much of the gap, producing a record 22% of the EU’s electricity last year and overtaking gas for the first time. High power costs also helped lower energy demand by about 8% in the fourth quarter of 2022, compared to the same period a year prior. If the trajectory of more renewables and less demand continues, it could contribute to a substantial decline in fossil fuel use in 2023. - Europe’s Fossil Fuel Use Is Set to Plummet in 2023, Report Says – Bloomberg

Cyber Life and Digital Rights:
Digital Opium Wars: TikTok CEO Shou Zi Chew has agreed to testify before the House Energy and Commerce Committee on March 23, his first-ever appearance before a Congressional committee. Per this morning's committee statement, Chew will be asked about "TikTok's consumer privacy and data security practices, the platforms' impact on kids, and their relationship with the Chinese Communist Party." A new law in February bans TikTok from federal government employees' work devices while it is also banned on government-issued devices in more than a dozen states, while several large U.S. universities have barred it from their WiFi networks. The House Foreign Affairs Committee next month plans to vote on a new bill to ban TikTok in the U.S. - TikTok CEO will testify in Congress, as pressure mounts - Axios

Food: Security, Innovations, and Climate Change Implications:
CRISPR Bugs: For decades, the grape growers of California have battled Pierce’s Disease, a nasty infection that causes vines to wither. The arrival of an invasive insect around the late ‘80s supercharged the spread of the disease, turning it from a nuisance to a nightmare. The disease still has no cure, and it’s at risk of getting worse due to climate change. But an unlikely solution has arrived in the form of CRISPR gene-editing technology, which allows researchers to change the pest’s genome so that it can no longer spread the bacterium. - How CRISPR could help save crops from the devastation caused by pests – MIT Tech Review

Authoritarianism in Trouble?:
Cleaning House: The Ukrainian authorities on Wednesday carried out dozens of searches across the country in connection with corruption allegations, two days before President Volodymyr Zelensky is scheduled to host leaders of the European Union to discuss issues, including his government’s efforts to clamp down on longstanding graft in Ukraine. With billions of dollars in aid flowing into Ukraine monthly, Zelensky is under pressure from Western backers to take a firm stance against endemic Ukrainian corruption. He also faces calls from ordinary Ukrainians who are fighting and dying in the country’s war with Russia to uproot corruption for good. Zelensky said his government is working on “new reforms” that will make the country “more human, transparent and effective” as he prepares to meet European Union officials on Friday for talks on Ukraine’s possible accession to the bloc. - Ukraine Carries Out Wide Anticorruption Raids Ahead of Visit From E.U. Leaders - NYT

Hijab Revolution: Four months after a nationwide uprising erupted in Iran, a lethal crackdown and an ailing economy have quieted antigovernment street demonstrations. Yet protests, which have become more frequent in the past decade, are likely to continue, driven by a younger, more secular generation of Iranians who increasingly outnumber the aging vanguard of the 1979 Islamic Revolution. The protesters’ challenge of laws requiring women to wear a hijab is a swipe at one of the ideological pillars of the Islamic Republic. Iranian authorities this month ordered police to issue fines to women who break the country’s female dress code, as well as imposed penalties on taxis and restaurants that allow women to enter without a hijab. So far, it has had little effect. - Iran’s Deadly Street Protests Are Replaced by Quiet Acts of Rebellion – WSJ

Majority Say Keep Going: Almost one year after Russia's invasion of Ukraine, the "West" is still firmly behind Kyiv in no small part thanks to the US leading the way. But what do Americans think about their country's role in the conflict? In an exclusive new poll conducted by Maru Public Opinion for GZERO, more than three-quarters of respondents say they want the U.S. to remain "involved" in the war, with the majority preferring to send weapons and funding as opposed to sanctions. Almost one-quarter would rather the U.S. stay away, and just 8% support crossing the border with American troops. Meanwhile, 70% agree with the Biden administration's recent decision to send US-made tanks to Ukraine. - Americans and Ukraine: war and tanks – Maru Public Opinion and GZERO
ESG versus the World:
Keeping Up: The EU is planning to hit back at the Inflation Reduction Act by easing restrictions and relaxing state-aid rules to support investment in green sectors, including via the creation of tax benefits. Brussels also intends to simplify and accelerate approvals for projects of common European interest involving several countries and will set overall targets for green industrial capacity by 2030. Member states are divided over whether and for how long to allow big exemptions from rules to police state aid. Some countries in the south warn that it risks tilting the level playing field by disproportionately aiding rich countries to pour money into their companies. - EU to relax curbs on tax credits in response to US green subsidies - FT

Asian Tigers 2.0:
Quad Building: The U.S. is launching a series of ambitious technology, space, and defense initiatives with India in an effort designed to counter China in the Indo-Pacific and wean New Delhi off its reliance on Russia for weapons. U.S. national security adviser Jake Sullivan and his Indian counterpart Ajit Doval met in Washington on Tuesday as the two countries unveiled cooperation in a number of areas, including quantum computing, artificial intelligence, 5G wireless networks, and semiconductors. They also created a mechanism to facilitate joint weapons production. - US and India launch ambitious tech and defence initiatives - FT

Cold Places (Deep Sea, Artic, and Space Colonization):
Sat Wars: In March, India became only the fourth country in the world (after Russia, the US, and China) to successfully destroy a satellite in orbit. Mission Shakti, as it was called, was a demonstration of a direct-ascent anti-satellite weapon (ASAT), or in plain English, a missile launched from the ground. As satellites become more intertwined with every aspect of civilian life and military operations, the chances are increasing that someone, somewhere, will decide that attacking a satellite is worth the risk and just possibly trigger the world’s first full-blown space war. There are also other ways to disrupt satellites, such as spoofing and jamming, which are currently occurring and the article reviews these. - How to fight a war in space (and get away with it) – MIT Tech Review

VIEWS EXPRESSED IN "CONTENT" ON THIS WEBSITE OR POSTED IN SOCIAL MEDIA AND OTHER PLATFORMS (COLLECTIVELY, "CONTENT DISTRIBUTION OUTLETS") ARE MY OWN. THE POSTS ARE NOT DIRECTED TO ANY INVESTORS OR POTENTIAL INVESTORS, AND DO NOT CONSTITUTE AN OFFER TO SELL -- OR A SOLICITATION OF AN OFFER TO BUY -- ANY SECURITIES, AND MAY NOT BE USED OR RELIED UPON IN EVALUATING THE MERITS OF ANY INVESTMENT.
THE CONTENT SHOULD NOT BE CONSTRUED AS OR RELIED UPON IN ANY MANNER AS INVESTMENT, LEGAL, TAX, OR OTHER ADVICE. YOU SHOULD CONSULT YOUR OWN ADVISERS AS TO LEGAL, BUSINESS, TAX, AND OTHER RELATED MATTERS CONCERNING ANY INVESTMENT. ANY PROJECTIONS, ESTIMATES, FORECASTS, TARGETS, PROSPECTS AND/OR OPINIONS EXPRESSED IN THESE MATERIALS ARE SUBJECT TO CHANGE WITHOUT NOTICE AND MAY DIFFER OR BE CONTRARY TO OPINIONS EXPRESSED BY OTHERS. ANY CHARTS PROVIDED HERE ARE FOR INFORMATIONAL PURPOSES ONLY, AND SHOULD NOT BE RELIED UPON WHEN MAKING ANY INVESTMENT DECISION. CERTAIN INFORMATION CONTAINED IN HERE HAS BEEN OBTAINED FROM THIRD-PARTY SOURCES. WHILE TAKEN FROM SOURCES BELIEVED TO BE RELIABLE, I HAVE NOT INDEPENDENTLY VERIFIED SUCH INFORMATION AND MAKES NO REPRESENTATIONS ABOUT THE ENDURING ACCURACY OF THE INFORMATION