


The Fed’s “Shock and Awe” Tightening Campaign is Finally Beating Inflation, Now Comes the Period of Weaker Growth – Midday Macro - 7/14/2023
Color on Markets, Economy, Policy, and Geopolitics

The Fed’s “Shock and Awe” Tightening Campaign is Finally Beating Inflation, Now Comes the Period of Weaker Growth – Midday Macro - 7/14/2023
Daily/Weekly Price Action and Headlines:
Equities are lower on the day but higher on the week, with a broad rally up until today driven by inflation data that came in better-than-expected, alleviating further Fed tightening fears, while the Q2 earnings season started positively
Treasuries are lower on the day but higher on the week, with the better CPI report driving yields off recent highs and steepening the curve, although today’s better-than-expected consumer sentiment readings saw a partial retracement of that
Oil is lower on the day but higher on the week, with a notable rally occurring until today’s pullback, as markets focused more on fundamentals with Saudi Arabia’s production cuts and Russia’s export curbs, as well as shutdowns in Libya outweighing inventory builds in the U.S.

Market’s Weekly Narrative:
The S&P is ending the week on a more negative note today, but the majority of sectors are still up more than 2% on the week with a tech/growth outperformance tilt, although breadth continued to improve as seen in the NYSE new highs-new lows index hitting a year-to-date high as well as a growing percent of stocks rising above 50 and 200-dma’s. This week's data showed that inflation continued to fall, both in the CPI report and through new readings on PPI and import/export prices. Sentiment also improved for both businesses and consumers, as seen by surprise increases in the NFIB and University of Michigan survey readings. However, the underlying details of the NFIB survey still showed a high level of uncertainty among small business owners, while consumer sentiment was only halfway back from its pre-pandemic level. The NY Fed’s Consumer sentiment survey also showed reduced inflation expectations but cooling spending intentions. And although more outdated, this also came through in a larger-than-expected drop in consumer credit usage in May. Finally, regarding new data, the Fed’s July Beige book indicated a further cooling in activity and reduced pricing power/intentions while labor turnover fell. Treasuries notably rallied on the cooler inflation data earlier in the week despite Fed officials mainly staying on message this week and effectively locking in a rate hike at their next meeting in two weeks. The curve also steepened as views regarding the duration the Fed will need to remain at the terminal rate fell, although some of that reversed today. Oil finally responded to expectations for a tighter balance in the second half of this year, with Saudi and Russian cuts as well as production disruptions elsewhere leading to a strong weekly rally that saw Brent touch above $80 at one point. Copper also rallied as China continued to drip out stimulus plans. The agg complex on aggregate was little changed with the weather outlook gyrating by region and worries about the “grain corridor” increasing. King Dollar is in danger of not being king as the $DXY broke below 100 and broadly and notably lower across most crosses, continuing weakness that started following last week’s jobs report.
Deeper Dive:
Inflation is done. Sorry, but this episode of higher prices is over. It just is. Not because some make-believe basket of goods and services fell further this week, as seen in the CPI report. Instead, because the forces that caused the mainly cost-push but also demand-pull global inflationary pulse are increasingly reversing, moving the demand and supply of goods and services into a more non-price accelerating level. Further, we don’t subscribe to the notion that the pandemic changed the structural level of inflation due to changes to the domestic or global economy. Labor participation rates in the U.S. and in many other places continue to rise, and with hiring intentions falling due to reduced capacity needs, wage pressures will follow. Further, although the world may seem divided politically, trade isn’t down because of some new divided world order; it's down because demand for goods is down after everyone bought too much during the pandemic. If anything, the current wave of supply-chain de-risking and reshoring will create a world of production redundancy and lower future pricing power in the manufacturing sector. Further, regarding the service sector, I challenge you to find one firm that didn’t “do more with less,” as labor shortages capped production capacity but increased per-worker productivity, something official productivity measures seem to have captured poorly. At the same time, many of these capacity-impaired firms invested in digital and physical automation, reducing labor's future bargaining power over capital and reducing wage-spiral fears. Without increased labor bargaining power, inflation will never become entrenched, as seen in the 70s and early 80s. As a result, we are more worried about inflation undershooting the Fed’s target next year than gliding to some new higher level, say around 3%.

*No matter how you cut it, inflation is increasingly falling

*Supply chains have mostly normalized from Covid. Ocean freight rates are lower, and inventories are also coming back into balance. This suggests that inflationary forces in the industrial sector are diminishing

*Leading indicators point to a further loosening of labor markets despite wage increases continuing at a higher pace in June’s job report, with drops in turnover reported in July’s Beige Book and seen in the Atlanta Fed’s wage tracker indicating reduced future wage pressures
Turning back to the present and where U.S. markets are today, conditions for the current rally to continue seem to be intact with strong seasonals in July price action and earning results, as well as recent tier-one data points like the jobs and CPI reports supporting investor sentiment and the rally’s momentum. Real rates have also fallen, and the dollar has weakened notably in the last week, both supportive of equities. All of this keeps the inflation falling and soft landing narrative alive, as markets have reduced Fed overtightening policy error fears. As readers know, we have been skeptical of this rally for some time due to the backup in yields and the belief that there will be a cooling in economic momentum in the second half of the year, weighing on the earnings outlook. We also expect the Fed to remain hawkishly tilted no matter what the data does. Powell learned a hard lesson after giving an overly optimistic assessment of “disinflationary” forces at the January FOMC meeting. As a result, with the coming July meeting a sure thing for a 25bp rate hike and the new trend now being a hike then pause, the Fed will likely keep markets thinking its June Fed Funds median SEP forecast is in play all the way up until November’s meeting. With markets seemingly shrugging off worries about the effects of tighter policy, chasing risk, and moving recessionary fears out a few more quarters, why would the Fed change its messaging now? However, as has been said for a long time, you can’t have your cake and eat it too, with the effects of the Fed’s “shock and awe” tightening campaign increasingly going to weigh on growth in the second half of this year, despite what Governor Waller thinks (he thinks its already hit significantly due to forward guidance), risk appetite will be tested as the data cools and valuations seem lofty.

*The SF Fed’s “Proxy” Fed funds rate, which uses public and private borrowing rates and spreads to infer the broader stance of monetary policy, is approaching 7%

*Earnings and growth forecasts continue to diverge from each other

*Sales and new orders continue to be generally reported as contracting in a variety of softer business survey data
This leaves markets currently at the beginning of what traditionally is a strong earnings season coming off a quarter of stronger-than-expected growth with consumer and business confidence more stable/positive due to falling inflation. As a result, it is easy to see how a future melt-up in equities could occur while credit markets are also benefitting from the general risk-on tone. In fact, the last week has shown a broad risk-on pulse, with everything from EM to crypto higher, although admittedly due to sometimes idiosyncratic reasons, as is the case with crypto. We expect updates on input costs to be a common focus in Q2 earnings calls, with firms noting they are rising less than expected, something business surveys continue to indicate, supporting margins and reducing the need to pass on price increases as aggressively, negating weaker future earning fears (or they are using AI). This will lead to better-than-expected Q2 earnings results coupled with stronger forward guidance. Of course, with markets up as much as they are for the year, one is left to wonder how much of this rosy outlook is already priced in. As a result, we maintain our long exposure to small-caps, an area that will benefit more materially from falling cost inputs and a still resilient consumer. We also expect stability in regional financials deposit outflows and revenues and an improved outlook on the energy sector due to higher oil prices, both sectors with heavier weighting in the Russell. Eventually, though, we believe the economy will hit the long-expected period of below-trend growth sometime in the fall. We don’t expect a traditional recession. With household and business balance sheets still healthy and aggregate real disposable income rising, this seems less likely. However, non-residential investments should cool due to higher financing costs and elevated uncertainty over future demand. At the same time, personal consumption expenditures will slow as households run down excess savings and normalize consumption behavior into the holidays. In combination, this will lower real final sales into year-end. On the periphery, inventory builds may be weaker in Q3 and Q4, as firms are reluctant to commit, weighing on the headline GDP. Further, we do not see residential investment meaningfully improving from current levels in the second half of the year despite improved housing industry activity so far this year. Instead, the current positive tilt is mainly due to supply shortages, which will change moving forward given the size of the construction pipeline.

*Capex intentions are falling, something that will increasingly be a drag on growth

*Payrolls will likely continue to cool into year-end, as surveys continue to show weakening hiring intentions

*There may be a notable headwind to consumption as millions have to restart repaying college tuition loans.
Please share our newsletter if you like it. We continue to gain readers and enjoy the feedback and conversations we have with many of you.
Please feel free to reach out with any questions or comments.
Thank you for reading! - Mike Ball
Policy Talk:
Governor Waller gave prepared remarks at a Money Marketeers of NYU event in NY titled “Big Shocks Travel Fast: Why Policy Lags May Be Shorter Than You Think.” He focused on how his outlook has evolved and the continued uncertainty over where the data has been. He highlighted that he supported keeping rates unchanged at the June meeting, stating that he did not see “evidence of substantial credit crunch was in the works, I felt that waiting another six weeks was prudent risk management. In the end, I believed that risk management concerns slightly outweighed hiking based on the incoming data.” However, he noted that he marked up his expected terminal Fed funds rate by 50bps. He went on to discuss how he thinks about the current lag effects of cumulative policy working, pushing back on the belief that policy has yet to hit the economy. He elaborated on what economists call an impulse response function when modeling the effects of a change in Fed policy on growth. He highlighted how forward guidance had changed the nature of the game, rendering traditional models based more on surprise changes in policy less effective in understanding the transmission mechanism of policy changes on the real economy. He surmised that the use of forward guidance reduces the lag effects of the current tightening cycle by six months. He went on to argue that the fast pace and strong degree of tightening the Fed did also means the lag effect should be shorter as consumers and businesses are hit by a “shock and awe” tightening campaign. He stated the economy continues to be strong and labor markets are not at a place that supports the Fed’s 2% target. He dismissed the recent CPI report as insufficient to change his views and noted that credit conditions aligned with policy objectives. He concluded by saying, “The robust strength of the labor market and the solid overall performance of the U.S. economy gives us room to tighten policy further.”
“While there is no consensus on an exact length of time, traditional rules of thumb say that the maximum effect of an unexpected policy change, what economists call a "shock," on the real economy is between 12 and 24 months. There is tremendous uncertainty around this estimate. Furthermore, commentary sometimes treats lagged effects as a "Wile E. Coyote" moment where nothing happens for a long time and then wham…off the cliff we go as the full force of past policy actions suddenly take effect.”
“Forward guidance is used to signal future policy actions and, when it is credible, financial markets price those expected actions into today's interest rates… This forward guidance effectively shaved off about 6 months from the usual 12- to 24-month lag that one might conjecture would be needed to see the 200 basis points of actual tightening affect the economy. That is, forward guidance shortens the lag time between when the policy rate changes and when the effects of actual policy tightening occur.”
“The effects of policy tightening last year are feeding through to market interest rates faster than typically thought because of announcement effects, and on top of this we have had policy rate changes that have been more dramatic and faster than in the past which most likely has led to a more rapid adjustment in the behavior of households and firms. These two points suggest that the effects of the large policy changes that we undertook last year should hit economic activity and inflation much faster than is typically predicted.”

San Fran Fed President Daly spoke with David Wessel at an event sponsored by the Brookings Institution. Daly gave an optimistic review of the economy, stating it is the better-than-expected growth is keeping the Fed thinking “there is more to do.” As a result, she supported the “pause” in June but believes there is a need for “a couple” more hikes before year-end due to the risk becoming more balanced. Daly went on to talk about how she had been going out on Sundays to talk to lower and middle-income shoppers and how this has affected her framing of the current inflationary situation. In summarizing how the current inflation pulse happened, she highlighted the disruptions to supply chains and quick rebound in demand as a global phenomenon, driving supply and demand out of balance. She surmised that there were three main reasons the economy hasn’t cooled as expected, given the degree of policy tightening. The first is longer lags or less rate sensitivity in the U.S. economy than in the past. Second, she believes the monetary policy mechanism is weaker than before. Finally, the economy had more momentum than what was understood. She highlighted the lessons the Fed learned, noting the unique shock of the pandemic to supply and demand made traditional models ineffective, and the tools the Fed has vary in effectiveness with varying lags. Finally, she noted this cultural bias the Fed had to fight the last war caused an inability to anticipate higher inflation in a timely manner. Wessel went on to press her about the failure of SVB and what supervisors could do differently. Daly gave an overview of the regulatory framework at both the Board level and for individual district Fed banks. She acknowledged that the bureaucracy of identifying problems in regulatory areas at SVB by the SF Fed caused a slow reaction in tackling red flags, covering for her team by saying that regulators “need to be careful.”
“We need to continue to raise rates in order to bridle those, the economy more, so that demand comes back in line with supply. But in that context, we also had the banking stresses in March, and those banking stresses can act, that can act like a credit shock, and they can themselves restrain. So we're balancing the risks to the economy going forward against the incoming information, which is about strength.”
“But we have all these tools, forward guidance, the funds rate, the balance sheet, and they were all very, very helpful. I mean, essential, I would say. But one of the things you learn from them is that they're not all equally agile. And so, for guidance, that's a fairly easy and agile tool. We can change what we say. The Fed funds rate turns out to be a pretty agile tool. The balance sheet, that's not such an agile tool, right? You get that thing going, and it takes a while to change its direction because abrupt changes could influence or dislocate financial markets.”

Cleveland Fed President Mester gave prepared remarks titled “An Update on the Economy and Monetary Policy,” which, as advertised, gave an overview of where she sees things currently. Mester reviewed recent policy decisions and noted the Fed’s actions have led to a broader tightening in financial conditions, with banks tightening their lending standards while Treasury yields, mortgage rates, and credit spreads have all risen. Mester recounted how the pandemic led to “imbalances between demand and supply, in an environment of accommodative fiscal and monetary policy, led to an increase in inflation starting in the spring of 2021.” However, she noted that “real GDP grew at a below-trend pace of less than 1% last year, down from a very robust pace of about 5‑3/4 percent in 2021. The slowdown in activity is most apparent in interest-rate-sensitive sectors, including housing, manufacturing, and business investment.” However, growth this year has been stronger than expected, accompanied by improvements in supply-side impairments, making forecasting harder. Mester highlighted that housing has also been stronger due to inventory shortages and reviewed the supply/demand dynamics that led to the labor market tightening, something she said was now reversing. However, due to weak productivity gains, wage increases were still inflationary. She gave an overview of how she sees inflation, connecting the high wage levels to why core service inflation remained sticky. Mester concluded with her views on policy, noting it is “now in restrictive territory; it is less restrictive compared to many historical tightening cycles.” She remarked that “as inflation falls, the real rate will rise even without further increases in the nominal fed funds rate. Waiting for that passive tightening to happen, though, risks allowing inflation to remain elevated for longer.” As a result, she clearly endorsed further tightening as a better risk management practice despite inflation expectations remaining anchored and signs inflation is subsiding.
“The economic outlook has been difficult to pin down partly because the pandemic and the responses to it from households, businesses, and monetary and fiscal policymakers are still affecting the economy.”
“The pandemic has had profound effects on the labor market. When the economy reopened, labor demand well-outpaced labor supply, putting upward pressure on wages and price inflation. Progress is now being made in bringing demand and supply into better balance, but it is slow progress, and demand is still outpacing supply.”
“Indeed, for wage growth at the current pace to be consistent with price stability, trend productivity growth would need to be 2-1/2 to 3 percent instead of the current estimates of 1 to 1-1/2 percent. We have not seen any evidence that trend productivity growth is rising; in fact, productivity has declined over the past year.”
“To achieve our longer-run goal of 2 percent inflation, we will need to see continued sustained disinflation in the prices of goods, housing, and core services excluding housing. And to achieve that, we will need to see further moderation of demand in both product and labor markets.”

The NY Fed’s Survey of Consumer Expectations report showed year-ahead inflation expectations fell for a third consecutive month to 3.8% in June from 4.1% in May, the lowest since April of 2021. Inflation expectations for the three-year-ahead horizon remained unchanged at 3%, while the five-year horizon increased by 0.3 percentage points to 3%, the highest reading since March 2022. Median inflation uncertainty declined across all three horizons.
Expected price changes declined for gas (-0.4 percentage point to 4.7%) and food (-0.1 percentage point to 5.3%) but increased medical care (+0.1 percentage point to 9.3%) and rent (+0.3 percentage point to 9.4%). Also, home price growth expectations increased for the fifth consecutive month to 2.9%, the highest reading since July of 2022.
One-year-ahead expected earnings growth increased to 3.0%, staying within its two-year range, while unemployment expectations decreased by 2.3 percentage points to 37.7%, the lowest reading since April 2022. However, the perceived probability of losing one's job in the next 12 months increased to 12.9%, the highest reading since November 2021. Further, the probability of leaving one's job voluntarily or finding a job decreased.
Household spending growth expectations declined from 5.6% in May to 5.2% in June, well below its 12-month trailing average of 6.4% and the lowest reading since September 2021. However, perceptions of current and future credit access compared to a year ago improved somewhat. This contrasts with the perceived likelihood of missing a debt payment over the next three months increasing to 12.0% in June, the highest reading since January 2023. Perceptions about households' current and future financial situations improved in June
Why it Matters: Despite the headline drop in year-ahead inflation due to lower outlooks for gasoline and food inflation, consumers seem convinced that medical bills, rents, and college tuition are going to rise sharply. Further, consumers’ expectations for house prices are rising again to their highest reading since last July. There’s also some sign of pessimism about unemployment, with the mean perceived probability of losing one’s job in the next 12 months climbing to its highest reading since November 2021. This complements declines in expected household spending despite better-perceived access to credit and an improved outlook on overall financial situations. All in all, a little bit of a mixed message on where consumer sentiment is due to conflicting current and future perceptions.

*One-year ahead expectations continued to trend lower while longer-term expectations remain range-bound

*Falling inflation uncertainty is a good sign that the current trend lower will stay intact

*However, underlying expectations for specific categories vary, with rents, medical care, and college education ticking higher in June
Total consumer credit increased by $7.24 billion in May, following a downwardly revised $20.32 billion rise in April and well below market expectations of a $20.25 billion rise. Revolving credit growth slowed to $8.5 billion from an upwardly revised $14.2 billion in the prior month, moving the annual rate to 8.2% compared to 13.8% in April. Non-Revolving credit actually fell by $1.25 billion or -0.4% YoY change, following a downwardly revised $6.15 billion gain in the prior month.
Why it Matters: Consumer credit came in much lower than anticipated, with May being the smallest total monthly gain since November 2020, as real consumer credit notably weakened, especially non-revolving, which reflected a broad slowdown in autos, housing, and student debt. With five-year lending rates for new-vehicle purchases reaching 7.8% in May, the highest since 2006, as well as mortgage rates near their own recent highs, it's not surprising borrowing is slowing. However, the drop in revolving credit was also notable and indicative of a consumer increasingly prioritizing restraint in spending verse leveraging up as credit card lending rates are also at new cycle highs, near 22%. Looking ahead, the finances of households with student debt are poised to be strained further. More than 40 million Americans will resume student-loan payments this fall after a three-year pause.

*Total consumer credit increased by less than expected due to rising financing costs and falling demand

*Real revolving credit is nearing pre-pandemic levels, but rising credit card financing rates have slowed growth even as inflation falls
The Fed’s July Beige Book showed economic activity increased slightly since its last report in late May, with five districts reporting modest growth, five seeing no change, and two reporting modest declines. Consumer spending was mixed, with growth observed more in consumer services and some retailers noting shifts away from discretionary spending. However, at the same time, tourism and travel activity were reported as robust, and “hospitality contacts expected a busy summer season.” Auto sales continued to exhibit moderate growth across most districts. Manufacturing activity was mixed, while transportation activity was down or flat. Banking conditions showed lending activity continued to soften. However, despite this and higher mortgage rates, demand for residential real estate remained steady, although constrained by low inventories. Construction for both residential and commercial was slightly lower. Agricultural conditions were mixed and expected to soften while energy activity decreased. Overall economic expectations were for slower growth.

Employment increased modestly in most districts as labor demand remained healthy, though some contacts reported that hiring was getting more targeted and selective. “Employers continued to have difficulty finding workers, particularly in health care, transportation, and hospitality, and for high-skilled positions in general.” However, labor availability was reported as better, and employers were, on aggregate, having an easier time hiring while turnover rates were returning to pre-pandemic norms. Wages continued to rise, but more moderately, nearing pre-pandemic levels.

Prices rose at a “modest pace overall,” with several districts seeing a slowing in the pace of increase. Firms reported varying levels at which they were able to pass along cost increases. Some contacts noted reluctance to raise prices because consumers had grown more sensitive to prices. Input cost pressures remained elevated for services firms but eased notably in the manufacturing sector. Shipping costs continued to decrease, along with the prices for many construction inputs. Price expectations were generally stable or lower over the next several months.

The Board of Governors released a new financial condition index, conveniently explained in a staff paper called “A New Index to Measure U.S. Financial Conditions” last week. The new FCI quantifies how the situation in stock, bond and other markets will affect real growth. It points to conditions being very tight, despite the stock market rally this year, implying the Fed may not need to tighten policy much further even if financial markets continue to rally. The index, created by six staff economists, incorporates data including bond yields, mortgage rates, the stock market, Zillow's house price index, and the dollar's value, similar to other FCIs. The index's recent peak was in December at 0.95, suggesting financial conditions that month would be expected to subtract about a percentage point from growth this year. The index receded in the first five months of this year to 0.6 in May, still higher than in many past periods of financial stress. Evercore ISI analysts Krishna Guha and Marco Casiraghi wrote that the new index is "likely to prove one of the most market-relevant staff papers in a long time." Compared to other such indexes, it puts less emphasis on the stock market and more on market interest rates, they said. So long as rates remain high, the Fed will be "relatively tolerant" of higher stocks. We are still waiting for policymakers to officially acknowledge the new index, giving its methodology greater credibility in regard to impacting future policy decisions.

The NY Fed is releasing a new inflation measure, called the Multivariate Core Trend (MCT) inflation index, designed to dissect the buildup of inflationary pressures and analyze whether inflation is short-lived, persistent, or concentrated in particular economic sectors or broad-based. MCT inflation remained roughly stable through most of 2020 despite a visible drop in headline and core personal consumption expenditures (PCE) inflation due to the pandemic. Early in 2021 the MCT estimate started to rise, ahead of core PCE inflation, and peaked in mid-2022. Its decline since then has been more notable starting in March of this year. The NY Fed elaborates on why the MCT estimate of inflation is so different from core inflation rates in a recent Liberty Street Blog post. The difference is due to the MCT model focusing on the persistent component of month-on-month core inflation data as opposed to its twelve-month rate. “This makes it timelier since transitory shocks tend to remain in the twelve-month measure for too long. Additionally, the MCT model gives more weight to sectors that have relatively few transitory shocks (for example, housing and food services and accommodation) and less weight to sectors that have large amounts of noise (for example, motor vehicles and transportation),” the post explains. As a result, recent low inflation readings are occurring in sectors with high signal values, leading to downward revisions of their trends. In contrast, increases occurred in sectors with low signal values, leaving their signal weaker. For example, the moderation in food services and accommodation inflation weighs more heavily than the moderation in motor vehicle inflation. How housing inflation is captured is also notably different. “In the run-up, housing inflation has a larger positive contribution to the MCT estimate than to the core PCE measure; during the moderation period, it still adds positive pressure to the core PCE reading, while it contributes to the decline in the MCT measure.” We highlight this new inflation index to suggest the Fed is looking at the official CPI/PCE data differently, focusing more on where things may be going to ensure better two-sided risk management of further policy actions.

*The NY Fed’s MCT Inflation index is dropping faster than PCE due to lower weights in areas seeing larger increases
U.S. Economic Data:
Headline consumer prices rose 0.2% in June, after a 0.1% increase in May and slightly below market expectations of a 0.3% advance. This moved the annual inflation rate to 3%, the lowest since March of 2021, from 4% in May. Core consumer prices rose by 0.2% MoM after the 0.4% rise in the prior month, slightly below market expectations of a 0.3% MoM advance. As a result, the annual core consumer price inflation rate fell to 4.8% in June, the lowest since October 2021, from 5.3% in the prior month and below market expectations of 5%. Energy prices rose by 0.6% MoM, mainly due to increases in the cost of gas (1% MoM vs. -5.6% in May) and electricity (0.9% MoM vs. -1% MoM), while Food & Beverage costs increased by 0.1% MoM, verse 0.2% MoM last month. Food at home was flat on the month, while Food away from home increased by 0.4% MoM. Shelter costs, the largest contributor again, accounting for over 70% of the increase, slowed to a 0.4% MoM increase from 0.6% in May. Core goods rose by 0.1% MoM, after rising 0.6% MoM in May, largely due to a decline in used carsand trucks (-0.5% vs. 4.4% in May). Core services x-rents was flat on the month verse a 0.2% MoM increase in May, with price declines for airline fares (-8.1%) a notable driver there.
Why it Matters: The June CPI report showed a broader slowing in core inflation than expected. Further, annualized readings over the last three months (4.1%) and six months (4.6%) show progress is increasingly being made. After this report, the Cleveland Feds measures for Median and 16% Trimmed-Mean CPI increased by 0.4% MoM and 0.2% MoM, but the annual rates fell further to 6.4% (from 6.7%) and 5% (from 5.5%), respectively. The Atlanta Fed's sticky-price CPI increased 2.9% on an annualized basis in June, following a 4.1% increase in May. On a year-over-year basis, the series is up 5.8%. Sticky-price core CPI increased 2.8% (annualized) in June, and its 12-month percent change was 5.%. The flexible cut of the CPI increased 0.4% (annualized) in June and is down -2.6% on a year-over-year basis. With the Fed-funds rate (effectively 5.1%) now above the core CPI rate (and core PCE and headline CPI/PCE) for the first time since 2019, monetary policy is undoubtedly restrictive. However, the Fed obviously still sees the underlying inflation rate as too high, and we still fully expect the FOMC to hike rates by a further quarter point on July 26; however, whether the Fed hikes again later in the year is far less certain and is dependent on how labor market and inflation develop over the summer which we believe will largely be an acceleration of the current disinflationary trends.

*With more favorable comparables and dropping monthly increases, both headline and core are beginning to drop fast

*Shelter continues to be the main driver of monthly inflationary gains, with the majority of other categories falling

*Core CPI 3 and 6-month annualized changes are trending in the right direction

*Supercore had its weakest monthly change in over a year, giving the Fed some comfort

*Cleveland Fed Median and Trimmed-Mean CPI also fell, showing a broadening of the current disinflationary trend
Headline PPI rose by 0.1% in June, following an upwardly revised -0.4% fall in May, and below market forecasts of a 0.2% rise. This moved that headline annual producer price inflation rate to 0.1%, the lowest since deflation in 2020 and below forecasts of 0.4% YoY. Core producer prices also increased by 0.1% MoM, matching May's revised reading and slightly below market estimates of a 0.2% MoM rise. On an annual basis, core consumer prices are higher by 2.4%, slowing from a downwardly revised 2.6% increase in May and below market expectations of a 2.6% rise. Final demand for goods was unchanged in June following a -1.6% decline in May, with Foods falling -0.1% MoM and Energy higher by 0.7% MoM. Final Demand for Service rose by 0.2% MoM, the same as May, with Trade margins rising by a weaker 0.2% MoM and Transportation and Warehousing costs falling by -0.9% MoM, the sixth month of negative growth. Within Intermediate Demand, Processed Goods fell by -0.6% MoM, Unprocessed Goods decreased by -2.1% MoM, and Services were unchanged. A major factor in the decline in prices for processed goods was a -3.5% MoM drop in industrial chemicals, however gasoline rose by 3.4% MoM. Nearly three-quarters of the June decline in the index for unprocessed goods for intermediate demand is attributable to prices for crude petroleum, which fell -5.9% MoM. The index for services for intermediate demand was unchanged in June after rising 0.3% in May, with margins for trade services for intermediate demand falling by -0.1% MoM.
Why it Matters: The producer price index for final demand rose 0.1% MoM from a year earlier, the smallest advance since 2020. Further, June’s report showing a broadening decrease in final and intermediate goods and services prices. Trade services also grew significantly less this month, indicating business markups slowed. Core readings also fell by more than expected, with core goods having their first negative monthly print since the post-pandemic inflationary pulse. With pipeline upstream pressures subsiding, there seems to be no indication the weaker trend in PPI core inflation will change soon, although the headline PPI index remains at the mercy of energy and food price fluctuations, as seen in the rise of gasoline prices in June. Annual comparables will also get less favorable for the next two months, likely reducing YoY declines.

*Headline PPI is now effectively flat on an annual basis, with core approaching 2%

*Monthly headline and core PPI were positive, mainly due to increases in energy, while final demand for trade and other services supported core

*Final demand for core goods had its first monthly decreases since the onset of the pandemic, while continuing negative readings in transportation and warehousing show a return to normality there

*There continues to be downward pressure on prices across the various levels of the supply chain
Import prices fell by -0.2% in June, following a downwardly revised -0.4% fall in May and compared to forecasts of a -0.1% MoM decrease. Prices for “foods, feeds, and beverages” fell by -0.3% MoM, with lower costs for fish offsetting higher prices for fruit and meat. Also, the cost of industrial supplies and materials decreased by -1.1% MoM. Import fuel prices rose 0.8% MoM due to increases in the price of oil. Year-on-year, import prices were down by -6.1%, the largest drop since May 2020. Export prices fell by -0.9 in June, following a 1.9% fall in May and more than market expectations of a -0.2% decrease. Prices for agricultural exports fell by -1.6% MoM due to lower prices for soybeans, fruit, and nuts. Also, nonagricultural costs decreased by -0.9% as lower prices for industrial supplies and materials offset rises in the costs of capital goods, consumer goods, and automotive vehicles. On a yearly basis, export prices are now lower by -12%, the largest decline since the series was first published in September 1984.
Why it Matters: The trend lower in import and export prices remains well intact, with export prices now down at the highest annual rate on record. We saw oil-based fuel costs increasing on both sides of the trade balance, which was expected. Non-fuel industrial supplies fell in both imports and exports, indicating potentially reduced manufacturing activity ahead, although there was an increase in capital goods export prices. Finally, non-fuel imports declined by -0.4% MoM, after being unchanged the previous month, moving the annual change to -1.4%, with broad declines indicating reduced pricing power and/or demand for imported goods continued.

*Import prices fell due to non-fuel goods falling by -0,4% MoM, offsetting rises in energy imports

*Export prices are at their lowest annual rate on record, with four months of negative monthly declines
The NFIB Small Business Optimism Index rose to a seven-month high of 91 in June, beating market expectations of 89.9. Inflation and labor quality were tied as the top concerns, with 24% of owners reporting each as their single most important problem.
(A net) -10% of all owners reported higher nominal sales in the past three months, down two points from May. The percentage of owners expecting better business conditions over the next six months improved by 10 points to a net -40%. -14% of owners expect real sales to be higher, a rise of seven points since May. The frequency of positive profit trends was -24%, up two points from May. Among owners reporting lower profits, 28% blamed weaker sales, 24% blamed the rise in the cost of materials, and 10% cited labor costs. For owners reporting higher profits, 50% credited sales volumes.
-3% of owners reported inventory increases, with -4% of owners viewing current inventory stocks as “too low,” roughly the same as in May. -3% of owners plan inventory investment in the coming months. 14% of owners reported that supply chain disruptions still have a significant impact on their business, while another 28% reported a moderate impact.
29% of owners raised selling prices, a decrease of three points from May. Price hikes were the most frequent in retail (52% higher, 10% lower), construction (49% higher, 4% lower), finance (48% higher, 3% lower), and wholesale (47% higher, 19% lower). Seasonally adjusted, 31% of owners plan price hikes, an increase from May.
59% of owners reported hiring or trying to hire in June, down four points from May, with 42% of owners reporting having job openings that were hard to fill, down two points from May. 36% of owners reported raising compensation, down five points from May, while 22% plan to raise compensation in the next three months.
53% of owners reported capital outlays in the last six months, down four points from May. Of those making expenditures, 37% reported spending on new equipment, 21% acquired vehicles, and 14% improved or expanded facilities. 25% of owners plan capital outlays in the next few months.
27% of owners reported all credit needs met, and 60% said they were not interested in a loan. 6% reported their last loan was harder to get than in previous attempts. Only 2% of owners reported that all their borrowing needs were not satisfied.
Why it Matters: There was a notable uptick in the number of small businesses expecting better business conditions, although the reading remained historically very negative due to an improved outlook on future sales, helping move the headline index higher. However, lower future compensation and capex plans, as well as tighter inventory level intentions, show that firms continue to be uncertain about where things are heading. “Halfway through the year, small business owners remain very pessimistic about future business conditions and their sales prospects,” said NFIB Chief Economist Bill Dunkelberg. “Inflation and labor shortages continue to be great challenges for small businesses. Owners are still raising selling prices at an inflationary level to try to pass on higher inventory, labor, and energy costs.” The main takeaway is that overall small business investment will weaken. There was also a divergence between lower current asking prices verse future intentions to increase prices, muddying the inflation outlook from this report.

*The NFIB Small Business Optimism Index looks to be basing thanks to falling inflationary pressures and more stable future sales outlook

*A net 29% of small businesses reported raising prices compared to three months earlier, continuing a decline; however, a net 31% intend to raise prices over the next three months

*The inability to find qualified workers continues to be historically high but is trending towards a pre-pandemic level
The University of Michigan consumer sentiment increased to 72.6 in July, the highest level since September of 2021, and well above forecasts of 65.5, preliminary estimates showed. Both current economic conditions (77.5 vs. 69) and consumer expectations (69.4 vs. 61.5) rose. Inflation expectations increased slightly for the year ahead (3.4% vs 3.3%) and the five-year outlook (3.1% vs 3%).
Why it Matters: Consumer sentiment rose for the second straight month, higher by 13% MoM and reaching its highest headline reading since September 2021. The increase was due to the continued slowdown in inflation and labor market stability. “All components of the index improved considerably, led by a 19% surge in long-term business conditions and 16% increase in short-run business conditions. Overall, sentiment climbed for all demographic groups except for lower-income consumers.” Overall sentiment has recovered about half its losses between its 101 reading before the pandemic and its low of 50 last summer. Inflation expectations were little changed, with long-run inflation expectations staying within the narrow 2.9-3.1% range for 23 of the last 24 months.

*Current economic conditions continue to outperform future, but both were up notably in July’s preliminary reading

*Inflation expectations were little changed in July, after falling notably in June, but did lead to improved outlook

*Democrat and Independent-leaning respondents were responsible for the monthly increase in sentiment, while Republicans continue to be worried
Technicals, Positioning, and Charts:
The Nasdaq is outperforming the S&P and Russell, with Growth and Low Volatility factors, as well as Healthcare, Consumer Staples, and Consumer Discretionary sectors all outperforming on the day. Leadership at the sectorial level on the week favored Communication, Discretionary, and Tech, although all sectors were higher, with notable gains in everything outside of Energy and Staples. Growth and Small Caps were the best-performing sectors on the week, as a backup in yields and more risk-on tone helped barbell performance there.

@KoyfinCharts
S&P optionality strike levels have the Zero-Gamma Level at 4417 while the Call Wall is 4500 and Put Wall is 4200. The S&P continues to exhibit tight intraday trading ranges, and this should continue with the SPX holding the key 4,500-4,515 resistance range. We note that after yesterday's gain, the QQQ & SPX are just 5% & 10%, respectively, from their all-time highs. Index implied vols dropped hard as they continued to realize low volatility. This is not true in single stocks, where vol remains high. Eventually, this should reverse, and that likely manifests as a sharp equity decline wherein correlations snap higher. The timing of that is, of course, the million-dollar question and does not appear imminent.

@spotgamma
S&P technical levels have support at 4525, then 4495, with resistance at 4545, then 4580. An overall breakout continues but is cooling today from overbought RSI conditions. Major support is now the 4480 area, which is the major June/July resistance of the ascending triangle structure in purple (as seen in the chart). Yesterday, the S&P broke above this with force and momentum. Now bulls must defend the breakout point. Breakout is fully in play above there, with failure there requiring either more time in chop, or a deeper sell leg. The ultimate magnet for the current breakout rally is 4580. Otherwise, other critical back-test levels are 4455 and 4440, the support of the purple ascending triangle now.

@AdamMancini4
Treasuries are lower, with the 10yr yield higher by 5 bps to 3.82%, while the 5s30s curve is flatter by 6 bps on the session, moving to -11 bps.

Four Key Macro House Charts:

Growth/Value Ratio: Value is little changed on the day and the week, with Small-Cap Growth the best-performing size/factor on the week.

Chinese Iron Ore Future Price: Iron Ore futures are higher on the day and the week.

5yr-30yr Treasury Spread: The curve is flatter on the day but notably steeper on the week.

EUR/JPY FX Cross: The Euro was stronger on the day and on the week.
Other Charts:

With the current rally primarily driven by multiple expansions instead of earnings growth, stocks are again becoming more expensive.

Retail investors have been aggressively buying stocks and ETFs.

Market breadth continues to improve, with the NYSE new highs-new lows index making a year-to-date high.
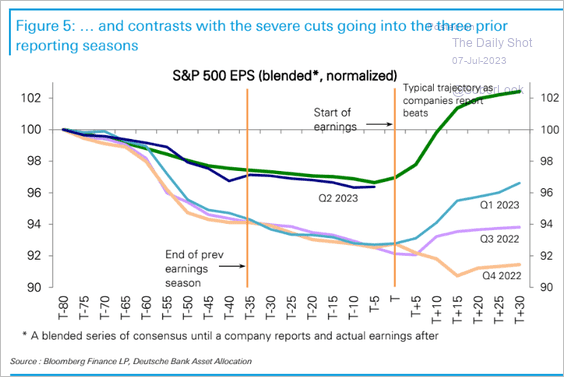
Q2 earnings downgrades have been following a typical trajectory, with energy and financials leading the downgrades currently.

Wage growth among low-wage workers is falling the fastest, and this is also reflected in lower-income consumer sentiment, which was the weakest contributor in July’s Univ. of Michigan report.

Almost 27 million borrowers, who have a total of $1.1 trillion in student loans in forbearance, will need to resume servicing them starting on Oct. 1. Analysts at Wall Street banks project the restart will further crimp consumer spending.

US banks continue to tighten lending standards, especially for commercial real estate loans. However, delinquency rates remain low given refinancing needs have yet to hit as most firms locked in “lower for longer” during the pandemic’s low rate period.

Wholesale used vehicle prices fell 4.2% in June, the largest monthly drop since the pandemic hit. Prices fell 10.3% on an annual basis, according to the data, from the Manheim Used Vehicle Value Index, which tracks wholesale prices of used cars sold at auction and typically predicts prices that shoppers see on auto lots a few months later.
Articles by Macro Themes:
Medium-term Themes:
Labor Markets Loosening?:
Not Loosening: About 51K jobs were slashed worldwide in June, the lowest number since December, according to a Bloomberg analysis of job-cut announcements across almost 1,300 companies. Last month’s tally, which dropped 25% from May, marked the fourth decline in five months. Companies also appear to be downsizing less aggressively. The median size of layoffs in the second quarter was about 8% of a company’s total workforce, down from roughly 10% in the previous two periods. “Inevitably, when the labor market cooled from where we were a year ago, we were going to see an increase in layoffs,” said Andrew Challenger, senior vice president of staffing firm Challenger, Gray & Christmas Inc. “The real question is, is it going to go further than that in terms of a real recession.” - Global Layoffs Slow in Sign Cooling Economy Won’t Mean Recession - Bloomberg

China’s Post-Pandemic Life:
Coming Clean: Chinese authorities are weighing plans to support cash-strapped cities and counties by allowing additional local bond issuance to help pay down hidden debt in higher-risk areas. Utilizing more than 1 trillion yuan ($138 billion) of such quotas has been proposed. That would come on top of total local bond quotas of 4.52 trillion yuan set earlier this year for 2023. Economic woes are adding to concern over some $9 trillion of debt at local-government financing vehicles, entities controlled by authorities but not officially part of the government. LGFVs were set up to fund projects in cities and counties like roads, airports and power infrastructure, and their debt doesn’t appear on official balance sheets. Authorities have begun a fresh round of nationwide inspections to press local officials to come clean about these kinds of so-called hidden debts. - China Weighs More Local Bond Sales to Help Pay Risky Hidden Debt - Bloomberg

Cooling Quick: The Chinese consumer price index was flat year on year after declining by -0.2% MoM in June, while factory gate prices fell at the fastest pace since 2016 as demand for consumer and manufactured products softened. The producer price index declined by -5.4% compared with the same period a year ago, accelerating from a drop of -4.6% in May and faster than the -5%. forecast by analysts polled by Reuters. Analysts expected the figures to lead China’s central bank, the People’s Bank of China, to reduce interest rates again, adding to a round of cuts last month that many believe Beijing will have to supplement with fiscal stimulus policies. - China on brink of consumer deflation - FT

Trade Still Falling: Chinese exports fell at their steepest annual pace in June since the early days of the pandemic in February 2020. China isn’t the only Asian export powerhouse reporting sinking overseas sales. Exports from Taiwan fell 23% in June compared with a year earlier, while Vietnamese exports were down 11%. Exports from South Korea were down 6%, according to official figures compiled by data provider CEIC. Global trade has been softening for months as Western consumers quit spending so much on electronics, home improvements and other consumer goods after splurging during the pandemic. - China’s Drop in Exports Signals Deepening Slowdown in Global Trade - WSJ

Longer-term Themes:
Cyber Life and Digital Rights:
Digital Authoritarianism: To aid an internal crackdown, Russian authorities had amassed an arsenal of technologies to track the online lives of citizens. After it invaded Ukraine, its demand grew for more surveillance tools. That helped stoke a cottage industry of tech contractors, which built products that have become a powerful and novel means of digital surveillance. The technologies have given the Russian authorities access to a buffet of snooping capabilities focused on the day-to-day use of phones and websites. The tools offer ways to track certain kinds of activity on encrypted apps like WhatsApp and Signal, monitor the locations of phones, identify anonymous social media users and break into people’s accounts. Simple-to-use software that plugs directly into the telecommunications infrastructure now provides a Swiss-army knife of spying possibilities. Russian companies that developed these tools are now trying to sell them to overseas buyers. - Cracking Down on Dissent, Russia Seeds a Surveillance Supply Chain - NYT

Retrieving Data: The E.U.-U.S. Data Privacy Framework, which ensures that data from Meta, Google and scores of other companies can continue flowing between the United States and the European Union was completed. The accord gives Europeans the ability to object when they believe their personal information has been collected improperly by American intelligence agencies. An independent review body made up of American judges, called the Data Protection Review Court, will be created to hear such appeals. The trans-Atlantic agreement was a top priority for the world’s biggest technology companies and thousands of other multinational businesses that rely on the free flow of data. The deal replaces an accord known as Privacy Shield, which the European Union’s highest court invalidated in 2020 because it did not include enough privacy protections. - U.S. and E.U. Complete Long-Awaited Deal on Sharing Data - NYT

Internet Evolution: It’s the end of a social era on the web and that’s probably a good thing. Why is this happening right now? Access to nearly unlimited and nearly free money is ending, and inverstors want real returns now with few social networking companies ever making real money, and so they’re scrambling for new features and pivoting to whatever smells like quarterly results. The rise of AI is also sending companies into a tizzy. Large language models from companies like OpenAI and Google are built on top of data collected from the open web. Suddenly, having all your users and content publicly available and easily found has gone from a growth hack to capitalistic suicide. Add it all up, and the social web is changing in three crucial ways: It’s going from public to private; it’s shifting from growth and engagement, which broadly involves building good products that people like, to increasing revenue no matter the tradeoff; and it’s turning into an entertainment business. - So where are we all supposed to go now? – The Verge

Energy’s Midlife Crisis:
30X by ’27: China’s early move to tap new centers of lithium supply across Africa is reaping rewards, helping the top electric-vehicle battery producer navigate a tight market for the key metal. Spurred by a flurry of investment from Chinese companies, mines across the continent are forecast to increase production of lithium raw materials more than 30-fold from last year’s volume by 2027. Africa will account for 12% of global supply by then, compared with 1% in 2022. Diversifying supply sources will boost China’s efforts to defend its dominance in EV metals processing, transforming raw materials like lithium, nickel and cobalt into chemicals used in battery components, while the US ratchets up efforts to build out its own supply networks with free-trade partners and allies like Canada and Australia. - China Jumps Ahead in the Rush to Secure Lithium From Africa - Bloomberg

Bombshell: The clean energy subsidies from Biden’s climate agenda have just prompted one Norwegian manufacturer to choose Michigan, not Europe, as the site of a nearly $500 million factory that will produce the equipment needed to extract hydrogen from water. And other European-based companies are being tempted to follow suit, people involved in the continent’s hydrogen efforts say making the universe’s most abundant substance the latest focus of the transatlantic trade battle on green energy. “If you take the IRA and the CHIPS Act together, we’re talking about more than $400 billion,” Volldal said. “On top of that, you have subsidies for renewable power and so on. Europe is dwarfed by the numbers we see in the U.S.” The global hydrogen industry was valued at more than $155 billion last year, and the EU plans to produce and import a total of 20 million tons of renewable hydrogen a year by 2030, however that target may be in trouble if producer go elsewhere. - Biden’s hydrogen bombshell leaves Europe in the dust - Politco

Food: Security, Innovations, and Climate Change Implications:
Double Whammy: A drought has spanned the wheat fields of the Great Plains and the Corn Belt in the Upper Midwest, leaving some areas with fractions of their normal rainfall as they head into crucial growing periods for corn and soybeans. The fear is a repeat of a drought-stricken 2012 that sent crop prices surging. “The next three to four weeks are going to be huge,” said Angie Setzer, co-founder of Consus, which advises farmers on how to sell crops and minimize financial risk. U.S. food inflation had eased in recent months as crop prices fell. Then in early June, fears of drought-stunted crops and abandoned fields started driving up prices. Scattered rainfall in recent days raised hopes that harvests in certain areas will be salvaged, moderating price bumps. - U.S. Drought Threatens to Prop Up Food Inflation – WSJ

iFarmer: Until recently, agriculture had been slow to adopt robots. High levels of capital investment and limited seasonal deployment made it hard for the machines to generate value. “It has not been a cracking investment theme until now,” says Adam Anders, managing partner at Anterra Capital, a food and agriculture venture capital firm. But that is changing, he says. In mature economies, restrictions on migrant labour, ageing agricultural workers, and a lack of enthusiasm for back-breaking work that is dull and dirty mean farm workers cost more and are harder to find. In the US, for example, farm workers’ inflation-adjusted hourly wage rose by 28% between 2000 and 2022, compared with 17% for non-farm workers, according to the US Department of Agriculture. Because technologies such as computer vision and machine learning enable robots to identify and respond appropriately to objects, some machines can now weed or pick fruit and vegetables with a speed, accuracy and reliability that was once achievable only by humans. - Farm robots poised for growth as labour costs rise - FT

Authoritarianism in Trouble?:
Hunting Abroad: After crushing dissent at home, Hong Kong is turning its focus to activists who have continued their resistance to the Beijing-led crackdown from overseas. Earlier this month, the Hong Kong government offered big rewards for information on eight of its most-wanted dissidents-in-exile. Hong Kong leader John Lee said the fugitives were “street rats” who would be hunted all their lives and were to be avoided at all costs. Days later, family members of a former opposition lawmaker who lives in the U.K. were detained for questioning. Authoritarian governments, including China, often lean on family members to silence their critics overseas, activists say. Hong Kong has moved aggressively to quell dissent in the city since Beijing imposed a national security law in 2020, but it hadn’t until recently put much public pressure on dissidents who had fled abroad. - Hong Kong Takes Its Crackdown Abroad – WSJ

Other Articles of Interest:
Catch Up: Ever since the Biden administration passed the Inflation Reduction Act and the Chips and Science Act for clean energy and tech last year, there has been a mutinous mood among some American allies in both Europe and Asia at the scale of the new US subsidies. What the US sees as a strategy to reverse deindustrialisation in deprived areas, allies have interpreted as a thinly veiled exercise in protectionism because it encourages companies to shift plants and customers to Buy American. Yet as the dust has settled in recent months, the reaction has shifted from anger to a search for ways to catch up. The EU, Japan and South Korea have all introduced subsidies for their tech and clean energy sectors, in order to attract new investment or prevent more companies from shifting to the US. - A global subsidy war? Keeping up with the Americans - FT

Back to Normal: Recent trade data shows that supply shocks rattling the global economy for three years has subsided, boosting expectations for cooler inflation in the months ahead. The improvement in global supply chains is “resonating through almost every indicator,” HSBC said in a research note earlier this week. Delivery times are falling, port congestion is close to normal, product shortages are receding and global inventory levels are rebalancing. “Over the course of the past year, but in particular in 2023, global supply chains have eased remarkably quickly — removing one of the biggest headaches in terms of activity and inflation,” the London-based bank said, while noting that the trend is largely the result of subdued global demand for goods. - Global Supply Chains Are Almost Back to Normal - Bloomberg

VIEWS EXPRESSED IN "CONTENT" ON THIS WEBSITE OR POSTED IN SOCIAL MEDIA AND OTHER PLATFORMS (COLLECTIVELY, "CONTENT DISTRIBUTION OUTLETS") ARE MY OWN. THE POSTS ARE NOT DIRECTED TO ANY INVESTORS OR POTENTIAL INVESTORS, AND DO NOT CONSTITUTE AN OFFER TO SELL -- OR A SOLICITATION OF AN OFFER TO BUY -- ANY SECURITIES, AND MAY NOT BE USED OR RELIED UPON IN EVALUATING THE MERITS OF ANY INVESTMENT.
THE CONTENT SHOULD NOT BE CONSTRUED AS OR RELIED UPON IN ANY MANNER AS INVESTMENT, LEGAL, TAX, OR OTHER ADVICE. YOU SHOULD CONSULT YOUR OWN ADVISERS AS TO LEGAL, BUSINESS, TAX, AND OTHER RELATED MATTERS CONCERNING ANY INVESTMENT. ANY PROJECTIONS, ESTIMATES, FORECASTS, TARGETS, PROSPECTS AND/OR OPINIONS EXPRESSED IN THESE MATERIALS ARE SUBJECT TO CHANGE WITHOUT NOTICE AND MAY DIFFER OR BE CONTRARY TO OPINIONS EXPRESSED BY OTHERS. ANY CHARTS PROVIDED HERE ARE FOR INFORMATIONAL PURPOSES ONLY, AND SHOULD NOT BE RELIED UPON WHEN MAKING ANY INVESTMENT DECISION. CERTAIN INFORMATION CONTAINED IN HERE HAS BEEN OBTAINED FROM THIRD-PARTY SOURCES. WHILE TAKEN FROM SOURCES BELIEVED TO BE RELIABLE, I HAVE NOT INDEPENDENTLY VERIFIED SUCH INFORMATION AND MAKES NO REPRESENTATIONS ABOUT THE ENDURING ACCURACY OF THE INFORMATION