


Technicals > Fundamentals as Large-Cap Growth Outperforms and Bullish Animal Spirits Awaken Further - MIDDAY MACRO WEEKEND READ– 1/27/2023
Color on Markets, Economy, Policy, and Geopolitics

MIDDAY MACRO WEEKEND READ – 1/27/2023
Overnight and Morning Recap / Market Wrap:
Price Action and Headlines:
Equities are higher, with the S&P currently trying to break above 4100, as somber earnings/forecasts and weaker data throughout the week failed to quell a more technically bullish picture
Treasuries are lower, but only slightly on the session and little changed on the week, with strong auction demand capping yields from rising too much due to the more risk-on tone
WTI is lower, although mainly range bound on the week as supply and demand views fluctuate due to increased demand forecasts from the IEA and uncertainties over China’s reopening and Russia’s production/supply capabilities

Narrative Analysis:
The week is again ending on a more positive note, with large-cap growth and tech/consumer discretionaries outperforming. The earnings season has been bifurcated in results, with companies looking to be using the growing uncertainty over future growth as an excuse to guide defensively, although most are facing hits to top and bottom line growth, leading to more layoff announcements. As a result, single-name stock volatility has been high post-earnings, while index-level implied volatility has fallen, with the VIX now at an 18 handle. Technicals and positioning have certainly become more positive, but fundamentals remain uncertain at best. This week’s GDP print, although higher than expected at the headline level, was much weaker underneath and showed a significant loss of momentum in purchasing activity in Q4. Data elsewhere was more mixed, with manufacturing activity/surveys cooling further, while housing activity looked to have somewhat stabilized. Inflation expectations fell further, and when coupled with the BoC announcing it was done hiking earlier in the week, gave markets hope the Fed would also be pausing soon. Treasuries continued to see strong foreign demand at auctions, and as a result, the 10yr yield continued to gravitate around 3.5%, although market-derived inflation measures elsewhere picked up. Oil continues to benefit from the more risk-on tone but cooled today, with WTI trading in a $3 range for most of the week. Copper also cooled on the day, with bullishness around China’s reopening calming somewhat but is still trending higher. The agg complex was higher on the week despite better weather in South America. Finally, the dollar was little changed on the week, with the $DXY at 102, consolidating after recent weakness.
The Nasdaq is outperforming the S&P and Russell with Growth, Small-Cap, and Value factors, as well as Cons. Discretionary, Real Estate, and Communications sectors are all outperforming on the day. The week had a clear tilt and favored growth and consumer discretionary and tech, although almost every sector was higher on the week outside healthcare and utilities.

@KoyfinCharts
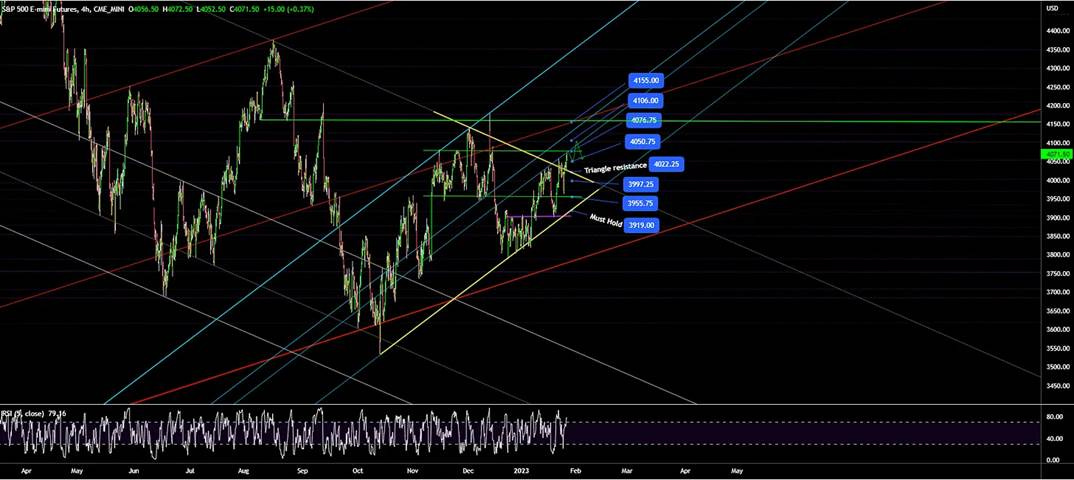
S&P optionality strike levels have the Zero-Gamma Level at 4021 while the Call Wall is 4100 and Put Wall is 3900. After the big January monthly options expiration, the key levels rolled up, and this was bullish. An increased level of traders’ desire to own call options over very short time frames is resulting in dealers buying underlying stock and futures, and this is what is helping the S&P rise. The other overarching theme here is the lack of downside protection demand and a slide lower in implied volatility. This leaves the market poorly positioned for a hawkish FOMC meeting result next week.

@spotgamma
S&P technical levels have support at 4080, then 4050, with resistance at 4000-10 (major), then 4130. Despite all the volatility, the S&P has now broken its core downtrend line from 2022, and in addition, has closed five full days above its 200-day moving average for the 1st time since the bear market started. The resistance line is currently at 4025-20, and should now act as support. Despite the bullish developments, we remain in a massive nine-month sideways range, currently at the same prices as in May. The S&P is still under December highs and, as a result, simply in a consolidating market, not a bull or a bear market.
@AdamMancini4
Treasuries are lower, with the 10yr yield at 3.51%, higher by 1 bps on the session, while the 5s30s curve is flatter by 3 bps, moving to 1 bps.

Deeper Dive:
With markets ending the week on a more positive note, technicals continue to outweigh cooling economic data and weaker 2023 earnings guidance, allowing the January rally to continue. In general, recessionary fears fell on the week, as price action would indicate, but the picture continues to be mixed and constantly evolving. Blockbuster Treasury auctions, driven by foreign buyers, helped move rate volatility to the bottom of its recent range, allowing a cooling of volatility across assets more generally, despite yields ticking higher into the end of the week. Falling volatility levels have allowed greater participation from systematic strategies, which are more volatility sensitive, as well as discretionary managers, who are chasing the current risk-on price action. This was best seen by the increasing breadth of stocks regaining 200 or 50 DMAs, as well as surveys indicating a more bullish sentiment and perhaps even growing levels of FOMO. However, as the growth outlook has improved, market-derived future inflation measures have risen, with 2-yr B/E’s up 20bps this week while Bloomberg’s commodity index was also higher (although down today). These increases contrast with further declines in consumer inflation expectations, as well as a growing indication that labor market tightness has peaked, reducing future wage pressures. The rise in market-implied inflation readings will cause some discussion at next week’s FOMC meeting. However, despite this development, rising gasoline prices, and a more stable housing market outlook, the Fed will signal they are increasingly comfortable with where policy is, even if headline inflationary pressures are expected to rise in the medium term, given where they believe the core reading is going. Last week, Fed speakers made this clear, with both Brainard and Waller laying out reasons for a more two-sided risk approach and a further desire to be “marked-to-market” with incoming data regarding policy decisions. Brainard’s belief that core-service inflation lags/follows core-goods inflation, if shared by others, significantly reduces worries that Fed thinks inflation is sticky and requires a “higher for longer” approach. As a result, we will use today’s “Deeper Dive” to review the week’s price action in equities and rates while summarizing recent economic data and policy developments in Canada, concluding with our tactical outlook and portfolio review.
Despite the continued day-to-day “tug of war” price action in what often seems like poor liquidity, the S&P has managed to move/stay above both its 200 DMA and 2022 downtrend channel for multiple sessions, both of which presented enough resistance to end several bear-market rallies last year. Weaker-than-expected forward guidance by Microsoft earlier in the week, as well as a generally uninspiring earnings season so far, have failed to reverse the more positive momentum, and a Golden Cross (50 DMA > 200 DMA) is now forming. RSI’s indicate overbought conditions for various time frames, but overall, technicals look more bullish. Optionality has also become more supportive, with growing levels of positive gamma causing dealers to hedge/buy. There is also a notable decrease in downside demand for protection and a slide lower in implied volatility more generally because of that. As a result, the market could be caught offside if next week’s FOMC message is overly hawkish. However, putting it all together and both the technicals and positioning in the market, either through cash or options, has become more positive despite fundamentals continuing to be highly questionable/debatable.
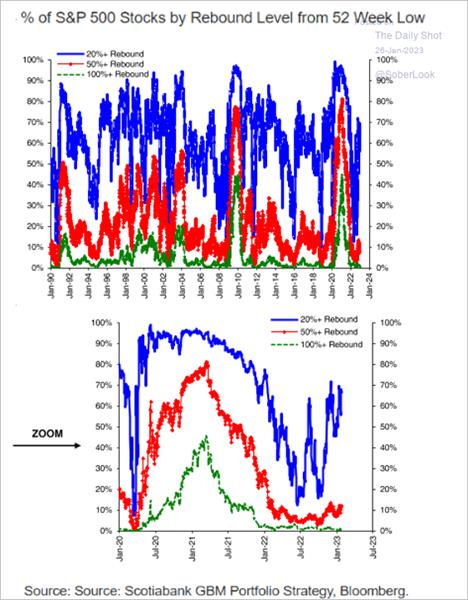
*The current rally has been broad in breadth, with almost 70% of stocks rebounding 20% off their 52-week lows

*Investment managers are increasing exposure, as seen in the NAAIM Exposure Index

*Put skew is still elevated, especially for certain sectors, but demand for downside protection has fallen
Treasuries are having a somewhat epic start to the year regarding the strength of auctions, including TIPs. Strong indirect bids from foreign buyers have the majority of results come through when issued levels. This strong demand is less reflective of a demand for safe-haven assets and more of a yield/duration grab due to beliefs that the Fed will not be able to maintain rates at its terminal level for long. This was evident in this week’s five-year auction, which had a bid-to-cover at 2.64, the highest level since August 2020, and showing the belly of the curve may be offering the greatest value. Interestingly, for two-year yields to be at fair value, the Fed would need to cut rates significantly more than they are signaling in 2024. One wonders if the rampant demand for Treasuries at auction this month may have something to do with a perceived cutback in supply as debt-ceiling brinksmanship escalates. Regardless, the fact is that the strong demand for paper has capped nominal yields, led the MOVE index to fall to the bottom of its recent range, and supported risk sentiment/assets.
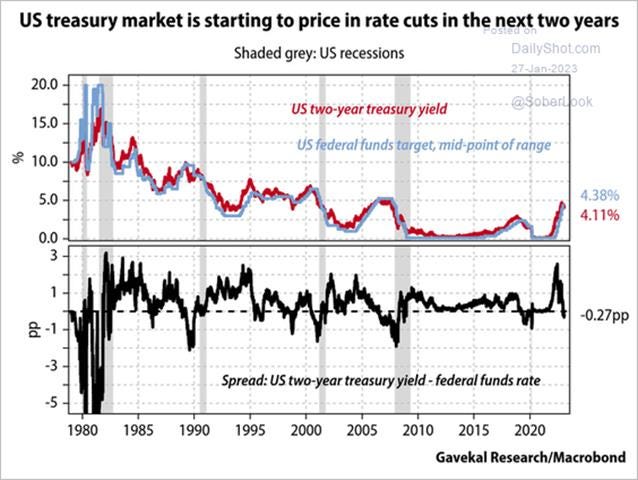
*Two-year Treasuries are expensive if you believe the Fed SEPs, but the market continues to price an increasing amount of cuts as current growth slows

*The MOVE Index, or rate volatility, has been a strong driver of the VIX and FX vol, and as it falls, so does volatility more generally

*Nominal yields and real rates picked up towards the end of this week but remain on a downward trajectory on a longer-term basis
It’s worth quickly highlighting this week’s Bank of Canada policy decision/results, who signaled they are done raising rates after reaching a 4.5% terminal rate level. The BoC highlighted that there is growing evidence that restrictive monetary policy is slowing activity, especially around household spending. Their statement noted short-term inflation expectations remain elevated while official measures of inflation were still around 5%, but 3-month measures of core inflation are falling, leading them to believe core has peaked. "If economic developments evolve broadly in line with the MPR outlook, Governing Council expects to hold the policy rate at its current level while it assesses the impact of the cumulative interest rate increases,” BoC Governor Tiff Macklem said in prepared remarks. The BoC was the first major central bank to pause tightening and assess the impact of existing policy. It also gives us further confidence that the Fed will not be far behind and, given where we stand on the data front, will likely only raise rates 50bps more in the two upcoming meetings. However, with financial conditions easing, lending/borrowing activity still strong, and labor markets still historically tight, the policy path forward is far from certain. Please take a look at this week’s policy section for further thoughts on the Fed.

*Markets are increasingly discounting the duration central banks can stay in the restrictive territory now that the tightening phase of the cycle is ending

“Despite the Fed’s efforts, financial conditions continue to loosen and loan demand continues to grow despite elevated yields.” - JPM desk

*However, despite loosening financial conditions and loan growth, real Fed funds are positive…

*…and with QT removing various levels of excess reserves from the system month to month, the effective Fed funds rate is significantly higher
The economic data on the week provided a more negative picture of the economy. The first take on Q4 ’22 GDP indicated a growing deceleration in final sales to domestic purchasers despite a headline beat due to increases in inventories and the balance of trade. This slowing, along with weaker new orders for core/capital durable goods and contracting regional manufacturing activity, supported the idea that the Fed will ease policy sooner than they forecast. Labor market-related data also cooled, seen in a reduction in temporary workers, shorter work weeks, and growing levels of continued claims. When combined with the daily deluge of layoff announcements, it is clear that labor market tightness is reversing in certain parts of the economy. Next week’s ECI and JOLTs data will further shed light on this, with our expectations for reduced wage pressures to continue while the start of a new year causes many openings to close. Turnover measures should also increasingly fall as the economic outlook becomes increasingly uncertain. However, given the increase in consumer confidence seen in today's University of Michigan survey, we are far from panic mode, which allows for the “goldilocks” soft-landing scenario to stay alive as inflationary pressures cool, growth falls below trend, but labor markets remain strong enough to support consumer confidence/activity and aggregate demand more generally from drastically falling.

*The breadth of layoffs is growing and no longer concentrated in certain industries, but labor markets still remain historically healthy on aggregate
*The level of savings, growing use of credit, a rising level of delinquencies (especially in auto), and worries over the labor market raise many questions about the strength of the consumer moving forward, but household balance sheets still seem “resilient”

*Debt service ratios are approaching pre-pandemic levels while saving rates rose in December as the consumer becomes more leveraged and defensive
In conclusion, we continue to believe that U.S. equities have bottomed, and the dollar and rates have peaked. The Fed is close to moving on to the next phase of the cycle, and the incoming data will allow this to occur shortly. But the Fed still has a very tough communication challenge as the end of the cycle nears. With core inflation increasingly trending back to target, something we believe will be helped by the medium-term firming of headline inflation (due to increases in energy and food costs) pulling further spending away from services, helping the core inflation rate fall faster. This, combined with falling shelter prices increasingly being picked up (due to lag) in the official data, will allow the Fed to declare mission accomplished in regards to reaching an appropriate restrictive level and further move to a more two-sided risk approach to future policy actions. As a result, the debate will continue to move to how shallow the now-upon-us slowdown will be and what that means for earning and multiples, as well as other risk-asset pricing. We still believe that a soft landing is likely due to historically solid consumer and business balance sheets. Yes, capacity will fall, and yes, leverage will rise, both weighing on demand, but the starting point is still strong enough to allow for a period of below-trend growth but not an overly contractive level of activity to cause a definitive move lower in risk-assets. Finally, due to this belief, we continue to hold our portfolio where it is, with stops moved higher but targets still 5% to 10% higher, depending on the position. With technicals and positioning now more supportive, we believe markets will look through the current slowdown for some time longer, instead focusing on the changing Fed policy backdrop, until there is more conclusive evidence of how impactful/detrimental existing policy has been on economic momentum. Finally, as a tactical last thought, it is possible Powell will deliver one last hawkish message next week, and equities are now poorly positioned for that. As a result, we still advocate not chasing this rally despite the more positive technicals and entering any new long positions after the FOMC meeting.

*Money growth has become negative, and this correlates strongly with deflation, but given the level it reached and a more complicated liquidity backdrop, it is unclear what the lag effect will be

*With the debt-ceiling being reached, liquidity will increase as the TGA is drawn down despite QT, but the uncertainty of the debate should weigh on sentiment as we get into the summer months
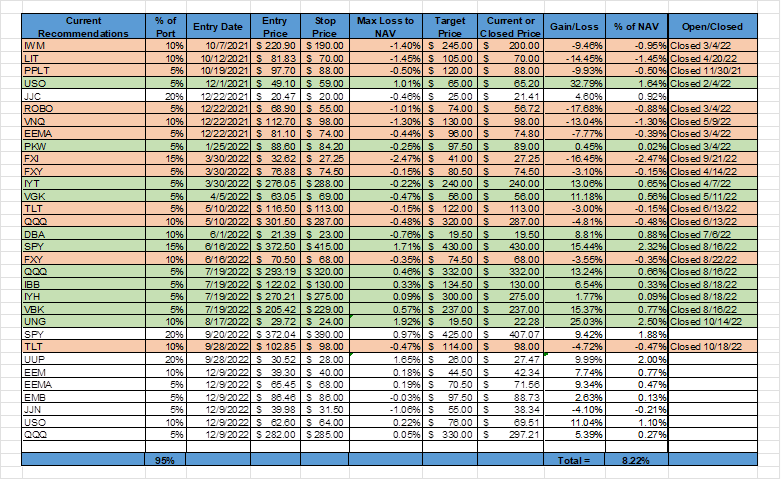
*The mock portfolio is up 8.2% since inception, with our long nickel position being the only position down. Stops were tightened to protect gains.
Econ Data:
The U.S. economy expanded at an annualized 2.9% rate in Q4 2022, following a 3.2% increase in Q3 and beating forecasts of 2.6%. Consumer spending rose 2.1%, below 2.3% in Q3, and forecasts of a 2.5% increase. Spending on goods rose by 1.1%, led by motor vehicles, while spending on services slowed to 2.6% from 3.7%. Inventories added 1.46% points after a drop in the previous two quarters. On the other hand, while still positive, the contribution from net trade declined to 0.56% points from 2.86% points in Q3, as exports of goods fell by -1.3%, led by nondurable goods; however, there was a notable uptick in service exports (12.4% vs. 7.5%). Business fixed investment increased by 0.7%, falling from 6.2% in Q3, led by weakness in equipment investment (-3.7% vs. 10.6% Q3). Residential investment continued to contract heavily (-26.7% vs. -27.1% Q3). Full-year 2022 GDP growth expanded at 2.1%. The headline GDP deflator fell to 3.5% from 4.4%, while the core deflator was 3.9%, down from 4.7%.
Why it Matters: The belly of this report was much weaker than the headline beat/strength would indicate. A core measure of activity, as seen in real final sales to private domestic purchasers, rose by only 0.2% QoQ, the weakest level of expansion since Q3 2020. Instead, half of the headline gain came from the inventory build over the quarter, and a large chunk of the rest of the increase came from the narrowing of the trade gap. As a result, and when considering the weaker data seen in December elsewhere, the economy ended the year on a much weaker note. Furthermore, inventories are unlikely to be a large contributor to Q1 again. This suggests that the below period of growth which the Fed needs to give it confidence that supply and demand are moving more back into balance, and hence inflation will trend back towards target, is likely occurring right now. Increases in prices cooled but were still high, with the price index for GDP increasing 3.5% at an annual rate and core PCE prices increasing 3.9%. For 2022 as a whole, overall PCE prices rose by 5.5%, and the average inflation rate over the last five years was 3.1% compared to the Fed’s target of 2%.

*Declines in fixed investment negated most of the positive growth in personal consumption, resulting in flat final sales to domestic purchasers

*Momentum is certainly slowing, as now not only is the residential side of investment becoming a drag on growth

*Economy continues to run above trend, something the Fed is trying to change
The PCE Price Index rose by 0.1% in December, the same as in the previous month. Year-on-year, the PCE Price Index rose by 5%, the least since September 2021. Core PCE increased by 0.3% in December, compared to 0.2% in November and in line with market estimates. The annual rate fell to 4.4% from 4.7% in November, marking the slowest increase in 14 months. Services prices increased by 0.5% (vs. 0.3% in November), while those for goods declined again by -0.7% (vs. -0.4%). Food prices increased by 0.2% (vs. 0.3%). Personal income rose by 0.2% in December, following a downwardly revised 0.3% increase in November and in line with market expectations. It was the smallest gain since April. The increase primarily reflected increases in compensation (0.3%) and proprietors' income (0.2%), with the increase in compensation reflecting increases in both services and goods-producing industries. Personal spending dropped by -0.2% in December, worse than market forecasts of a 0.1% fall and following a revised -0.1% decline in November. Spending fell for both goods, namely gasoline, motor vehicles, housing, air transportation, and health care. Adjusted for inflation, personal spending dropped by -0.3%, with consumption of goods falling by -0.9% while spending on services was flat. The personal saving rate rose to 3.4% from 2.9%.
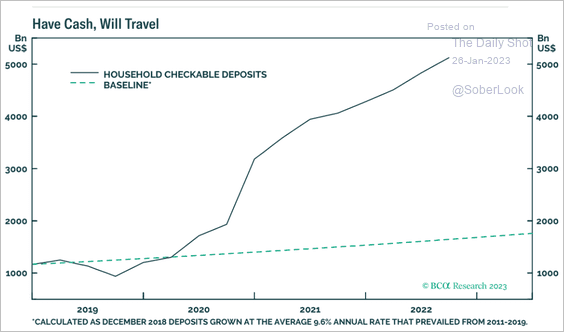
Why it Matters: PCE and CPI have been mainly coming in line with each other despite some differences in the calculation, so this part of the report did not elicit any new information. However, personal income and spending data showed spending momentum slowed at the end of 2022, not because of weak income growth (real disposable income grew at a strong 4.0% rate through the fourth quarter) but because households, which have burned through much of their excess savings accumulated during the pandemic, are now again growing their savings rate which has risen for three straight months. Despite rising, the current 3.4% savings rate is well below levels that prevailed prior to the pandemic (the savings rate averaged 7.9% in 2017-19).

*Goods increased the negative contribution they had to overall PCE in December while service inflation held steady

*Annualized rate over three months is falling fast, while regular annual comparisons will get harder in Q1

*Real disposable incomes should continue to improve as inflation falls and labor markets remain historically tight

*The drawdown in savings is unsustainable and should correct increasingly into the end of 2023
Orders for durable goods rose by 5.6% in December. It was the sharpest gain since July 2020 and well above market forecasts of a 2.5% increase. Up four of the last five months, transportation equipment drove the increase, rising by 16.7% MoM (aircraft rose 88.6%). Excluding transportation, new orders decreased by -0.1% MoM. Excluding defense, new orders increased by 6.3% MoM. Meanwhile, orders for non-defense capital goods, excluding aircraft, a closely watched proxy for business spending plans, fell by -0.2% in December, in line with market expectations. Overall shipments rose 0.5% in December from 0.4% in November, while backlogs increased 1.3% from flat. Inventories increased on the month to 0.7% from 0.2%, moving the inventory to shipment ratio to 1.78.
Why it Matters: The better-than-expected rise in durable goods orders was entirely due to the massive swing higher in new orders for aircraft, which is a volatile series. Durable goods orders, excluding defense and aircraft, grew in nominal terms at a mere 1.1% during the last three months of 2022, and core capital goods orders advanced only 0.3% on the same basis. Core capital goods shipments have fallen now in November and December, and today’s GDP report, which incorporates this data, shows a -3.7% annualized contraction in the rate of real business equipment spending.

*Orders of non-defense capital goods, excluding aircraft, slipped -0.2% in December, while shipments of these core capital goods fell by -0.4% in the month

*New orders and shipments of capital goods are now down for two months in a row
The University of Michigan consumer sentiment increased to 64.9 in January, the highest since April, from a preliminary of 64.6. The gauge for expectations was revised higher to 62.7 from 62, while the current conditions subindex was revised lower to 68.4 from 68.6. One year ahead, inflation expectations fell to 3.9% from 4% in the preliminary estimate, and the 5-year outlook was revised lower to 2.9% from 3%.
Why it Matters: While the short-run economic outlook was little changed from last month, all other components of the index increased in January. The current conditions index soared 15% above December, with improving assessments of both personal finances and buying conditions for durables, supported by strong incomes and easing price pressures. Despite the recent improvement, Two-thirds of consumers expect an economic downturn during the next year. Notably, the debt ceiling debate looms ahead and could reverse the gains seen over the last several months; past debt ceiling crises in 2011 and 2013 prompted steep declines in consumer confidence. Year-ahead inflation expectations receded for the fourth straight month, and the current reading is the lowest since April 2021 but remains well above the 2.3-3.0% range seen prior to the pandemic. Consumers continued to exhibit considerable uncertainty over both long and short-term inflation expectations, indicating the tentative nature of any declines.

*Consumer sentiment continues to rebound, although headwinds are growing, given higher gas prices and the coming debt-ceiling showdown

*Declines in inflation expectations a year ahead have accelerated, but uncertainty remains high
The Richmond Fed’s Manufacturing Activity Index decreased to -11 in January from 1 in December, the lowest since May 2020 and below market expectations of -5. Demand measures drove the headline index lower, with New Orders (-24 vs. -4 in Dec), Backlog of Orders (-31 vs. -23), as well as actual Shipments (-2 vs. 5) moving (further) into contractionary territory. Capacity Utilization (-7 vs. -10) and Lead Times (-13 vs. -25) improved but remained in contractionary territory. Inventory readings remained positive, improving for Finished Goods (14 vs. 2) notably, while Raw Materials (21 vs. 24) remained in strong expansionary territory. Investment readings, seen in Capex (-1 vs. 10), Equipment and Software Spending (9 vs. 15), and Service Expenditures (-10 vs. -11), cooled on aggregate. Employment readings also cooled, with the Number of Employees (-3 vs. 3) and Availability (-8 vs. -5) contracting further while Wages (41 vs. 37) rose. Price trends fell further, with Prices Paid (7.91 vs. 9.08) falling the most compared to Prices Received (6.52 vs. 7.63). Future expectation readings were more mixed, with demand-related sub-indexes more stable while employment and inventory readings rose. Price expectations fell further.
Why it Matters: Things slowed in the Richmond district as the three main sub-index components (shipments, new orders, and employment) all declined in January. Firms continue to cut capacity, reducing supply-side price pressures, although wages did rise despite the availability of skilled labor contracting further (which reads less need for it). There was also a significant decline in both current and future investment readings, which does not bode well for business confidence. However, as is now a reoccurring theme, businesses signaled some confidence by increasing their expected future labor and inventory levels. Finally, further declines in both current and expected prices paid and received bode well that both PPI and CPI will continue to trend lower. There was an uptick in price readings in some regional Fed surveys in December, and with gasoline/diesel prices rising in January, it will be interesting to see if this trend picks up in pace or slows over Q1.

*After rebounding back to a neutral reading in December, The headline business activity index fell to its lowest level since the beginning of the pandemic due to notable drops in demand, but also employment and shipment readings

*Current employment readings cooled while price trends continued lower

*Firms expect to cut capacity and investment but are more optimistic about labor and inventories while current and future prices continue to trend lower quickly
Kansas Fed Composite Index increased to -1 points in January from -4 points in December. The production index rose to -4 in January from an upwardly revised -6 in the previous month. New Orders (-8 vs. -15 in Dec) improved but remained in contractionary territory, while the Shipments (2 vs. 1) remained near neutral. The Backlog of Orders (-17 vs. -16) and New Orders for Exports (-15 vs. -2) worsened and moved further into contractionary territory. Employment measures also fell on aggregate, with the Number of Employees (4) unchanged, while the Average Workweek (-8 vs. 0) fell into contractionary territory. Price measures ticked higher, with Prices Received (16 vs. 15) and Prices Paid (20 vs. 18) up slightly. Current inventory measures were mixed, with increases in Materials (4 vs. -2) and a decrease in Finished Goods (-6 vs. -2). Business outlook six-month ahead worsened but remained slightly expansionary. The future expected level of Backlog of Orders and Number of Employees rose, but otherwise, there were broad declines in the other sub-indexes, with notable drops in measures of price and inventories.
Why it Matters: The overall index stabilized to a neutral reading despite demand measures continuing to be in contractionary territory. Increases in price measures and a move higher in delivery times (to neutral) also show some persistence in supply-side impairments. Drops in the workweek and backlog of orders continue the common theme of reduced capacity needs. The future outlook also, as seen elsewhere, gave a mixed picture of future demand expectations with the desire to raise headcount countering drops in new order expectations.

*The KC Fed’s Manufacturing survey stabilized, but the sub-index level showed demand continues to contract and employment needs cooling

*Gains in new orders and production helped stabilize the headline but remain negative as 8 of 13 subindexes are in contractionary territory.
The Conference Board Leading Economic Index fell by 1.0% in December to 110.5 and is now down 4.2% over the past six months. The financial component's negative contribution in December mainly came from a worsening in the lead credit index and the change in the Treasury curve. The nonfinancial part of the LEI contributed more negatively. The largest detractors were due to declines in ISM New Orders and Average Work Week.
Why it Matters: December did not see any notable change in the current negative LEI trend, with the CB’s LEI index summarizing already known data releases and market price moves that were increasingly negative. However, similar to the Chicago Fed’s CFSEC, it still nicely summarizes some key data that has had a history of being more “leading” indicators of future growth. “The U.S. LEI fell sharply again in December, continuing to signal recession for the U.S. economy in the near term,” said Ataman Ozyildirim, Senior Director, Economics, at The Conference Board. “There was widespread weakness among leading indicators in December, indicating deteriorating conditions for labor markets, manufacturing, housing construction, and financial markets in the months ahead. Meanwhile, the coincident economic index (CEI) has not weakened in the same fashion as the LEI because labor market-related indicators (employment and personal income) remain robust. Nonetheless, industrial production, also a component of the CEI, fell for the third straight month. Overall economic activity is likely to turn negative in the coming quarters before picking up again in the final quarter of 2023.”

*The six-month LEI growth rate is signaling a recession is coming

*Recession indicators are more pronounced in the non-financial components of the LEI currently
Policy Talk:
Going into next week’s FOMC meeting, the Fed has signaled it will increasingly be marked-to-market in using incoming data to determine the future policy path. Speakers last week on both sides of the dove-hawk spectrum, as seen from Brainard and Waller, indicated a belief that a soft landing was still possible while inflation moderated back to target. This is an increasingly risk-friendly development and reduces worries the Fed will push back on financial condition easing. Further, the data has generally continued to cooperate, as real economic activity measures cooled in December, while inflation readings and expectations continue to trend lower. When accounting for leading indicators in labor, such as weekly hours and temp hiring, it also looks like things are increasingly loosening there.
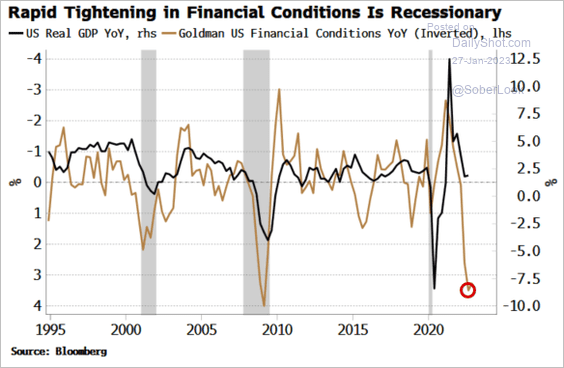
*Despite the recent loosening in financial conditions, the move tighter last year will increasingly hit the real economy in Q1

*PCE Deflator is quickly approaching the Fed funds rate level, with the three-month annualized now below
This means, despite the now mandatory statement that inflation remains too high, policymakers increasingly believe that policy is approaching an appropriately restrictive level to rebalance supply and demand back to a level that will drive core PCE back towards target, likely by early 2024. As a result, whether the Fed raises by another 50 bps or not in Q1 is no longer the market's focus, and instead, the duration at the terminal rate and even QT is increasingly in focus.
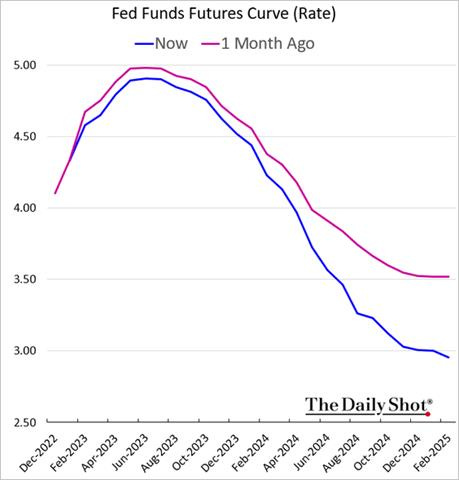
*The market continues to debate whether growth and inflation will drop enough to warrant rate cuts in the second half of this year, with the Fed funds future curve and lower front-end yields pricing in a more dire outlook despite recent moves in risk-assets and market-derived inflation readings
We continue to believe that the real policy error risk will be an undershooting of the target rate of 2% due to an increasingly normalized supply-side backdrop, a much more price-sensitive consumer, reducing demand-pull in services, along with increased supplies of shelter continued to drop home and rental costs there. As a result, we take comfort that the Fed is slowing down and increasingly acknowledging a more two-sided risk scenario to its dual mandate. Waller even noted that the lagged effects of policy may be even shorter in the current environment, now 6 to 9 months, instead of a year or more. This means the next few months will be when the bulk of tightening hits the real economy. As a result, we expect a significant change in tune from Fed officials by the March meeting. We could envision SEPs showing lower inflation forecasts for ’24 without too much worsening in growth and UER forecasts (yet), given where they are currently. Of course, all eyes will be looking for indications of rate cuts, but it will likely be too early for them to signal that yet. Finally, next week’s ECI and JOLTs data will be critical to Fed officials, given the growing evidence that labor markets are cooling.

*Supply-chain stresses continue to ease, as falling demand is allowing a better balance and lower logistical costs to occur
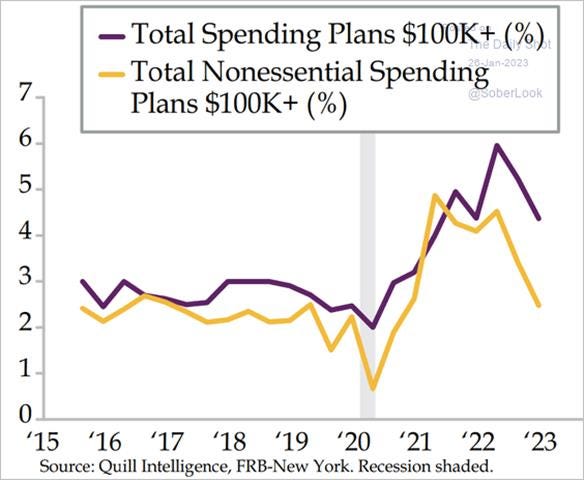
*Consumers are increasingly reducing spending, even as inflation for gas and goods fall and confidence rebounds
*Firms are cutting capacity, even if they hold on to workers, with readings for the average workweek consistently falling across surveys
Last week the Fed released its January ‘23 Beige Book, which noted little change in economic activity since the previous report. In general, contacts expect flat growth in the coming months.
Some retailers reported consumer spending as more robust than expected over the holiday period, while tourism contacts also reported moderate to robust activity augmented by strong holiday travel. However, contacts broadly reported inflation was still seen as reducing demand. Better availability of vehicles helped auto sales, but they were still flat during the period.
Manufacturers indicated that activity declined modestly, and many districts reported an easing in freight costs and input prices, though some said input costs remained elevated.
Housing markets continued to weaken, with sales and construction declining, while commercial real estate activity slowed slightly, on average, with a notable weakening in the office market.
The service industry was stable outside of financials, with the financials declining due to falling loan demand for mortgages and from commercial and industrial clients.
Labor markets remained strong in most districts, and although some districts noted that labor availability had increased and wage pressures had fallen, firms continued to report difficulty in filling open positions.
Selling prices increased at a modest pace in most districts, though many said that the pace of increases had slowed. Many retailers noted an increased difficulty in passing through cost increases. On balance, contacts said they expected future price growth to moderate further in the year ahead.

*The Fed’s Beige Book continues to echo business surveys and now increasingly harder production and retail sales data

*Respondent rhetoric is increasingly becoming negative as measured by the use of “strong” verse “weak”

*Respondents increased their focus on “slowdown, recession, and “housing” while mentions about “prices” stayed steady and “rates” and “wages” continued to trend lower
The Chicago Fed’s Research group recently released a paper titled The Recent Steepening of Phillips Curves, which highlighted that changes in the unemployment gap had a major impact on steepening the curve. They were unable to attribute other sources of economic slack, such as the labor force participation gap and the output gap. In addition to the unemployment gap, inflation expectations have also played an increased role in determining inflation in many industrialized nations during the recovery from the Covid-19 pandemic. They determined that it was too early to determine whether this steepening of the Phillips curve would persist. It is important to monitor this ongoing debate, given that the FOMC has mixed views on how much the labor market needs to loosen to trend inflation back to target.
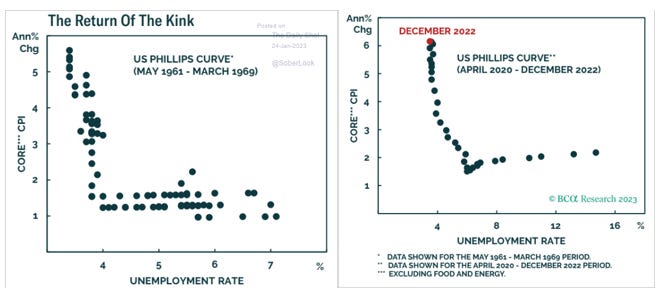
*Countries had a very flat Phillips curve before the pandemic. Now economists are debating if there has been a structural change
Technicals and Charts:
Four Key Macro House Charts:
Growth/Value Ratio: Growth is higher on the day and the week, and Large-Cap Growth is the best-performing size/factor on the day.

Chinese Iron Ore Future Price: Iron Ore futures are higher on the day and the week.

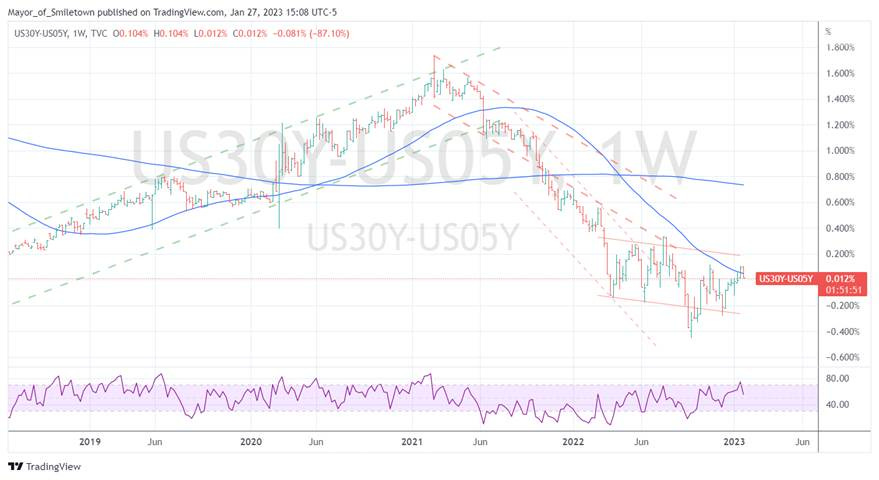
5yr-30yr Treasury Spread: The curve is flatter on the day and the week.
EUR/JPY FX Cross: The Euro is stronger on the day and the week.

Other Charts:

With a golden cross beginning to form (50 DMA > 200 DMA) and now a week above the 2022 downtrend resistance, it is possible the MOAT (Mother Of All Trendlines) has been broken. - @Mr_Derivatives

Retail flows have picked up significantly since the beginning of the year as FOMO begins to take hold…

…with those flows going into the commonly expected places again

Indirect bidders, a category including international investors and global central banks, have been showing up in force in Treasury auctions this year after a rather subdued showing in 2022. Indirect bidders accounted for 75.7% of Wednesday’s $43 billion sale of 5-year notes, a record share. They snapped up 77.1% of Thursday’s seven-year auction versus a six-month average of 67%. The reignited appetite suggests that overseas investors are buying into the idea that the Federal Reserve will pivot in the not-too-distant future, according to Ian Lyngen of BMO Capital Markets.

We’re getting a “seasonally unusual pattern” in gasoline prices, @bespokeinvest. Refinery capacity and crack spreads indicate a tighter market for distillates but unclear how much of this is driving price verse higher demand.

The EU is floating a plan to cap the price of Russian diesel at $100 a barrel from Feb. 5 — a level that might help to stave off the very worst effects of a fuel-imports ban that it will impose on Moscow on the same day as punishment for the nation’s invasion of Ukraine. - Bloomberg

“There is now a record divergence between "hard" and "soft" economic data. Using the St. Louis Fed methodology: Hard Data Econ Index = +1.6 (+.6 on avg at recession start) - Soft Data Econ Index = -2.5 (-.6 on avg at recession start).” - @3F_Research

“Many are focused on recent GDP data, but we are focused on profit implications. Our latest estimate shows YoY profits at approximately 8%. Our proprietary forecasts for profits tell us we are likely headed toward a contraction, though we see some abatement. Public data say this has begun, but our estimates of NIPA data suggest this hasn't. In the current setting, we are seeing a large drag on profitability coming from businesses' own spending, i.e. their reinvestment.” - @prometheusmacro

A recession model based on nine asset classes at JPM finds the odds of an economic downturn priced into financial markets have actually fallen sharply from their 2022 highs.

Mentions of “labor shortages” in earnings are quickly replaced by mentions of “job cuts.” - @M_McDonough

The Bureau of Labor Statistics' quarterly measure of real wages is now positive, something we see buffering any weakening in aggregate demand, especially if inflation continues to trend lower while labor markets return to a more normal balance, keeping wage gains sticky.
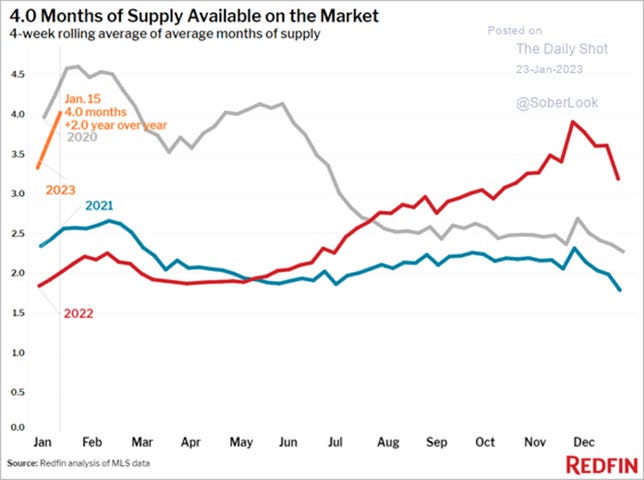
The total number of homes for sale increased 15% YoY going into December, the biggest uptick on record. However, new listings declined by more than 20%, which means homes are sitting on the market as prospective buyers stay on the sidelines and wait for mortgage rates and home prices to decline further from their peaks. That’s also evidenced by a slowing market: The typical home that sold was on the market for 37 days, up from a record low of 17 days in June and up from 28 days a year earlier, the biggest year-over-year slowdown on record. Just 30% of homes sold within two weeks, the lowest share since January 2020. - @Redfin

The low-interest rate era of the past ten years, in addition to the post-COVID-19 demand for WFH space, has led to a record number of multi-family rental units under construction. The combination of WFH demand waning on an incremental basis and the record supply of new rental units in the pipeline should lead to an ongoing moderation in the OER component of CPI going forward. - III Capital Management
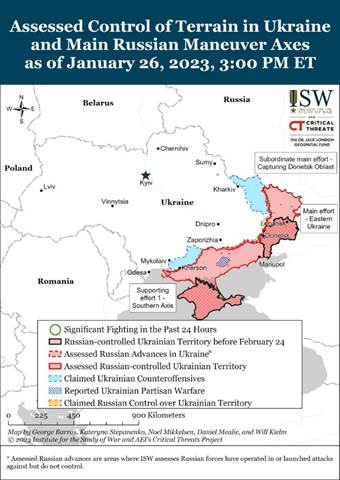
Russian forces launched another massive series of missile and drone strikes across Ukraine on January 26. Ukrainian Commander-in-Chief General Valery Zaluzhnyi stated that Russian forces launched 55 air- and sea-based missiles. Ukrainian air defense shot down 47 of the 55 missiles and all 24 Shahed 136 and 131 drones. Several missiles struck critical infrastructure in Vinnytsia and Odesa oblasts. - @criticalthreats
Articles by Macro Themes:
Medium-term Themes:
Labor Markets Loosening:
Longer Bench Time: Unemployed Americans across the U.S. are spending more time out of work as employers slow down hiring from a red-hot pace earlier in the pandemic. In December, 826,000 unemployed workers had been out of a job for about 3½ to 6 months, up from 526,000 in April, according to the Labor Department. Earlier this month, the number of people seeking ongoing unemployment benefits, known as continuing claims, was 26% above half-century lows reached last spring. Demand for labor is weakening fastest in white-collar industries. - Unemployed Americans Find Job Searches Take Longer as Labor Market Cools - WSJ

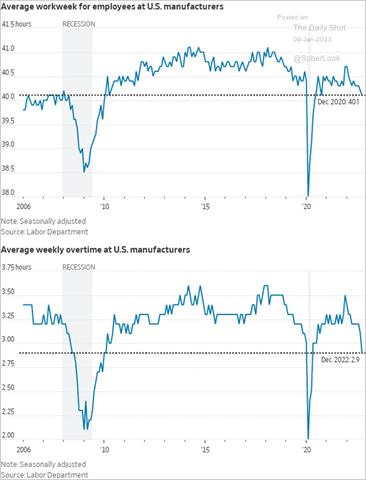
Leading Indicator?: In the last five months, employers cut 110.8K temp workers, including 35K in December, the largest monthly drop since early 2021. Many economists view the sector as an early indicator of future labor-market shifts as temporary employment declined before some recent recessions and during economic slowdowns. Still, trends in the temp sector are volatile and don’t necessarily signal a recession is imminent. Temp jobs fell four months in a row in 1995, for instance, during a period of economic growth.However, currently, the broader decline in temp employment coincides with other indications of a labor-market slowdown. Hiring is cooling. Workers are taking longer to find jobs and staying on unemployment benefits longer. And workers’ average weekly hours are back at pre-pandemic levels. Manufacturers’ overtime hours slipped in December to the lowest level since the pandemic lockdowns and the aftermath of the 2007-09 recession. - Companies Cut Temp Workers in Warning Sign for Labor Market – WSJ

Longer-term Themes:
Energy’s Midlife Crisis:
Long Road to Kathmandu: Germany and France warned that EZ businesses will need to unleash investments on a nearly unparalleled scale to keep from falling behind US and Chinese firms as countries revamp their economies to make them more climate-friendly. German Chancellor Olaf Scholz and French President Emmanuel Macron met in Paris Sunday to discuss how the European Union should respond to President Joe Biden’s Inflation Reduction Act, which includes roughly $500 billion in new spending and tax breaks over a decade to benefit US companies. The U.S. law will subsidize energies of the future, from hydrogen to batteries, wind, and solar, and will aim to make manufacturing self-reliant and to ensure the country isn’t dependent on China or other nations. - Germany and France Push for Huge Spending to Compete With US - Bloomberg

Demand > Supply ’23: According to the IEA, a record oil supply in 2023 will ultimately not meet demand, with a gradual shift in the balance leading to a notable shortfall in availability by the end of the year. The Paris-based organization's monthly Oil Market Report projected demand to rise by 1.9mn b/d to 101.7mn b/d this year. The IEA forecast shows supply outstripping demand by nearly 1mn b/d in the current quarter and in the second quarter again marginally, before a flip. Demand in the third and fourth quarters will be 1.6mn b/d and 2.4mn b/d, respectively, above supply, it said. The IEA cautioned that the timing and pace of Chinese demand recovery and Russian supply resilience would affect its forecasts. - Record oil supply will not meet demand in 2023: IEA - Argus

The Slow Painful Death of Gasoline: Gasoline demand in the U.S. has peaked, with a surprise slowdown last year signaling that consumption is unlikely to return to pre-Covid levels. American drivers are traveling more miles on less fuel than ever thanks to a generation of cars with more efficient engines as well as new electric vehicles. The government forecasts further declines in gasoline demand this year and next. In the next several years, the fuel industry is poised to cut supply faster than the drop in demand, with more plants due to shut down or convert to smaller biofuel facilities. The mismatch could result in production crunches for gasoline, price spikes, or even limited outages. Paradoxically for drivers, it’s gasoline’s slow death that will make it painful.- Peak Gasoline Heralds Price Shocks for Drivers, Inflation Headaches – Bloomberg

Cyber Life and Digital Rights:
The NSO Group’s Pegasus software was used routinely to listen in on conversations with U.S., U.K., and E.U. officials, prompting investigations into abuses of its shockingly affordable military-grade surveillance.NSO Group and its peers normally sell their spyware to repressive governments in the Middle East, Africa, and Asia. Supposedly democratic European governments have also been caught using it to spy on journalists, activists, and political opponents. While such tools originated in law enforcement, they’ve become weapons for espionage and intimidation that the available evidence suggests are used mainly by authoritarian governments around the world, exporting repression, fear, and human rights abuses across borders. Now policymakers are attempting to push back on such tools. - Spyware Finally Got Scary Enough to Freak Lawmakers Out—After It Spied on Them - Bloomberg

Food: Security, Innovations, and Climate Change Implications:
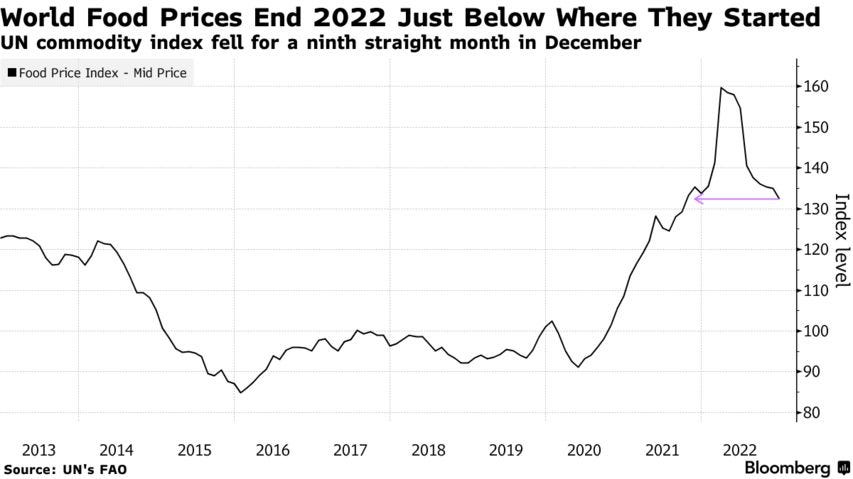
Going Back Up?: The United Nations’ index of food-commodity costs soared to a record in March last year, shortly after Russia’s invasion of Ukraine crippled vital flows of grain and vegetable oils from the breadbasket nation. Prices then slid as a Black Sea crop-export deal, and good harvests in other growers buffered supplies before steadying toward year-end. However, Food prices will probably climb this year unless there’s major debt relief and financial support from the international community, the International Food Policy Research Institute warned this week. Agri-commodities and fertilizers are still historically expensive, while grain stockpiles remain tight just as extreme weather in places like Argentina and East Africa damages crop prospects. - World Food Index Ends Year Where It Began After Dramatic Run - Bloomberg
Worst Ever: Nearly a year after it began, the worst avian-influenza outbreak in U.S. history is continuing to decimate poultry flocks across the Midwest and Colorado, frustrating efforts to keep the virus from affecting the nation’s egg prices and supply. People working on the problem say there is no easy way to stop the spread of bird flu. Instead, the virus must be allowed to run its course. “There is no historical context for this. It’s like when Covid hit for humans,” said Mike Tincher, rehabilitation coordinator for Colorado’s Rocky Mountain Raptor Program. To keep bird flu from spreading, entire poultry flocks must be destroyed after an infection is confirmed. The outbreak has caused the deaths of nearly 58 million poultry in 47 states, according to U.S. Department of Agriculture data.- Worst Avian Flu in U.S. History Is Hitting Poultry, Wild Birds, Even Bears – WSJ

Reason for Optimism: Farmers depend on synthetic fertilizers to deliver the high crop yields required to meet global food demand, but that comes at a cost to the environment. Much fertilizer production relies on natural gas or coal, accounting for just over 2% of the world’s climate-warming emissions, and chemical fertilizers contribute to agricultural runoff that damages wildlife.All this has spurred a hunt for alternatives to mineral fertilizers that’s starting to achieve results. Agribusiness heavyweights including Bayer, Corteva, and Archer-Daniels-Midland and a crop of startups are closing in on some solutions to reduce the use of conventional fertilizers, including turning to microbes, recycled organic waste, and other lower-emission and chemical-free substitutes.- How Microbes Can Help Solve the World’s Fertilizer Problems - Bloomberg

Expanding CFIUS: A bipartisan group of lawmakers is renewing a push to intensify oversight of foreign purchases of U.S. farmland, citing concerns over recent acquisitions by Chinese buyers. Legislation set to be introduced in both the House and Senate would increase the level of scrutiny of non-U.S. buyers of U.S. farmland, putting the agricultural sector squarely in the domain of the Committee on Foreign Investment in the U.S., or CFIUS, which reviews investments for national security concerns. It would also add the agriculture secretary to the CFIUS panel and make clear that its goal includes protecting the U.S. agricultural supply chain from foreign interference.- Lawmakers Seek Scrutiny of Farmland Purchases by Chinese, Other Foreign Buyers – WSJ

Authoritarianism in Trouble?:
Now the Clean Up: A broad-ranging investigation into the invasion of Congress, the presidential palace, and the Supreme Court that day has resulted in more than 1,800 people being arrested and prompted investigators to open probes against former high-ranking government officials, the federal police, and prosecutors say. The most prominent target is the right-wing former president, Jair Bolsonaro, who prosecutors say incited the violence by not conceding his election loss to Mr. da Silva in the Oct. 30 presidential elections and asserting for months before the vote that it could be stolen without offering evidence. - Brazilian Riot Investigators Probe Possible Crimes Against Democracy - WSJ

Hiding the Past: The Indian government has asked social media giants Twitter and YouTube to take down videos and tweets about a BBC documentary on 2002 religious riots in Prime Minister Narendra Modi’s home state of Gujarat. India’s Ministry of Information & Broadcasting has issued directions for blocking multiple videos hosted on Youtube of the first episode of the documentary, titled “India: The Modi Question.” The South Asian nation has seen rising anti-Muslim sentiment as Modi and his Bharatiya Janata Party has pushed ahead with their Hindu nationalist agenda since first coming to power in 2014. - India Blocks Social Media Posts on BBC Documentary on 2002 Riots - India

Asian Tigers 2.0:
Tiger, Tiger Burning Bright: India’s economic transformation is kicking into high gear. Global manufacturers are looking beyond China, with Prime Minister Narendra Modi stepping up to seize the moment. The government is spending nearly 20% of its budget this fiscal year on capital investments, the most in at least a decade. Modi is closer than any predecessor to being able to claim that the nation, which may have just passed China as the world’s most populous, is finally meeting its economic potential. To get there, he’ll have to wrestle with the drawbacks of its exceptional scale: the remnants of the red tape and corruption that has slowed India’s rise, and the stark inequality that defines the democracy of 1.4 billion people. - The Global Economy Needs a New Powerhouse. India Is Stepping Up - Bloomberg

Best-in-a-Half-Century: The Philippines' economy grew 7.6% in 2022, its best performance since 1976. Yet dark economic clouds loom across the globe, adding to the 14-year-high inflation and other domestic pressures that could keep the growth rate fragile. A closer look at the data shows personal consumption grew 7% year-on-year in the three months to December, the slowest pace since a contraction in the first quarter of 2021 when the nation hadn’t fully reopened. That suggests that fast inflation and the central bank’s most aggressive rate tightening in two decades are beginning to clip growth. - Risks Mount After Philippines’ Best Growth in Half a Century - Bloomberg

VIEWS EXPRESSED IN "CONTENT" ON THIS WEBSITE OR POSTED IN SOCIAL MEDIA AND OTHER PLATFORMS (COLLECTIVELY, "CONTENT DISTRIBUTION OUTLETS") ARE MY OWN. THE POSTS ARE NOT DIRECTED TO ANY INVESTORS OR POTENTIAL INVESTORS, AND DO NOT CONSTITUTE AN OFFER TO SELL -- OR A SOLICITATION OF AN OFFER TO BUY -- ANY SECURITIES, AND MAY NOT BE USED OR RELIED UPON IN EVALUATING THE MERITS OF ANY INVESTMENT.
THE CONTENT SHOULD NOT BE CONSTRUED AS OR RELIED UPON IN ANY MANNER AS INVESTMENT, LEGAL, TAX, OR OTHER ADVICE. YOU SHOULD CONSULT YOUR OWN ADVISERS AS TO LEGAL, BUSINESS, TAX, AND OTHER RELATED MATTERS CONCERNING ANY INVESTMENT. ANY PROJECTIONS, ESTIMATES, FORECASTS, TARGETS, PROSPECTS AND/OR OPINIONS EXPRESSED IN THESE MATERIALS ARE SUBJECT TO CHANGE WITHOUT NOTICE AND MAY DIFFER OR BE CONTRARY TO OPINIONS EXPRESSED BY OTHERS. ANY CHARTS PROVIDED HERE ARE FOR INFORMATIONAL PURPOSES ONLY, AND SHOULD NOT BE RELIED UPON WHEN MAKING ANY INVESTMENT DECISION. CERTAIN INFORMATION CONTAINED IN HERE HAS BEEN OBTAINED FROM THIRD-PARTY SOURCES. WHILE TAKEN FROM SOURCES BELIEVED TO BE RELIABLE, I HAVE NOT INDEPENDENTLY VERIFIED SUCH INFORMATION AND MAKES NO REPRESENTATIONS ABOUT THE ENDURING ACCURACY OF THE INFORMATION