
Tactical Pause or Ready to Burst: Has the Reflation Trade Gone Too Far? - Midday Macro – 4/17/2024
Color on Markets, Economy, Policy, and Geopolitics

Tactical Pause or Ready to Burst: Has the Reflation Trade Gone Too Far?
Midday Macro – 4/17/2024
Market’s Weekly Narrative:
Risk sentiment has turned more negative in light of last weekend’s geopolitical event and expectations the Fed will remain on hold longer than previously expected due to better-than-expected retail sales in March. Market breadth in equities has worsened, and leadership has changed with more defensive sectors outperforming, although large-cap growth has been the best size/factor combination. However, as it stands, options markets are indicating that recent declines are more of a consolidation than the start of a more prolonged bear market. Following the stronger inflationary data last week and positive retail sales report this week, the Fed took a June rate cut off the table, but markets are still pricing a 50/50 chance for a July cut. Sensitivity to incoming data will continue to be high. Speaking of the data, housing starts cooled in March, as higher mortgage rates hamper demand, although homebuilder sentiment remained steady. Industrial production was stronger than expected, supporting a strong finish in economic activity in the first quarter. Elsewhere, the Bank of Canada left its benchmark rate unchanged at 5%, as expected, but indicated a June rate cut was still possible. Policymakers at the ECB continued to signal that disinflationary progress was continuing, also leaving a summer cut likely.

Crude oil prices moved lower today after the EIA reported an inventory increase of 2.7 million barrels. Prices were already trending lower as Irab’s attack on Israel was seen as non-escalating. Copper continued to move higher as the growing demand for green-focused manufacturing outweighed worries around China’s property market. Speaking of China, inflation data showed a second month of positive readings, coming in at 0.1% YoY, but lower than the expected 0.4%. Retail Sales and industrial production data also missed expectations, although GDP, not surprisingly, was in line. The agriculture commodity index continues to trend higher, although performance has been varied between grains, beans, and softs. The dollar is off of recent highs with higher real rates and geopolitical concerns, moving the $DXY to 106.5 earlier in the week, but now slightly below 106. All eyes are on the BoJ as the Yen continues to test key levels where support was discussed. The Euro is weaker due to the more dovish tone from the ECB, with yield differentials widening. Finally, the Chinese Renminbi remained stable with no material changes from Beijing despite notable strengthening in the dollar.

Headlines:

Deeper Dive:
Stickier-than-expected inflation, continued strong job gains, and now higher-than-expected retail sales have prompted a large sell-off in rates and broad dollar strength in April so far. At the same time, equities have pulled back, with positioning, sentiment, and breadth much more negative. With no growth slowdown showing in the hard data and a more hawkishly patient tone from the Fed, markets have removed expectations for a June rate cut. At the same time, geopolitical risk, although off highs going into last weekend, still supports commodity prices, especially oil. We feel the current narrative may be stretched, and a tactical retracement is likely in several areas (such as lower yields and weaker USD) as the reflation narrative becomes challenged. At the same time, this doesn’t necessarily mean that risk assets won’t recover from recent weakness, with dip buyers likely to support U.S. equities in the coming week as earnings come into focus.

*Equities have finally taken notice of a more hawkish Fed policy outlook…

*…with higher yields driving equities lower

*Forecasters have been caught off-guard by the higher-than-expected headline and core inflation readings recently
One of the main driving forces of the current reflationary narrative has been higher oil prices. Price increases have been driven by OPEC+ production cuts and concerns geopolitical risks will disrupt supply more so than views that demand will materially increase. This has led to positioning in oil to be extremely long. With Israel being pressured to de-escalate by its allies and Iran unlikely to escalate further by attacking an oil container ship, we see a rising probability that speculators close longs, pressuring WTI prices lower and forcing more stops, leading to WTI to move back towards the bottom of its current rising channel range around $78. As a result, we added a short oil position through the $USO ETF Tuesday to reinforce our existing short gasoline position. With oil prices leading rates, this reversal in momentum would take pressure off yields, especially in the longer end, which have been pricing in greater growth expectations, a view supported by higher commodity prices. Due to this belief, we also added a long position in longer-end Treasuries through the $TLT ETF.

*Call volumes in oil have spiked recently due to worries that the conflict in the Middle East may worsen

*Overall commodity positioning now looks to be overweight

*Implied oil demand in the U.S. has been in line with recent years, according to the IEA
We also see rate markets being better supported by disinflationary progress elsewhere. Central bankers outside the U.S. are indicating policy independence from the Fed by indicating that summer rate cuts are increasingly likely. It looks like policy divergence and potentially cross-border asset volatility will be the story of the second quarter. Also, China has indicated that it is more than happy to stimulate its manufacturing base and export deflationary pressures. This means that the inflationary pressures from higher commodity buying by China, specifically in metals, will be offset by reduced costs for goods. This is different than in the past, where property sector-driven demand could not be offset while current green tech manufacturing can be in the form of cheaper exports.

*Developed nation’s central banks will increasingly cut rates on aggregate throughout 2024

*China is gaining market share in a number of areas, including EV and other green technologies
In summary, we believe markets have overpriced the reflation trade based on stronger growth so far this year and higher geopolitical risk premium. Regarding growth, the soft landing is now, so please enjoy. Not only in the U.S. but elsewhere, as we don’t believe the momentum out of China will be sustainable without greater domestic consumer participation, which will take time. Elsewhere, PMIs have shown a stabilization in activity, but we question the ability of global growth to accelerate much from this point, given that household and business balance sheets continue to normalize, real wage growth is slowing, there are tighter credit conditions globally, and greater uncertainty in light of political cycles and geopolitical events. There’s a lot to unpack in that statement, but our main point is that increased labor and capital availability in the U.S. (and elsewhere), along with increased productivity due to technological advancements and investments made following the pandemic, have increased the trend level of growth for the economy, and markets have now priced this in. People saved, businesses invested, and now we have reaped the rewards; hence, this may be as good as it gets.

*A pick-up in global PMIs is signaling stronger GDP growth ahead, but markets have already priced this in

*We believe sentiment is now overly positive on economic growth
As a final thought, moving through the next phase of the cycle, firms will become more defensive in expanding capacity as pricing power continues to soften. Consumer weakness (from such high levels of post-pandemic strength) is inevitable and already shows in the lower-income cohorts. Inflation could slow down, and real wages stabilize, but affordability is still impaired as prices have not adjusted lower, which is why consumer confidence and sentiment continue to remain subdued. The Fed sees this and, although now forced to remain patient due to the “totality” of the data being stronger than expected so far this year, continues to stress an uncertain outlook. We believe that the Fed will be quick to pivot its message at the first sign of trouble, such as a weaker NFP print, which would eliminate any residual wage spiral fears existing on the committee. Putting it all together, reduced inflationary pressures from commodities, greater caution towards increasing capacity by businesses (leading to looser labor markets), and greater price sensitivity by consumers are all going to eventually add up to disinflationary progress resuming enough for the Fed to have confidence that core-PCE will trend towards their target in a timely manner. This will further support both equities and rate markets and ease financial conditions.

*When broken down, inflation is now mainly driven by labor market tightness, something we see as changing

*Consumers have been reluctant to take on mortgages. As a result, it is unlikely housing activity can stay as robust as it has been

*Stresses are showing in household finances, especially in lower-incom cohorts

*We have closed our Russell short, given the -10% correction experienced there, and added an oil short and long-end Treasury long position
As always, thank you for reading, and please share our newsletter if you like it and know others who may enjoy it. Please feel free to reach out with any questions or comments. – Michael Ball, CFA, FRM
Technicals, Positioning, and Charts:
The Nasdaq has outperformed the S&P and Russell over the last five trading sessions. Consumer Staples, Utlities, and Healthcare were the best-performing sectors, while Low Vol, Growth, High Dvd Yield were the best-performing factors. Large-Cap Growth was the best-performing size/value combo.

@Koyfin
S&P optionality strike levels have the Zero-Gamma Level at 5136 while the Call Wall is 5300 and the Put Wall is 5000.

@spotgamma
S&P (/ES Futures) technical levels have key support at 5050, then 5110, with resistance at 5080, then 5305.

@AdamMancini4
Treasuries are higher on the day, with the 10yr yield around 4.60%, while the 5s30s curve is slightly steeper on the session, moving to around 9 bps.

Other Charts:

The recent selloff has moved the CNN Fear & Greed Index lower.

Market breadth looks to have peaked and has broken lower

Volatility skew has been indicating greater demand for downside protection or outright speculation.

VIX options volume is at post-pandemic highs.

Fund flows out of U.S. equities increased last week.

Despite poor performances this year from the likes of Apple Inc. and Tesla Inc., the group hit a record weighting in the benchmark recently. – Bloomberg
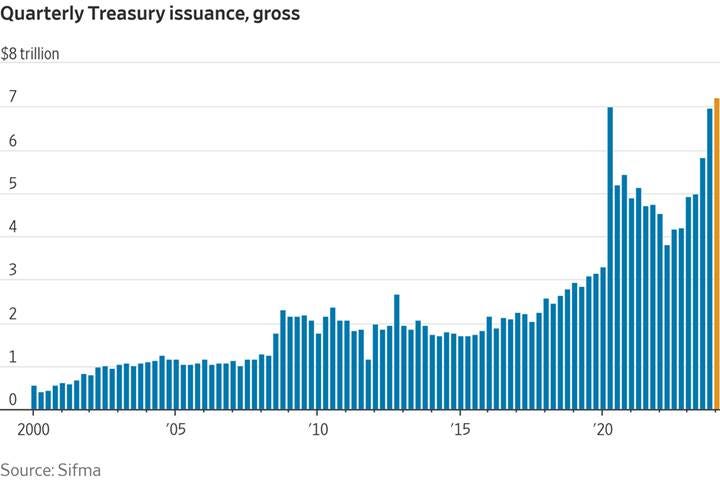
Issuance of U.S. Treasurys has exploded since the pandemic began, but lately, auctions have been weak. That's stoking investors’ concerns that markets will struggle to absorb an incoming rush of government debt. – WSJ

The dollar has been approaching the highs of its range for the past two years.

“Both gold and oil saw a run-up in price in previous weeks as US intelligence warned of an impending Iranian attack, but financial markets are still in low vol mode on the view geopolitical risks can be contained and against a positive cyclical backdrop.” - APAC
Appendix: Policy Talk, U.S. Econ Data Summaries, and Articles by Macro Themes
Policy Talk:
Chairman Powell, in a question-and-answer session Tuesday, noted that stickier inflation during the first quarter has increased the uncertainty on whether the Fed will be able to lower interest rates this year without a below-trend period of growth. “The recent data have clearly not given us greater confidence and instead indicate that it is likely to take longer than expected to achieve that confidence,” Powell said. He, however, indicated that the Fed was still far from considering rate increases. Powell said the Fed would leave rates at their current level “as long as needed” if inflation proved more stubborn. NY Fed President Williams believes policy is in a good place. He didn’t see recent inflation data as a “game changer” but added it would affect his opinion on where policy should be. He noted that disinflationary progress will still allow for rate cuts this year, keeping the level of restrictiveness of policy unchanged. “We will need to start a process at some point to bring interest rates back to more normal levels, and my own view is that process will likely start this year,” Williams said Monday in an interview with Bloomberg Television’s Michael McKee. When asked about potential growth, Williams said he is getting more optimistic and potential growth "is near 2% or higher." On the balance sheet, Williams said it’s a prudent course of action for officials to start slowing the pace of its unwind. “By slowing, we will be able to assess and analyze as we essentially get to an ample reserves kind of world that we are aiming for,” he said.

Vice Chair Jefferson reiterated that he believes disinflation progress will continue in prepared remarks at the International Research Forum on Monetary Policy in D.C., but if inflation proves more persistent, he said, “it will be appropriate to hold in place the current restrictive policy stance for longer.” Jefferson sees the outlook as still “quite” uncertain. The bulk of the speech was on historical examples of how policymakers think, noting the need to incorporate a large swath of data in decision-making, especially during uncertain times. Boston Fed President Collins also saw less urgency to cut rates seeing the risks of policy being too tight. In prepared remarks given at the Economic Club of New York, Collins still expected disinflationary progress to continue while labor markets stayed strong. She believed rate cuts would still be appropriate this year, given expectations for some slowing in demand in the second half of the year, but didn’t have a high level of confidence given the recent stronger-than-expected data in that forecast. Given the strong economic activity, Collins questioned the restrictiveness of the policy stance and broader financial conditions, leading her to lean closer to two rate cuts this year.

The March FOMC Meeting minutes showed Fed policymakers thought the current policy stance “remained well positioned to respond to evolving economic conditions, including the possibility of maintaining the current restrictive policy stance for longer should the disinflation process slow.” Financial conditions were seen as easing as higher equity prices were seen as offsetting higher yields. Yields were seen higher due to rising inflation compensation at the shorter end and due to stronger growth further out the curve. The committee noted that market-implied policy rate expectations had moved out in time and were shallower in the level of cuts. Balance sheet expectations also moved out in time, and “survey responses suggested a slightly smaller balance sheet size at the end of runoff than respondents had previously assessed.” Conditions in money markets were reported as stable, with ON RRP usage continuing to decline. Reserves were still seen as abundant, and although discussed, the committee made no decisions regarding how and when to slow the pace of runoff. However, participants generally favored reducing the monthly pace of runoff by roughly half from the recent overall pace, mainly in reducing the cap for Treasuries, given the slow pace of runoff for MBS.
The staff's review of the economic situation saw economic growth expanding at a “solid rate.” Labor markets continued to move into “better balance,” with conditions little changed since January, although wage growth was acknowledged as lower. Inflation was seen as continuing to decline, although recent measures had risen. Inflation expectations “were broadly in line with the levels seen in the decade before the pandemic.” The staff highlighted recent financial market developments and credit market conditions, noting that “credit continued to be available to most businesses, households, and municipalities.” The staff did note that delinquency levels were high for credit cards and increased for office properties.
FOMC participants discussed the “significant progress” made over the past year but varied in their assessment of recent months, with some seeing a broader stickiness versus others seeing seasonality factors. Participants discussed the uncertainty over how much lower rent readings would weigh on official shelter readings. Improving labor supply and stronger productivity were seen by several participants as reasons why disinflation progress would continue. Overall, growth was seen as likely to slow, but views on the consumer varied, with many participants seeing growing weaknesses in lower and middle-income households. Business contacts were more optimistic, with greater levels of investment, although tighter credit conditions were noted by a “few’ participants as constraining that. Labor markets continued to be seen in better balance, with reduced wage pressures; however, “some” participants noted that portions of the labor market were still tight. There was a high level of uncertainty around the economic outlook. Geopolitics were seen as adding to this, along with uncertainty over whether financial conditions were supporting demand. Further, “many participants pointed to the difficulty in assessing how recent immigration trends would influence the evolution of labor supply, aggregate demand, and overall economic activity.” Policymakers were aligned to keep rates at their current levels, and “almost all participants” believed it would be appropriate to ease policy at some point this year. The belief was that the disinflation progress would continue but would be “somewhat uneven.” With regards to quantitative tightening, officials also started discussing a process to slow the balance sheet runoff, which the Fed has indicated would be "fairly soon."

The Atlanta Fed Wage Tracker declined to 4.7% in March from 5% in February. Job stayers moved to 4.5% from 4.7% in the prior month, while job switchers declined to 5.2% from 5.3% in February, the lowest levels since December and November of 2021.

U.S. Econ Data Summaries:
Headline CPI increased by 0.4% MoM in March, the same as the previous two months, and it was above market expectations of a 0.3% MoM increase. This moved the annual rate to 3.5% from 3.2% in February. Core CPI increased by 0.4% MoM, which was the same as the previous two months, and was above market expectations of 0.3% MoM. The annual rate increased to 3.8% from 3.7% in the prior month. Food prices increased by 0.1% MoM (vs. 0% in Feb), with food at home unchanged (vs. 0.0%) and food away from home higher by 0.3% MoM (vs. 0.1% MoM). Energy prices increased by 1.1% MoM (vs. 2.3% MoM), with gasoline higher by 1.7% MoM (vs. 2.3% MoM) and energy services higher by 0.7% MoM (vs. 0.8% MoM). Core goods prices rose by -0.2% MoM (vs. 0.1% MoM), with new vehicles (-0.2% MoM), used cars (-1.1% MoM), and household furniture and supplies (-0.1% MoM) lower, while apparel increased by 0.7% MoM. Core services increased by 0.4% MoM, the same as the prior month. Shelter increased by 0.4% MoM, the same as the previous month, with little change in the underlying components. Transportation services increased by 1.5% MoM (vs. 1.4% MoM), with vehicle maintenance (1.7% MoM) and insurance (2.6% MoM) costs increasing at a greater pace, but airfares declined by -0.4% MoM. Medical care services increased by 0.6% MoM (vs. -0.1% MoM), driven higher by hospital services (1% MoM).
Key Takeaways: The annualized three-month measure of core inflation is now 4.5%, notably higher than the corresponding six- and 12-month measures, and although goods inflation subsided, the lack of progress on the service side remains problematic for the Fed. Policymakers can no longer call the prior two months a seasonal factor. The Cleveland Fed’s Median CPI increased by 0.4% in March, the same as in the prior month, keeping the annual rate at 4.6%. The trimmed-mean CPI increased by 0.3% MoM, the same as in February, moving the annual rate slightly higher to 3.6%. Finally, the Atlanta Fed's sticky-price CPI increased 5.0% on an annualized basis in March, following a 4% increase in February. On a year-over-year basis, the series is up 4.5%. Put together, these alternative measures showed a reversal in progress to some degree; however, there were no red alarms. Although there was some broadening in inflationary pressures, the majority of the increase is still concentrated in a few sub-categories. For example, auto insurance now makes up 2.2% of the 4.7% annual supercore inflation rate. However, with the three-month annualized change in super core now over 8%, the Fed can take no comfort in the first three months of CPI inflation data this year.

*Core services made up the bulk of the March monthly gain

*Monthly increases in core CPI have been trending higher, stalling out annual progress

*Declines in core goods were not enough to meaningfully offset increases in core services

*Transportation service cost increases were again the bulk of the increase in “supercore” CPI

*The three-month annualized change for “supercore” has notably reaccelerated

*Median and trimmed-mean moved sideways on the month, stalling the positive disinflationary trend

*The Atlanta Fed’s Sticky-Price CPI also firmed in March
Producer prices increased by 0.2% in March, following a 0.6% rise in February and below forecasts of a 0.3% MoM increase. This moved the annual headline PPI rate to 2.1% from 1.6% in February. Core PPI also increased by 0.2% MoM, following a 0.3% MoM increase in February. The annual rate increased to 2.4% from 2% in the prior month. Final demand for goods decreased by -0.1% MoM (vs. 1.2% in Feb). Final demand for energy declined by -1.6% MoM (vs. 4.1% MoM), while food increased by 0.8% MoM (1.1% MoM). Core goods increased by 0.1% MoM (vs. 0.3% MoM), with non-durable goods (0.0% MoM vs. 0.6% MoM) unchanged and durable (0.3% MoM vs. 0.1%) accelerating slightly. Final demand for services increased by 0.3% MoM (vs. 0.3%), with trade services (0.3% MoM vs. 0.3% MoM) rising by the same amount as last month and transportation and warehousing (0.8% MoM vs. 1.1% MoM) increasing at a slightly reduced rate. Other services (0.2% MoM vs. 0.3% MoM) decelerated slightly. Processed goods for intermediate demand declined by -0.5% MoM (vs. 1.5% MoM), while unprocessed goods declined by -1.9% MoM (vs. -0.7%). Energy goods (-1.5% MoM) and materials (-6.9% MoM) were both notable drags, while foods and feeds increased. Intermediate demand for services increased by 0.2% MoM (vs. 0.0% MoM). The price of trade, as well as transportation and warehousing remained unchanged, while other intermediate services increased by 0.3% MoM (vs. 0.1% MoM), increasing the annual rate to 3.6% from 3.1% in February.
Key Takeaways: Compared to CPI, PPI was notably more encouraging for the continuation of disinflationary progress, with the overall PPI beating expectations and the service side was again more subdued, meaning PCE would come in below CPI again. Intermediate and other staged pipeline pressures declined for goods and were little changed for services. The unchanged trade reading indicates pricing power remains more balanced at the wholesaler level. Further, we would expect transportation and warehousing prices to slow moving forward, given that PMI delivery time readings indicate no meaningful build-in pressure there. With PPI showing renewed goods disinflation pressure, some final demand service inflation, but notably less intermediate demand service pressure, the overall report indicates that CPI/PCE inflationary pressures through this channel in coming months should be reduced.

*PPI monthly increases fell to a more manageable level in March

*Final demand for services did pick up due to transportation and warehousing picking up
Import prices increased to 0.4% in March following a 0.3% rise in February. On an annual basis, import prices are higher by 0.4%. Imported fuel prices rose 4.7% MoM (vs.s. 1.4% MoM in March), with higher oil prices offsetting lower natural gas prices. Imports excluding fuel increased by 0.1% MoM (vs. 0.2% MoM). Prices for capital (-0.3% MoM) and consumer (-0.3% MoM) goods fell while food (1.6% MoM), industrial supplies (2% MoM), and autos (0.2% MoM) rose. Export prices increased 0.3% MoM, following a 0.7% increase in February. On an annual basis, export prices have declined by -1.4%. Agricultural export prices declined by -0.7% MoM (vs. 0.7% MoM), while exports excluding agriculture increased by 0.4% MoM (vs. 0.6% MoM).
Key Takeaways: Excluding fuels, import prices increased slightly during the month, indicating that inflationary pressures did not pick up through this channel in March. The optics on an annual basis continue to worsen as the monthly comparables have been more challenging, driving the annual rate for imports higher (mainly due to fuel import costs rising in the first three months of this year), and moving forward, should remain a headwind for another four months. However, the actual monthly increases show that import demand is not inflation accelerating, as was the case during the initial phase of the current inflationary cycle.

*The first three months of this year have seen a pick-up in import prices, mainly due to fuel costs rising

*Export prices have also been higher on the year so far due to non-agricultural product price increases
Retail sales increased by 0.7% in March, following an upward revised gain of 0.9% in February, and notably higher than forecasts of a 0.3% MoM. The retail control group, which excludes volatile items and better matches with broader spending trends, rose 1.1% MoM versus the 0.4% MoM consensus, while February was revised higher to +0.3% MoM from 0.0% MoM. The largest increases were in sales at nonstore retailers (2.7%), gasoline stations (2.1%), miscellaneous store retailers (2.1%), and building materials and garden equipment (0.7%). On the other hand, sales declined for sporting goods, hobby, musical instruments, & book stores (-1.8%), clothing (-1.6%), electronics and appliances (-1.2%), general merchandise stores (-1.1%), and autos (-0.9%).
Key Takeaways: The remarkably strong retail sales numbers for March contradict somewhat weaker survey and credit card spending evidence, although higher frequency card data varied by bank. So-called control-group sales, which are used to calculate GDP, jumped 1.1%, the most since the start of last year. This moved the Atlanta Fed’s projected Q1 GDP up notably. It is worth noting that the majority of retail sales reflect purchases of goods, however purchases made at restaurants and bars, the only service-sector category in the report, advanced 0.4% MoM. “This is an unequivocally strong [retail sales] report,” but it's “hard to see how the strength in consumption can continue for much longer, now that real after-tax income growth has slowed markedly, the bulk of excess savings from earlier in the pandemic has been spent, and a raft of leading indicators points to a marked softening in the labor market,” said Pantheon Macro Research.

*Retail sales have had two strong months of gains

*Online sales were the strongest sub-sector

*Discretionary purchase areas did see greater weakness

*The core control group's three-month annualized average has picked up after trending lower since last summer
Industrial production increased by 0.4% in March, which was in line with expectations, and followed an upwardly revised 0.4% increase in February. Manufacturing output increased by 0.5% MoM, following a 1.2% MoM increase in the prior month. Production of consumer goods (1.2% MoM vs. -0.9% MoM in Feb) retraced February declines, thanks to increases in auto production. Business equipment (0.1% MoM vs. 2% MoM) slowed due to declines in industrial goods. Non-industrial supplies (0.2% MoM vs. 1.1% MoM) slowed, with construction supplies (-1% MoM vs. 2.7% MoM) declining. Utilities increased by 2% (vs. -7.6% MoM), with both electric and natural gas utilities rising. Mining output declined by -1.4% MoM (vs. 3% MoM). Capacity utilization increased to 78.4% (vs. 78.2%). In Q1, industrial production fell by 1.8% annually, with factory and mining outputs down by 0.1% and 1.4%, respectively.
Key Takeaways: Manufacturing production came in higher than expected in March, and in addition to revisions higher in February, indicated that the manufacturing sector ended the first quarter on a stronger foot. Consumer goods production turned positive after three months of negative readings due to broad increases in durable and non-durable. It's also worth highlighting that both auto production and transit business equipment experienced solid gains for the second month in a row.

*Manufacturing production was stronger in March due to consumer goods

*Capacity utilization rose on the month, moving out of a downtrend

*Both durables and non-durables were higher on the month
Housing starts declined by -14.7% MoM to an annualized rate of 1.321 million in March, retracing the upwardly revised 1.549 million level in February and below forecasts of 1.48 million. Single-family housing starts declined by 12.4% to 1.022 million, and multi-units declined by -20.8% to 290K. Starts fell in the Northeast (-36% to 80K), the Midwest (-23% to 157K), and the South (-17.8% to 736K) but rose in the West (7.1% to 348K). Building permits declined by 4.3% to an annualized rate of 1.458 million in March, reversing the 2.3% increase observed in February and falling short of market expectations of 1.514 million. Single-family authorizations declined by -5.7% to 973K, while approvals for multi-segment were down by -1.2% to 485K. Across different US regions, permit declines in the South (-0.6% to 771 thousand), the Midwest (-14.7% to 197 thousand), and the Northeast (-20.8% to 160 thousand) offset gains in the West (5.1% to 330 thousand).
Key Takeaways: March’s housing starts was the lowest reading since last August and the biggest monthly decline since April 2020, as a rise in mortgage rates weighed on potential buyers. Permits also reached their lowest level since last July, signaling increasingly weaker activity in the housing market pipeline, with single-family unit permit authorizations falling to a five-month low. The housing pipeline is slowing with fewer buyers and likely firming costs.

*Declines were more broad-based, with only the increases in starts and permits in the West

*Starts this year were stronger than last until March
The University of Michigan’s Consumer Sentiment Index declined to 77.9 in April from 79.4 in March (the highest level since July 2021), preliminary estimates showed, below forecasts of 79. The sub-indexes for current conditions (79.3 vs. 82.5 in March) and expectations (77 vs. 77.4) both declined. One-year-ahead inflation expectations increased by 3.1%, from 2.9% in March, while the five-year outlook increased to 3% (vs. 2.8%).
Key Takeaways: The overall reading fell from its recent multi-year high due to renewed inflation concerns, with the one-year reading for inflation expectations moving to the highest in four months. “Sentiment moved sideways for the fourth straight month, as consumers perceived few meaningful developments in the economy,” said Joanne Hsu. “Overall, consumers are reserving judgment about the economy in light of the upcoming election, which, in the view of many consumers, could have a substantial impact on the trajectory of the economy.,” she added.

*There has been little change in the headline index over the last four months

*Individual sub-components have also changed very little

*Inflation expectations picked up in March
The NAHB/Wells Fargo Housing Market Index remained at 51.0 in April, maintaining its highest level since July 2023. The sub-index for current sales conditions increased one point to 57, and the sub-index for traffic of prospective buyers increased one point to 35. On the other hand, the sub-index for sales expectations in the next six months fell two points to 60. The April HMI survey also revealed that 22% of builders cut home prices this month, down from 24% in March and 36% in December 2023. However, the average price reduction in April held steady at 6% for the 10th straight month. Meanwhile, the use of sales incentives ticked down to 57% in April from a reading of 60% in March.
Key Takeaways: This was the first month in four that the NAHB index didn’t rise, as uncertainty surrounding where interest rates are heading is leaving potential home buyers hesitant.“April’s flat reading suggests the potential for demand growth is there, but buyers are hesitating until they can better gauge where interest rates are headed,” said NAHB Chief Economist Robert Dietz. Despite the pause this month, the overall sentiment gauge is still trending higher. Looking at the three-month moving averages for regional HMI scores, the Northeast increased four points to 63, the Midwest gained five points to 46, the South rose one point to 51, and the West registered a four-point gain to 47.

*The overall index was unchanged on the month

*Expected sales declined, while traffic and sales conditions increased
The New York Fed’s Empire State Manufacturing Index increased to -14.3 in April from -20.9 in the previous month, but it remained below the market consensus of -9.0. Demand and activity measures remained contractionary, with New Orders (-16.2 vs. -17.2 in March) and Unfilled Orders (-10.1 vs. -10.9) little changed, while Shipments (-14.4 vs. -6.9) contracted at a notably faster pace. Delivery Times (-7.9 vs. -1) shortened at a faster pace, while Inventories (3.4 vs. -12.9) moved to a more neutral, slightly expansionary level. Labor measures were slightly more positive, with the Number of Employees (-5.1 vs. -7.1) contracting at a slower pace, while the Average Workweek (-10.6 vs. -10.4) changed little. Price measures rose, with Prices Paid (33.7 vs. 28.7) increasing while Prices Received (16.9 vs. 17.8) declined slightly. The six-month ahead general business conditions reading declined but remained at the higher end of its recent range. Demand and activity measures fell, as did delivery and inventory intentions. Price changes mirrored the current readings, with prices paid rising. Hiring intentions dropped to near neutral. Finally, capex and tech spending both declined but remained expansionary.
Key Takeaways: Expectations were for a more significant improvement in the general business conditions reading. However, there was a notable decline in activity during the month, while demand readings were basically unchanged. Inflationary pressures in the report were mixed, with prices paid rising but other indicators weakening, such as prices received and delivery times. Forward-looking indicators broadly weakened a change from the usual dichotomy of current and future sub-index readings. Future investment plans moved down, continuing the trend lower after bouncing higher at the end of last year.

*The overall index moved higher, but there was no indication of any broader improvement in the sub-index reading

*Price pressures were mixed, with margin pressure indicated
The New York Fed’ Business Leaders Survey declined to -0.6% in April from 0.6 in March. The Business Climate (19 vs. -26.4) increased and continued to trend more positively. Labor readings were mixed, with the Number of Employees (2.3 vs. 0.6) turning slightly more positive and Wages (33.3 vs. 43.8) falling notably but remaining still highly expansionary. Inflationary measures declined, with Prices Paid (53.4 vs. 55.1) and Prices Received (22.7 vs. 27.8) trending lower again. Capital Spending (4 vs. -0.6) moved higher into expansionary territory. Forward-looking indicators moved slightly higher, although the expected business climate reading weakened but remained positive. Labor measures were little changed while inflation readings varied, but they also changed little on aggregate. Future capital spending plans declined to a more neutral reading.
Key Takeaways: Activity and business sentiment improved on the month, and inflationary pressures fell. Overall, this was a positive report in regard to what the Fed wants to see. Forward-looking indicators also remained positive, although they fell slightly. There was a worsening in the outlook for business climate and capital spending intentions, which dropped notably, although it still remained positive. However, the current capital spending activity moved higher from a neutral reading in the prior month. Overall, the business outlook remains negative at the current level but is improving, while future readings indicate a more cautious outlook.

*Business activity remains at a neutral level, with the business climate improving but still negative

*Inflation pressures fell but remained elevated
Articles by Macro Themes:
Medium-term Themes:
China’s Rebalancing Act:
Back to the Old Ways: China said its economy grew 5.3% in the first quarter compared with the same three months a year earlier. The pick-up was propelled by a rise in industrial production and swelling investment in factories. After a challenging few years, Chinese officials are steering activity and investment toward manufacturing and exports to compensate for domestic consumers’ reluctance to spend and a continuing crunch in the property market. Beijing is also seeking to stake out a commanding lead in newer high-tech industries such as electric vehicles and renewable energy equipment—sectors it counts among the “new productive forces” it wants to harness to fuel the next stage of China’s economic ascendancy. - China’s Factories Drive Uneven Economic Recovery – WSJ

Decision to Hold: The People’s Bank of China on Monday held the interest rate on its one-year medium-term lending facility at 2.5% while injecting 100 billion yuan ($13.82 billion) funds via the instrument. With CNY170 billion worth of MLF loans due on Wednesday, the PBOC has drained a net CNY70 billion liquidity from the financial system. The interest rates on the medium-term lending facility and reverse repurchase agreement are seen as a precursor for possible changes to benchmark loan rates. Monday’s hold suggests that the benchmark loan prime rate will likely be steady this month. - China’s Central Bank Holds Key Policy Rates, Drains Liquidity From Banking Sector – WSJ

Signaling: It appears to be just a matter of time before China’s central bank pulls out a controversial monetary policy tool that it has not used in more than two decades, following newly publicized instructions from President Xi Jinping. With the world’s second-largest economy at a critical juncture of fuelling growth in its bid to become a global financial superpower, a new book details some of Xi’s thoughts on finance, dating back to late 2012. President Xi has told China’s financial cadres that an active monetary policy toolkit must include a controversial means of injecting liquidity into the economy. Economist says the PBOC has not bought treasury bonds for years because monetary authorities did not want to fuel market speculation of a major stimulus. - Xi Jinping to China’s central bank: restart treasury-bond trade, after 2-decade hiatus - SCMP
Longer-term Themes:
The Singularity is Near (AI Developments) and Cyber Life (More Generally):
Section 702: Right-wing House Republicans on Wednesday blocked legislation to extend an expiring warrantless surveillance law that national security officials call crucial to gathering intelligence and fighting terrorism, dealing Speaker Mike Johnson a stinging defeat after former President Donald J. Trump urged lawmakers to kill the bill. It was the third time attempts to advance the bill have collapsed in the House. In December, Mr. Johnson scrapped plans to hold votes on rival bills to narrow the scope of the law after an ugly fight broke out among Republicans. - After Trump Broadside, Surveillance Bill Collapses in the House - NYT

Kid Codes: On 6 April, Maryland became the first state in the US to pass a “Kids Code” bill, which aims to prevent tech companies from collecting predatory data from children and using design features that could cause them harm. Vermont’s legislature held its final hearing before a full vote on its Kids Code bill on 11 April. The measures are the latest in a salvo of proposed policies that, in the absence of federal rules, have made state capitols a major battlefield in the war between parents and child advocates, who lament that there are too few protections for minors online, and Silicon Valley tech companies, who protest that the recommended restrictions would hobble both business and free speech. - Battle lines drawn as US states take on big tech with online child safety bills – The Guardian

Alert: Apple sent threat notifications to iPhone users in 92 countries on Wednesday, warning them that they may have been targeted by mercenary spyware attacks. The spyware alerts arrive at a time when many nations are preparing for elections. In recent months, many tech firms have cautioned about rising state-sponsored efforts to sway certain electoral outcomes. Apple also sent an identical warning to a number of journalists and politicians in India in October last year. Later, nonprofit advocacy group Amnesty International reported that it had found Israeli spyware maker NSO Group’s invasive spyware Pegasus on the iPhones of prominent journalists in India. - Apple alerts users in 92 nations to mercenary spyware attacks - TechCrunch

CAIOs: The number of companies with a designated head of AI position has almost tripled globally in the past five years, according to social network LinkedIn. Fawad Bajwa, AI lead at recruiters Russell Reynolds Associates, has “seen the landscape shift” since the launch of ChatGPT. The position was further elevated last month, when the White House announced federal agencies were required to designate chief AI officers “to ensure accountability, leadership, and oversight” of the technology. Yet the role’s responsibilities are still being worked out — and with the rise and fall of job titles now a constant in corporate life, it may not stay relevant forever. - The rise of the chief AI officer - FT
The Demise of Unipolarity: A World of Rising Regional Sphere
Growing List: President Joe Biden has added more Chinese companies and individuals to an export blacklist than any US administration, as growing frictions between the world’s biggest economies continue to complicate global trade. The Commerce Department added six Chinese companies to its entity list on Thursday, bringing the tally of new targets during the Biden administration to 319. That compares to the 306 entities added during Donald Trump’s time in the White House, when he oversaw a trade war with Beijing that hurt both countries’ economies. - Biden Surpasses Trump’s Record for Blacklisting Chinese Entities - Bloomberg

Trilateral: The first-ever trilateral summit among the U.S., Japan, and the Philippines was held at the White House last week, with all three leaders signaling that many more meetings would follow in the years to come. Japanese Prime Minister Fumio Kishida said that "multilayered cooperation" between allies and like-minded countries is essential to maintain and bolster a free and open international order based on the rule of law. On the economic side, the three leaders announced a new infrastructure project called the PGI Luzon Economic Corridor, which will connect Subic Bay, Clark, Manila and Batangas through the building of ports, rail, clean energy facilities and semiconductor supply chains. - U.S.-Japan-Philippines summit to send 'crystal clear' signal to China - NikkeiAsia

Food: Security, Innovations, and Climate Change Implications:
Deliberate Approach: NASA announced a new approach to dealing with an increasingly crowded and dangerous environment in Earth orbit with a space sustainability strategy that puts an initial emphasis on analyzing the problem rather than technologies to solve it. The strategy, NASA Deputy Administrator Pam Melroy said in a speech at the 39th Space Symposium, is intended to tackle the complexity of the topic. “I’ve been very uncertain about what steps are actually going to have the biggest impact,” she said, arguing that past analyses have been too simplistic. Two other goals address policy and coordination. NASA is working to update its internal policies for debris mitigation and support for active debris removal. - NASA rolls out new space sustainability strategy - SpaceNews

Cold Places (Deep Sea, Artic, and Space Capitalization):
Growing: NASA and the Swedish government announced that Sweden signed the accords in a ceremony at government offices in Stockholm. Sweden is the 38th country to sign the accords and the second in as many days, after Switzerland signed on April 15 in a ceremony at NASA Headquarters. With Sweden’s accession, 14 of 22 full members of the European Space Agency have joined, along with 13 of 27 members of the European Union. The Artemis Accords started with eight countries, including the United States, in 2020, and has grown steadily since then. The document outlines best practices intended to implement provisions of the 1967 Outer Space Treaty and other international agreements, as well as in other areas such as use of space resources and sharing of scientific data. - Sweden signs Artemis Accords - SpaceNews

Other Articles of Interest:
Evolving: The Wall Street Journal’s latest quarterly survey of business and academic economists shows forecasters ratcheting up their expectations for economic growth, inflation and the level of future interest rates. - Where Are Growth, Inflation and Interest Rates Headed? We Asked the Economists – WSJ

Pressure: Rents are for warehousing is falling in some markets as the urgency to find space and stock up on inventory recedes, and leasing rates are plateauing, according to reports from real estate services firms Cushman & Wakefield and Savills. The average asking rent for industrial real estate in the first quarter stayed flat at $9.73 per square foot per year, the first time in four years it didn’t increase on a quarterly basis, according to Cushman. Asking rents in California’s Inland Empire, the sprawling industrial hub east of the ports of Los Angeles and Long Beach, fell 2.7% in the first quarter from the previous quarter, according to Savills. - Warehouse Rents Slipping on Declining Demand – WSJ

Podcasts and Videos:
Bill Anderson: Using AI to Combat Hunger – Tools and Weapons with Brad Smith
Lots More on America's Electrical Components Crisis – Odd Lots
VIEWS EXPRESSED IN “CONTENT” ON THIS WEBSITE OR POSTED IN SOCIAL MEDIA AND OTHER PLATFORMS (COLLECTIVELY, “CONTENT DISTRIBUTION OUTLETS”) ARE MY OWN. THE POSTS ARE NOT DIRECTED TO ANY INVESTORS OR POTENTIAL INVESTORS AND DO NOT CONSTITUTE AN OFFER TO SELL -- OR A SOLICITATION OF AN OFFER TO BUY -- ANY SECURITIES AND MAY NOT BE USED OR RELIED UPON IN EVALUATING THE MERITS OF ANY INVESTMENT.THE CONTENT SHOULD NOT BE CONSTRUED AS OR RELIED UPON IN ANY MANNER AS INVESTMENT, LEGAL, TAX, OR OTHER ADVICE. YOU SHOULD CONSULT YOUR OWN ADVISERS AS TO LEGAL, BUSINESS, TAX, AND OTHER RELATED MATTERS CONCERNING ANY INVESTMENT. ANY PROJECTIONS, ESTIMATES, FORECASTS, TARGETS, PROSPECTS AND/OR OPINIONS EXPRESSED IN THESE MATERIALS ARE SUBJECT TO CHANGE WITHOUT NOTICE AND MAY DIFFER OR BE CONTRARY TO OPINIONS EXPRESSED BY OTHERS. ANY CHARTS PROVIDED HERE ARE FOR INFORMATIONAL PURPOSES ONLY, AND SHOULD NOT BE RELIED UPON WHEN MAKING ANY INVESTMENT DECISION. CERTAIN INFORMATION CONTAINED IN HERE HAS BEEN OBTAINED FROM THIRD-PARTY SOURCES. WHILE TAKEN FROM SOURCES BELIEVED TO BE RELIABLE, I HAVE NOT INDEPENDENTLY VERIFIED SUCH INFORMATION AND MAKE NO REPRESENTATIONS ABOUT THE ENDURING ACCURACY OF THE INFORMATION. I MAY OR MAY NOT HAVE POSITIONS IN ANY STOCKS OR ASSET CLASSES MENTIONED. I HAVE NO AFFILIATION WITH ANY OF THE COMPANIES OTHER THAN EXPLICITLY MENTIONED.