


Stronger Disinflationary Signs Keep Fed Happy and Rally Alive Despite Mixed Growth Picture - Midday Macro – 11/17/2023
Color on Markets, Economy, Policy, and Geopolitics

Stronger Disinflationary Signs Keep Fed Happy and Rally Alive Despite a Mixed Growth Picture
Midday Macro – 11/17/2023
Market’s Weekly Narrative and Headlines:
Equities are ending this Friday afternoon on a more neutral footing; however, the S&P and Nasdaq are up by over 2% on the week, maintaining their post-CPI gains, while the Russell was the clear winner as the small-cap index rose by around 5% on the week as value outperformed growth. This week’s treo of inflation reports showed the disinflationary process was still intact, significantly reducing the probability that the Fed would tighten further and bringing expectations for the first rate cut into early summer. Supercore CPI readings only rose by 0.2%, while shelter rises cooled, both adding to the notable drag energy had on headline readings. PPI and import prices also came in lower than expected thanks to declining energy and food costs, creating a Fed-friendly mosaic of price readings on the week. Fed officials took notice of the better inflationary data, with even the more Hawkish Mester noting policy was in a good place. There was also a fair amount of other economic data released on the week, with retail sales coming in better than expected. Industrial production was knocked lower by the UAW strike, while the NFIB Optimism Index was little changed despite a notable decline in revenue and earnings over the month. The NY, Philly, and KC Fed Manufacturing Indexes broadly hovered around neutral, with underlying sub-indexes pointing to a mixed picture by region. Housing starts came in strong, while homebuilder sentiment fell further, creating a muddied picture of the housing market. Finally, the NY Fed’s SCE survey saw consumer inflation expectations fall, contrasting a worrying rise in last week’s University of Michigan Survey. Yields are lower on the week, with the 2s10s curve little changed as some of the gains from CPI were lost due to the stronger retail sales report. All in all, Treasuries are close to recent highs as reduced inflationary and Fed worries support buying. Oil is rallying today, retracing losses from higher inventory levels reported earlier in the week as refinery utilization rates have bottomed and demand expectations are increasing. Copper had a solid week of gains, with Beijing announcing a more substantial support plan for the property sector. Short positioning was heavy there, so the bounce is still likely not a reversal in trend as prices are now in the middle of a multi-month range. The agg complex was little changed on the aggregate, with some softs again hitting recent highs while beans and corn were lower on the week. Finally, the dollar was lower on the week as real rates fell, reducing the expected rate differential advantage it has been enjoying versus other major crosses. The $DXY is finishing the week just under 104 as the Euro moved to 109, while the Yen remains around 150.

Deeper Dive:
We continue to believe a broader consumer slowdown is finally here. What started as an initial rolling recessionary type cycle, due to the uneven effects tighter financial conditions had on various sectors/industries, should finally move more broadly across the economy through reduced discretionary spending by consumers, especially among lower-income cohorts. Given the solid financial position businesses and households started from due to pandemic stimulus-related benefits and behavior changes, we continue to believe a soft landing scenario is still the most likely outcome. We also see the middle class as the primary driver of growth, and although job security is more uncertain for skilled workers due to overhiring and technological innovations, it is also likely worker retention will remain stickier than in past cycles (in the next few quarters). As we wrote last week, we have wavering conviction on this due to a high level of uncertainty. The “totality” of the data is not flashing warning signs, and leading economic indicators are actually firming while our view on the global macro backdrop has improved. However, in the end, it all comes down to the labor market holding up, something that has shown greater resilience than in past cycles due to the trouble firms had with securing qualified labor, which is now making them reluctant to lay off workers. However, business surveys increasingly indicate that firms are more actively looking to reduce headcounts as expectations for future demand fall, backlogs of orders contract, and increasing capacity utilization are no longer a priority, reducing workweeks. These are all early indicators that actual layoffs will increase. Further, although initial and continued claims are not yet problematic, the duration workers remain unemployed is increasing, which indicates that payrolls will increasingly trend lower. As a result, it is clear that labor markets are no longer tight enough to warrant real wage increases, and this will limit how much aggregate disposable income increases through demand-pull pressures push back on disinflationary forces. At the same time, wage-spiral concerns will completely evaporate for policymakers. Simply put, we are not worried about a renewed inflation increase from stronger demand. This is our main negative macro channel for slower growth, as looser labor markets will reduce aggregate demand, all else equal. However, as we teased last week, we want to highlight a few other increasingly negative factors.

*Workers are starting to increasingly worry about job security, causing turnover to trend lower and reducing wage-bargaining powers

*Middle and higher-income households have increasingly driven growth in the post-pandemic world

*There is a lag; it's unknown, but it’s there…
Consumer’s and business’s future income are becoming more uncertain, and access to credit is worsening, as most know by now. Funny enough, the most recent SLOOS report showed credit availability had improved in a few categories/cohorts. However, this doesn’t offset the longer-term credit tightening trend that started with the Feds policy tightening campaign and increased after the banking crisis events of March, which have led to reduced credit risk appetite by lenders. At the same time, loan demand continues to trend lower, with rates overly punitive by most borrower's standards. This has resulted in a reduced credit pulse and, together with a contracting Fed’s balance sheet, has led M2 to shrink on a year-over-year basis. This will increasingly weigh on real economic growth and financial asset valuations. Finally, the financial industry as a whole has continued to generally lend, and secondary markets, both for credit and equities, are raising capital. This is obviously a good thing, but we see it as potentially likely to change quicker than past cycles if growth decelerates faster than expected, given how high financing costs are currently and uncertainty over legacy asset valuation, especially in commercial real estate. The bottom line is, yes, the financial system has higher levels of capital and has been building loan loss reserves. Still, the current tighter regulations and reduced risk tolerance may weaken any backstop that consumers and businesses may need from lenders if growth suddenly drops.

*Both the U.S. and global credit impulse has increasingly grown negative

*The annual change in M2 is -3.6%

*Small banks continue to lend, but this could change quickly given the questionable strength of their balance sheets

*Bank lending is expected to continue to contract, given the trend in tighter lending standards

*Tight bank lending standards indicate high recession odds.
Specific to the consumer, these higher financing costs and tighter availability are driving a falling demand for big-ticket items, even as perceived access to credit has not deteriorated, as seen in the week’s NY Fed Survey of Consumer Expectations. The good news is that revolving credit, when adjusted for inflation, is only now starting to push above pre-pandemic levels. Still, delinquency levels are rising, especially for lower-income borrowers. It is precisely this reluctance or inability to take on more debt, either through revolving or nonrevolving credit, which brings into question whether the resilience of the consumer, which was attributed to high savings (which are running down) and a tight job market (which is now loosening), can continue at the above-trend pace seen throughout this year so far. Further, the resumption of college debt payments, which still has an unclear weight on growth, and a lack of use of home equity lines due to the high costs (despite high levels of untapped equity) further reduce available aggregate disposable income. All in all, the negative credit backdrop, when coupled with greater anxiety from the geopolitical backdrop, the coming election, and the sense that a recession is coming (but uncertainty over when and how bad it will be), has consumers not wanting to increase their leverage and weaken their household balance sheets. Although this is a structurally good thing, it is also a drag on current growth. Target CEO Brian Cornell said it best in the company's Q3 earnings call. "They're managing that budget really carefully. And it certainly pressures discretionary spending. They're buying less stuff, even within food and beverage... Over the last few quarters, the volume of items they're buying has been declining… But in discretionary goods, we've seen seven consecutive quarters of both dollars and units declining. So you're buying less apparel, less items for your home, fewer toys."

*It’s a two-sided story, with credit availability and demand all worsening

*Higher rates are starting to matter for many borrowers

*The delinquency picture is mixed, but small banks’ credit card delinquency rates hit a multi-decade high due to the lower credit worthiness of their borrowers
Finally, the big unknown is still just how the cumulative effects of tighter policy, manifested through tighter financial and credit conditions, will ultimately play out on the real economy. The uniqueness of the pandemic, the fiscal and monetary response, and the current global backdrop make predicting the lagged effects of the Fed’s restrictive policy a fool's errand in many ways. We continue to be surprised by the resilience of the economy. However, more timely data indicates a cooling in consumer activity is currently occurring while business investment intentions have begun to contract more notably. PMI surveys for both services and manufacturing at the national and regional levels show a mixed picture that tends to average out to a more neutral to below-trend growth rate period, albeit these surveys have had poor predictive power on actual economic activity. As a result, domestic final demand may not be in imminent danger of going negative, but it is certainly looking to weigh on labor markets more notably moving forward. As labor markets go, so will the consumer, with the strength there being the last counterweight to the inflationary drag on sentiment. Of course, there are positive signs on the inflation front, with the declines in gas prices supporting holiday discretionary spending. However, we are not near prices returning to pre-pandemic levels, which weighs on consumer confidence. But again, our eye will be on labor markets with an expectation for a continued cooling there over the next several quarters. We will conclude with a quote from KeyCorp Bank CEO Andrew Pain, who said, “It's interesting, this economy, as we all know, is different than anything that any of us have experienced in our careers. And for the most part, our clients are saying, our business is great, but we really don't -- don't understand what's going on around us."

*Despite recent disinflationary gains, the consumer remains shell-shocked from the post-pandemic inflationary experience

*Is the financial system going to step in if consumers and business finally increase their demand for credit?
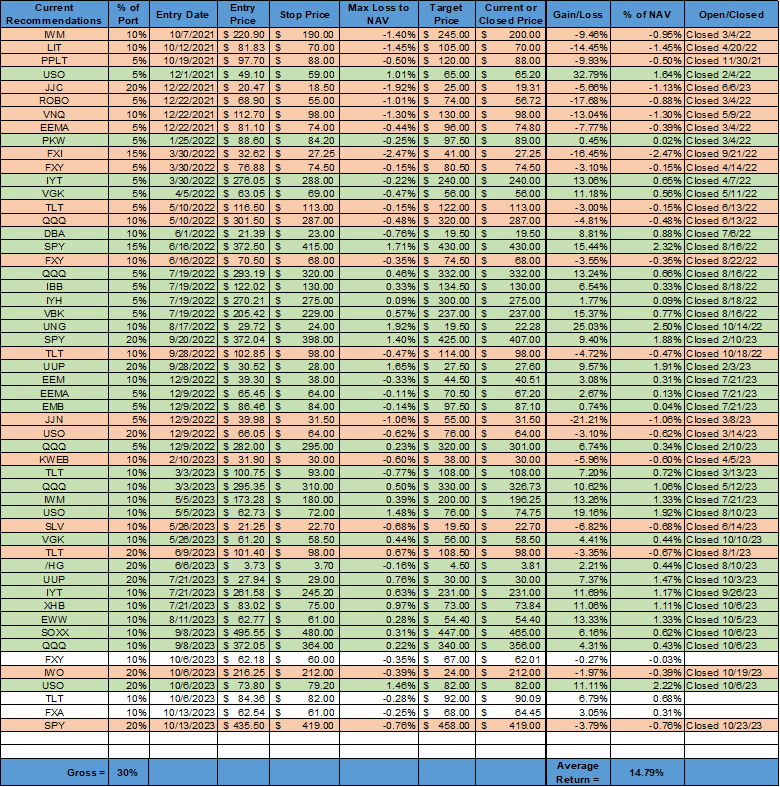
*No additions or changes to our mock portfolio. We may have missed a year-end rally but prudently do not want to chase risk here
As always, thank you for reading, and please share our newsletter. We will be off next week for the holiday. Please feel free to reach out with any questions or comments. - Michael Ball, CFA, FRM
Policy Talk:
There were a number of Fed officials again speaking in various forms this week. In general, the most recent CPI report provided further evidence that a disinflationary process was intact and policy was in an appropriate place, reducing the likelihood of a further hike. Vice Chair Jefferson spoke at the “Global Risk, Uncertainty, and Volatility” Research Conference in Zurich, where he gave a speech regarding how he looks at uncertainty and its effect on economic activity. He concluded that monetary policy needs to be a positive force in stabilizing expectations, requiring predictable and transparent policy action and communication. He did not discuss his economic or policy outlook. Jefferson, along with Governors Cook and Kugler replied to a request from GOP Senators that it is unclear how much further the Fed’s balance sheet would fall, but there was no imminent end. "The size of our balance sheet ultimately will depend on the public's demand for our liabilities, particularly currency, and reserves, and we cannot specify in advance what that demand will be; we are not targeting any particular dollar value for our balance sheet," Jefferson wrote in a letter to Republican U.S. Senator Rick Scott.

Governor Cook gave prepared remarks at the “Global Linkages in a Post-Pandemic World” 2023 Asia Economic Policy Conference in San Francisco this week. She believes a soft landing is still possible but noted increased pressure and “strains” in some sectors due to tighter financial conditions, citing lower levels of savings among lower-income households, higher borrowing and reduced access to credit for small businesses, and slowing demand in the housing sector. Chicago Fed President Goolsbee spoke at the Detroit Economic Club on the economy and monetary policy. He reiterated his belief that the “golden path” was still possible, as he forecasted a significant one-year drop in inflation while unemployment wouldn’t rise above 4%. He noted that he was surprised by how strong labor force participation was, and when coupled with improving productivity, would allow for stronger economic growth without added inflationary pressures. Cleveland Fed President Mester said she thinks policy is in a good spot following the most recent CPI report in an interview on CNBC. “We’re going to have to see much more evidence that inflation is on that timely path back to 2%. But we do have really good evidence that it has made progress and now it’s just, is it continuing?” she said. Vice Chair for Supervision Barr spoke at the U.S. Treasury Market Conference, where he spoke about the need for banks to have prudent interest rate management practices and the risks inherent in liquidity and leverage in the Treasury market. NY Fed President Williams also spoke at the conference but did not give remarks about his views on the economy or policy.

The NY Fed’s October Survey of Consumer Expectations Report showed that inflation expectations declined slightly at the short- and longer-term horizons while remaining unchanged at the medium-term horizon. Labor market expectations and household expectations of future income and spending growth were largely stable. One-year ahead, inflation expectations decreased to 3.6% in October from 3.7% in September. Year-ahead inflation expectations remained unchanged for rent (9.1%) and food (5.6%), while they increased for gas (+0.2 percentage point to 5.0%), college education (+0.2 percentage point to 6.0%), and medical care (+0.3 percentage point to 9.1%). Median inflation expectations for the three-year horizon were unchanged at 3%, while the five-year horizon decreased to 2.7% from 2.8% in the prior month. Inflation uncertainty increased slightly at the one-year ahead horizon, remained unchanged at the three-year ahead horizon, and declined at the five-year ahead horizon. Earnings growth expectations declined to 2.8%, the bottom of its two-year range. Respondents decreased expectations of higher unemployment rates a year ahead and increased their views on finding a job. At the same time, the perceived probability of losing one’s job in the next year increased slightly, while voluntarily leaving one's job was unchanged. Expected growth in household income increased slightly, remaining above pre-pandemic levels, while household spending expectations were unchanged at 5.3%, off recent highs but still above pre-pandemic levels. Perceived credit access slightly improved, while future expectations of obtaining credit worsened slightly. Expected levels of interest rates fell, as did the perceived probability that stock prices would be higher in a year.
Key Takeaways: The improvement in inflation expectation at the one-year ahead horizon countered the notable uptick registered by the University of Michigan Consumer Sentiment report on Friday, especially with rent expectations unchanged. Otherwise, views on labor markets and household finances remained generally unchanged on aggregate and within recent ranges. As is often the case, there were conflicting movements in readings, resulting in no clear negative or positive trends. Interestingly, respondents seem to believe interest rates have peaked (for savings accounts) and had the most bearish views on U.S. stocks since October 2022.

*Inflation expectations fell for one year ahead and remain range bound for three years ahead

*Spending expectations have been relatively stable and still well above pre-pandemic levels
U.S. Economic Data:
The headline consumer price index was unchanged in October after rising 0.4% in September and compared with market expectations of a 0.1% increase. This moved the annual rate to 3.2%, down from 3.7%. Core CPI increased by 0.2% on the month, slowing from a 0.3% rise in September and below market expectations of a 0.3% MoM rise. The annual core rate is now 4%, falling slightly from 4.1% in September. Energy prices declined by -2.5% MoM, driven by a -5% MoM decrease in gasoline prices, while energy services rose by 0.5% MoM. Food costs increased by 0.3% MoM, with Food at Home higher by 0.3% MoM (vs. 0.1% in Sept) and Food Away From Home increasing by 0.4%, the same as September. Increases in Shelter costs decelerated to 0.3% MoM (vs. 0.6% MoM), driven by declines in Rent on Shelter (0.3% MoM vs. 0.6% Mom), especially Lodging Away From Home (-2.5% MoM vs. 3.7%), while Owners Equivalent Rent (0.4% MoM and 0.6% MoM) decelerated by less. New Vehicles (1.9% MoM vs. 0.1% MoM) rose sharply. However, this was offset by large declines in Used Cars (-7.1% MoM vs. -0.8% MoM). Apparel (0.1% MoM vs. -0.8%) was flat, while Household Furnishings (-0.2% MoM vs. -0.3% MoM) prices declined for a second month. Medical Care Service costs were unchanged at 0.3% MoM. Transportation Service (0.8% MoM vs. 0.7% MoM) increased mainly due to rises in Insurance Costs (1.9% MoM vs. 1.3% MoM) again. Finally, Recreational Services (0.1% MoM vs. 0.5%) cooled due to declines in video streaming costs. The Cleveland Fed’s Median CPI rose by 0.3% in October versus 0.5% in the prior month, moving the annual rate lower to 5.3%, while the Trimmed-Mean CPI measure rose by 0.2% MoM, following a 0.4% rise in September, and decreasing the annual rate to 4.1%. The Atlanta Fed’s sticky-price CPI declined to 4.3% in October, declining from 5.5% in September, while on a core basis, the rate declined to 4.3%. The flexible cut index decreased by -8% on an annualized basis and is down -0.3% on an annual basis.
Key Takeaways: The October CPI report showed a gradual disinflationary process is still underway. The report had several special factors that influenced the lower-than-expected increase in the core readings, and we suspect a giveback will occur next month. However, it is what it is, and the markets traded it accordingly. On top of improvements in the Clevland and Atlanta Fed measures, the breadth of price increases improved, with 36% of the “detailed components” increasing at a rate faster than 5% YoY in October (down from 40% in September and an average of 59% in 2022, but above the 2017-19 average of 27%). The CPI data furthers the case that the Fed is no longer likely to hike rates in the near future as disinflation continues. However, more progress will be needed for the reduced market-derived time currently seen in Fed funds futures to materialize in the next set of FOMC SEPs.

*Further progress was made in October’s report, with a notable decline in the annual headline rate due to lower energy costs

*Services, due to shelter, continue to be the largest contributor to monthly gains, although auto insurance increases notably contributed too

*The increase in the “supercore” rate came in much lower than expected, giving the Fed greater confidence that a disinflationary process is intact

*Annualized three and six-month annualized averages diverged recently but are generally trending lower and are below the annual rate

*The Atlanta Fed Stickey-Price CPI fell on the month after firming in the prior
The Producer Price Index declined by -0.5% in October, following a 0.4% increase in September and market expectations of a 0.1% increase. The price for final demand goods decreased by -1.4% MoM, driven by declines in energy, which fell by -6.5%, thanks to a 15.3% decline in gasoline prices. Final demand food prices decreased by -0.2% MoM, and core goods increased by 0.1% MoM. Prices for final demand services were unchanged in October, with transportation and warehousing increasing by 1.5% MoM, driven higher by a 3.1% rise in airline services and offsetting decreases of -0.7% MoM in trade services and a flat reading of other services. Within intermediate demand in October, prices for processed goods fell by -0.9% MoM, while unprocessed goods declined by 1.4% MoM, and prices for services were unchanged.
Key Takeaways: The October decline is the largest decrease in final demand prices since a 1.2% drop in April 2020, with 80% of the decline driven by decreased fuel prices, mainly gasoline. There was also a -12% decline in diesel costs in processed goods, driving 70% of the declines there. Outside of energy, food and services were little changed, with rises in final and intermediate transportation costs offsetting declines elsewhere. As a result, the core PPI rate edged up slightly but indicated muted pipeline inflationary pressures. Further, final demand trade margins declined, but intermediate trade margins rose, giving a mixed picture of pricing power. This was a positive report for Fed officials who may have been recently worried by the firming of PPI price readings in the fall.

*October’s PPI was all about falling energy costs

*After accelerating into the fall, core PPI monthly change dropped back to a more Fed-friendly level

*Trade service margins again dropped in October, indicating reduced pricing power from wholesalers
Import prices declined by -0.8% in October, following an upwardly revised 0.4% increase in September and missing market expectations of a -0.3% decrease. This moved the annual rate to -2% YoY from -1.5% YoY in the prior month. Prices for imported fuel declined by -6.3% MoM, with petroleum prices declining by 6.5% and natural gas prices decreasing by 5.3% after increasing by 6.3% in the prior month. Nonfuel imports declined by -0.2% MoM, with decreases in industrial supplies, capital goods, “foods, feeds, and beverages,” and consumer goods offsetting higher prices for automotive vehicles. Export prices declined by -1.1% in October, more than market expectations of a -0.5% MoM decrease and following a 0.5% increase in September. Prices for agricultural exports declined by -1.1% MoM as lower prices for soybeans more than offset higher prices for corn and meat. Prices for nonagricultural exports fell by -1% MoM, the most since May 2023, as lower prices for nonagricultural industrial supplies and materials, consumer goods, and nonagricultural foods more than offset higher prices for capital goods and automotive vehicles. On an annual basis, export prices have declined by -4.9%.
Key Takeaways: It was the largest drop in import prices since March and export prices since May. Further, the declines were somewhat broad-based, although clearly driven by drops in energy and food prices, even as nonfuel imports were little changed, recording their third -0.2% MoM decline in a row. This was, however, mainly due to increases in autos, with the majority of other categories lower. Finally, even though September import prices were revised higher to 0.4% from 0.1%, the uptick in price pressures through this channel looks to have stopped a post-June trend higher that was likely giving Fed officials some pause on whether inflation was going to move lower meaningfully moving forward.

*Import prices dropped notably lower on the month due to large decreases in fuel costs

*Export prices saw broad declines across categories, althoug auto prices also rose here, as with imports
Retail sales decreased by -0.1% in October, following an increase of 0.9% in September and beating the market consensus of a larger -0.3% MoM decline. Excluding autos, retail sales were higher by 0.1% MoM, and core retail sales were higher by 0.2% MoM. Sales at furniture stores (-2.0% MoM) recorded the largest decrease in percentage terms, followed by miscellaneous stores (-1.7% MoM) and motor vehicle dealers (-1.0%). These declines were partially offset by rising sales at health and personal care stores (1.1%), food & beverage stores (0.6%), and electronics and appliances stores (0.6%). On a yearly basis, retail trade growth slowed to 2.5% in October from an upwardly revised 4.1% in September.
Key Takeaways: October’s slight decline ended a six-month streak of increases. Declines in autos weighed heavily on the overall reading and indicated that higher financing costs are deterring purchases. Further, declining prices at the pump resulted in less spending at gas stations. But even when excluding those categories, sales advanced by just 0.1% MoM after averaging a 0.6% MoM gain in the prior six months. However, expectations were for a worse reading, given spending data in October had weakened, and the NFIB sales sub-index dropped notably. Further, the likes of Walmart and Target have noted that consumers are pulling back from discretionary spending, so things look to be cooling. Finally, retail sales are not adjusted for inflation, so the disinflationary process will also reduce gains, especially on an annual comparable basis.

*Retail sales beat expectations, especially when adjusted for lower inflation over the month

*Gains and losses were mixed, with auto sales being a major detractor

*However, the core retail group that contributes to GDP was weaker on the month
The NFIB Small Business Optimism Index declined to 90.7 in October from 90.8 in September, beating forecasts of 90.5. Labor quality was the single most important problem for business owners, closely followed by inflation. The Optimism Index (90.7 vs. 90.8 in Sept) was little changed on the month, with a drop in soft components offsetting a rise in hard, while the Uncertainty Index (76 vs. 79) declined but is still trending higher.
Earnings, Sales, and Inventories: -17 of owners reported higher sales in the past three months, down 9 points from September, while expectations for higher real sales were -10%, higher by 3 points. Reports of positive profit trends was -32%, down 8 points from September. Among owners reporting lower profits, 32% blamed weaker sales, 21% blamed the rise in the cost of materials, and 14% cited labor costs. For owners reporting higher profits, 55% credited sales volumes, 20% cited usual seasonal change, and 7% cited higher selling prices. -6% of owners reported inventory gains, a decrease of 3 points. -3% of owners viewed current inventory stocks as “too low” in October, up 1 point from September. 0% of owners plan inventory investment in the coming months, up 1 point.

Labor and Compensation: 43% of owners reported job openings they couldn’t fill, with transportation, construction, and services sectors hardest hit. 61% reported hiring or trying to hire in October, unchanged from September, while 17% are planning to create new jobs in the next three months. 55% reported no qualified applicants for openings they had. 36% of owners reported raising compensation, unchanged since September, while 24% plan to raise compensation in the next three months, up slightly.

Capital Spending and Credit Markets: 56% of owners reported capital outlays in the last six months, unchanged from September. 37% reported spending on new equipment (down 4 points), 24% acquired vehicles (up 2 points), and 18% improved or expanded facilities (up 1 point). 24% plan capital outlays in the next few months, unchanged from September. 64% of owners said they were not interested in a loan, down 1 point. 7% reported their last loan was harder to get than in previous attempts, down 1 point. 22% of owners reported paying a higher rate on their most recent loan, down 4 points from September. The average rate paid on short-maturity loans was 9.1%, down 0.7 percentage points from last month’s highest reading since December 2006.

Inflation: 30% of owners reported raising average selling prices, an increase of 1 point from September. Unadjusted, 11% reported lower average selling prices, a decrease of 2 points on the month, and 39% reported higher average prices, also down 2 points. Price hikes were most frequent in finance, retail, construction, and transportation. 33% of owners plan price hikes, an increase of 3 points.
Key Takeaways: This was the lowest optimism reading since May, driven lower mainly by a decline in earnings trends, although changes to employment were also negative. Despite current negative earning sentiment, expected real sales moved higher, and views on expected credit conditions and whether it was a good time to expand also marginally improved. "Small businesses are still recovering, and owners are not optimistic about better business conditions. Small business owners are not growing their inventories as labor and energy costs are not falling, making it a gloomy outlook for the remainder of the year", said Bill Dunkelberg, the NFIB's chief economist. He reiterated that labor quality and poor availability continue to prevent owners from taking advantage of sales and growth opportunities. High levels of uncertainty continue to weigh on sentiment, creating a more negative view of the future economy. This, coupled with high financing costs, is reducing “needed’ investments to address labor supply problems that still persist in the current environment.

*The overall Optimism Index has been range-bound since last summer, but the notable drop in sales and earnings this month was significant

*Compensation changes continue to move sideways, indicating wage growth is slowing but still above pre-pandemic levels
Industrial production declined by -0.6% in October, following a 0.1% increase in September and more than market expectations of a -0.3% decrease. Manufacturing output, which accounts for 78% of total production, declined by -0.7% MoM following a 0.2% MoM increase in the prior month and more than forecasts of a -0.3% decrease. Materials fell by -0.6% MoM, following a 0.3% MoM increase last month. Utilities declined by -1.6% MoM, with both Electric (-1.8% MoM) and Natural Gas (-0.5% MoM) falling. Mining output increased by 0.4% MoM, following a flat reading last month. Among major market groups, Final Products decreased by -0.9% MoM, due to a large drop in Consumer Goods (-1.2% MoM), driven lower by Autos falling -10.3% MoM. Nondurables were little changed, although chemical products declined by -0.7% MoM, reversing 1.1% MoM gains in the prior month. Business Equipment declined by -0.5% MoM due to drops in Transit of -4.3% MoM. Nonindustrial Supplies (-0.2% MoM) were slightly lower, although Construction Supplies (0.2% MoM) increased marginally. Capacity utilization moved down 0.6 percentage point to 78.9% in October, a rate that is 0.8 percentage point below its long-run (1972–2022) average. Industrial Production declined by -0.7% on an annual basis in October.
Key Takeaways: Among manufacturing, motor vehicles, and parts posted the largest decline (10%) because it was affected by the UAW strikes at several major manufacturing plants. Among the major market groups, output was mixed, with the impact of strike action "exerting downward pressure on a number of categories," including the index for consumer durables, which fell 5.8%. "Industrial production was harder hit by the UAW strike than either we or the consensus anticipated," Oxford Economics lead US economist Bernard Yaros wrote in a note to clients.Overall, and even excluding the effects of the UAW strike, this was a weak report, indicating some notable slowing in the economy.

*Major declines in auto production, as well as broader weakness elsewhere, led to worse-than-expected declines in October’s report

*Capacity utilization continues to fall, although energy production continues to rise
Total business inventories increased by 0.4% in September, the same pace as in August and matching market forecasts. Inventories grew by more at retailers (0.9% vs 1% in August) versus Wholesalers (0.2% vs. -0.1%) and Manufacturers (0.2% vs 0.3%). On an annual basis, business inventories are higher by 1.3%. Total business sales were higher by 1.1%, with Wholesalers (2.2% MoM vs. 2%) driving the gains and Manufacturers (0.4% MoM vs. 1.3% MoM) and Retailers (0.8% MoM vs. 0.8% MoM) rose by less. The total inventory/sales ratio was little changed at 1.36.
Key Takeaways: Inventory levels continue to trend lower as a percentage of sales, indicating that firms are running leaner inventories into this holiday period. Growth in inventories came from end consumer-facing firms, as would be expected. Sales growth, though, shows that wholesalers are seeing a decent seasonal demand despite worries by end retailers that consumer demand might be weaker.

*The Inventory to Sales Ratio continues to trend lower, although it was little changed last month
Housing starts increased by 1.9% to a seasonally adjusted annual rate of 1.372 million in October, extending the 7% surge in the previous month. Single-family starts increased by 0.2% MoM to 970K, while multi-units jumped by 4.9% MoM to 382K. Starts increased in the Midwest (28.4%) and in the West (12.5%) but fell in the Northeast (-14.5%) and in the South (-6.8%). Building permits increased by 1.1% to a seasonally adjusted annual rate of 1.487 million in October, up from September's 1.471 million. Single-family authorizations rose by 0.5% MoM to 968K, reaching the highest since May 2022. Multi-unit permits increased by 2.2% MoM to a rate of 519K, rebounding from September's three-year low. There were increases in permits in the South (3.1%) and the Northeast (15.6%), while declines were reported in the West (-1.7%) and the Midwest (-10.6%).
Key Takeaway: The better-than-expected increase in starts in October, following September’s 3.1% increase (revised down from 7%), indicates that scarce supply is still driving construction plans despite higher financing costs. The backlog of homes being built has not meaningfully cleared, with units under construction are 35% above what the 2015-19 baseline would suggest. As a result, despite weaker homebuilder sentiment, residential construction activity should remain positive for the time being.

*Both starts and permits were higher, although each had regions of weakness

*Overall, the capacity to take on more construction may be stressed, given labor and land constraints, regardless of refinancing costs

*Although no longer rising, the housing pipeline is still historically high
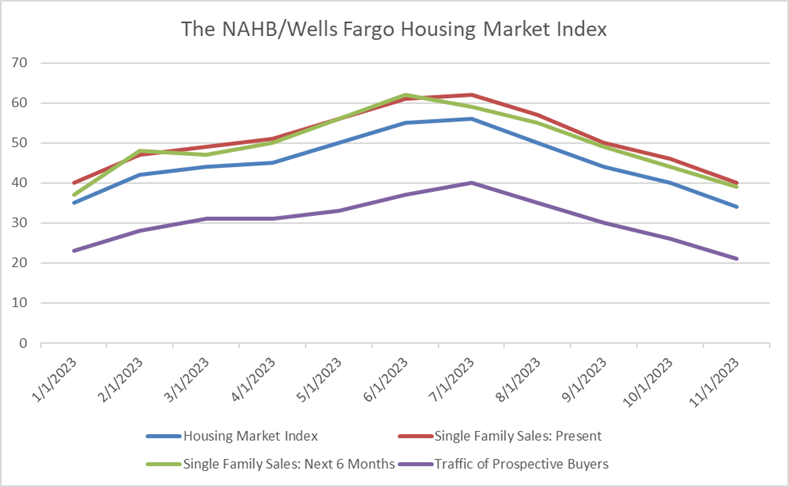
The NAHB/Wells Fargo Housing Market Index declined to 34 in November, declining from 40 in October, below the market's expected level of 40. The sub-index for current single-family home sales declined 6 points to 40. Further, the sub-index for expected home sales over the next six months declined by 5 points to 39, while the sub-index for prospective buyers declined 5 points to 21. Looking at the three-month moving averages for regional HMI scores, the Northeast fell one point to 49, the Midwest dropped three points to 36, the South fell seven points to 42, and the West posted a six-point decline to 35.
Key Takeaways: This marks the fourth consecutive month of declines, bringing the index to its lowest point since December 2022, due to the substantial impact of high mortgage rates on both builder confidence and consumer demand. “Higher short-term interest rates have increased the cost of financing for home builders and land developers, adding another headwind for housing supply in a market low on resale inventory,” said NAHB Chairman Alicia Huey. “While builder sentiment was down again in November, recent macroeconomic data point to improving conditions for home construction in the coming months,” said NAHB Chief Economist Robert Dietz. “In particular, the 10-year Treasury rate moved back to the 4.5% range for the first time since late September, which will help bring mortgage rates close to or below 7.5%. Given the lack of existing home inventory, somewhat lower mortgage rates will price-in housing demand and likely set the stage for improved builder views of market conditions in December,” he added. The NAHB is forecasting a 5% increase in single-family starts in 2024 as mortgage rates fall.
*The overall index and three sub-indexes continue to trend lower since peaking over the summer

*The Northeast is doing considerably better than the rest of the country
The NY Empire State Manufacturing Index rose to 9.1 in November from -4.6 in October, better than market forecasts of -2.8. Demand readings weakened while activity improved, as New Orders (-4.9 vs. -4.2) and Unfilled Orders (-23.2 vs. -19.1) both contracted at a faster pace. Shipments (10 vs. 1.4) jumped higher. Delivery Times (-6.1 vs. 6.4) were unchanged, continuing to shorten, while Inventories (9.1 vs. -2.1) moved back into expansionary territory. Price readings dropped marginally, with Prices Paid (22.2 vs. 25.5) and Prices Received (11.1 vs. 11.7) little changed on the month. Labor readings broadly declined, with the Number of Employees (-4.5 vs. 3.1) and Average Workweek (-3.8 vs. 2.2) both notably falling. The forward-looking general business conditions reading declined significantly, moving to a near-neutral reading. It was driven lower by drops in expected new orders, inventories, and number of employees. Future price expectations rose, especially for prices received. Capex and Tech spending intentions both fell and are now at near-neutral levels.
Key Takeaways: This was the highest reading since April, but at the sub-index level, the gains were more concentrated, with expansions in shipments and inventories driving the headline index increase while labor and demand measures contracted and price pressures were little changed. Further, forward-looking readings were notably negative for new orders and shipments, while flat investment intentions reinforced a -24 point drop in the forward general business activity index. This report, in its totality, does not bode too well for growth or the Fed, as it shows greater business pessimism and increased inflationary pressures are expected.

*The overall index indicated an expansionary backdrop for manufacturing in the second district, however, hiring activity contracted

*Current price readings moved sideways on the month, while six-month ahead expectations increased notably

*Expected Demand and Capex dropped notably, and this, along with other weaker outlook readings, drove the forward general business conditions index significantly lower
The NY Fed’s Business Leader Survey Index rose to -11.9 in November from -19.1 in October. Business Climate (-37.1 vs. -35.9) sentiment worsened slightly, continuing to trend lower. Labor readings cooled, with the Number of Employees (3.8 vs. 8.9) expanding at a reduced rate, while Wages (31.6 vs. 39.5) increased at a slower pace, with reading at the lower end of the pre-pandemic range. Price pressures firmed, with Prices Paid (55.1 vs. 53.8) and Prices Received (19.7 vs. 18.1) rising slightly and generally moving sideways since summer. Capital Spending (8.9 vs. 5.1) improved, expanding at a higher rate. Forward-looking indicators showed overall business activity as unchanged and near neutral, with expected business climate seen as better, hiring pace slower, and price pressures higher. Capex intentions also notably moved higher.
Key Takeaways: Despite the decline in activity, employment grew slightly while wage increases slowed. Input prices and selling prices increased at about the same pace as last month. Looking ahead, firms were still negative on their business climate outlook but also increased capex spending plans. Future wages and both price readings also increased, especially for forward prices paid. Overall, business activity in the service sector in the NY district continues to trend lower.

*Service activity ticked higher in November despite no improvement in the business climate

*Price pressures moved slightly higher and have trended sideways since the summer
The Philadelphia Fed Manufacturing Index increased to -5.9 in November from -9 in October, better than market forecasts of -9. Demand and Activity readings were mixed, with New Orders (1.3 vs. 4.4) expanding at a near-neutral rate, while Shipments (-17.9 vs. 10.8) notably declined into contractionary territory. Unfilled Orders (-9.8 vs. -168) improved but remained negative. Increases in Delivery Times (-8.7 vs. -21.4) readings, while still contracted, indicated a more normal level of shortening, which coincided with Inventories (-3.1 vs. -7) sentiment moving closer to neutral. Price pressures on aggregate fell due to a large decline in Prices Paid (14.8 vs. 23.1), while Prices Received (14.8 vs. 14.6) were little changed. Labor readings weakened, with the Number of Employees (0.8 vs. 4) moving to neutral and the Average Workweek (-11.4 vs. -4.3) contracting further. The six months ahead readings were also broadly negative. The demand outlook worsened. However, future shipment expectations jumped almost as much as current shipment readings fell. Price pressure and employment intentions all fell. Capex intentions did marginally improve back to a more neutral reading.
Key Takeaways: This is the index’s 16th negative reading in the past 18 months and despite the better-than-expected headline reading, it was a broadly negative report with the majority of current and forward sub-indexes contracting. Employment looks to now be steady, and price pressures are trending lower, with improvement in current margins due to the large drop in input prices. The large decrease in shipments is suspicious, given new orders remained expansionary and the backlog of orders contracted at a reduced rate. Add in the large jump in future shipment expectations, and the picture is a little off. The special question for the month asked firms to forecast price changes for their own pridcut and overall economy. Regarding their own prices over the next year, the firm’s forecast was an expected increase of 3%, down from 4% when this question was last asked in August. The firms reported an increase of 5% in their own prices over the past year, unchanged from last quarter. The firm’s forecast for the overall rate of inflation over the next year was 4% percent, unchanged from August. Over the long run, the firms’ median forecast for the 10-year average inflation rate was 3%, down from 3.5%.

*The current General Business Activity reading improved while the six months ahead weakened, with readings on shipments driving both

*Price and labor readings generally indicated contraction, while New Orders remained expansionary
Kansas Fed Composite Index increased to -2 points in November from -8 points in October. Demand and activity measures generally improved but still signaled weak growth. New Orders (0 vs. -22) recovered to a neutral reading, while the Backlog of Orders (-12 vs. -13) contracted at a slightly slower rate. New Orders of Exports (-4 vs. -8) also contracted at a reduced rate. Shipments (5 vs. -11) moved back into expansionary territory, while Production (-3 vs -8) moved closer to neutral. Supplier Delivery Times (-5 vs. -4) shortened at a slightly faster pace, and Inventories for Materials and Finished Goods both remained at neutral. Labor readings were split, with the Number of Employees (-3 vs. -4) improving slightly, while the Average Work Week (-4 vs. 0) moved into contraction. Price readings were mixed, with Prices Received (-3 vs. 0) contracting, while Prices Paid (7 vs. -2) moved back into expansionary territory. Six-month-ahead readings were more mixed, with the general composite index remaining near neutral. Expected activity measures were mixed while demand readings increased. Forward price readings jumped, while labor needs are forecasted to cool.
Key Takeaways: The report indicated a broader improvement in current readings, although absolute levels still indicate a near-neutral growth level for manufacturers in the KC district. There was a significant jump in forward price and this somewhat aligned with the expected uptick in demand, indicating a more neutral to positive outlook when coupled with the negative future capex reading. The special question indicated a lack of qualified workers still hampered growth.

*The overall index moved to a more neutral reading after sitting in contractionary territory thesee past two months

*Both current and expected new orders jumped higher

*The current readings were broadly more positive on the month
Technicals, Positioning, and Charts:
The Russell outperformed the S&P and Nasdaq on the week. Real Estate, Materials, and Consumer Discretionary were the best-performing sectors, while Small-Caps, Value, and High Dividend Yields were the best-performing factors.

@Koyfin
S&P optionality strike levels have the Zero-Gamma Level at 4415 while the Call Wall is 4550 and the Put Wall is 4200.

@spotgamma
S&P technical levels have support at 4520, then 4485, with resistance at 4535, then 4566.
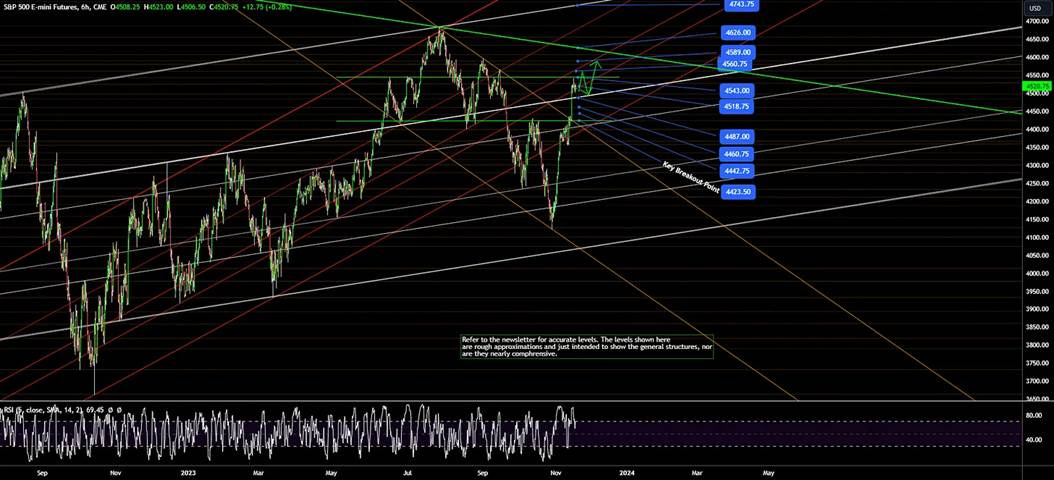
@AdamMancini4
Treasuries are mixed on the day, with the 10yr yield unchanged at 4.44%, while the 5s30s curve is flatter by 5.5bp on the session, moving to 14bps.

Four Key Macro House Charts:

Growth/Value Ratio: Value is higher on the week, with Small-Cap Value the best-performing size/factor on the week.

Chinese Iron Ore Future Price: Iron Ore futures are higher on the week.

5yr-30yr Treasury Spread: The curve is flatter on the week.

EUR/JPY FX Cross: The Euro is stronger on the week.
Other Charts:

The S&P, Dow Jones, and Nasdaq, through their respective ETFs, have almost reversed their YTD drawdown.

Retail Investor and investment manager sentiment has shot up over the last few weeks.

Large caps continue to see positve inflows over the last several weeks.

Further, there have been notable increases in call buying on small caps.
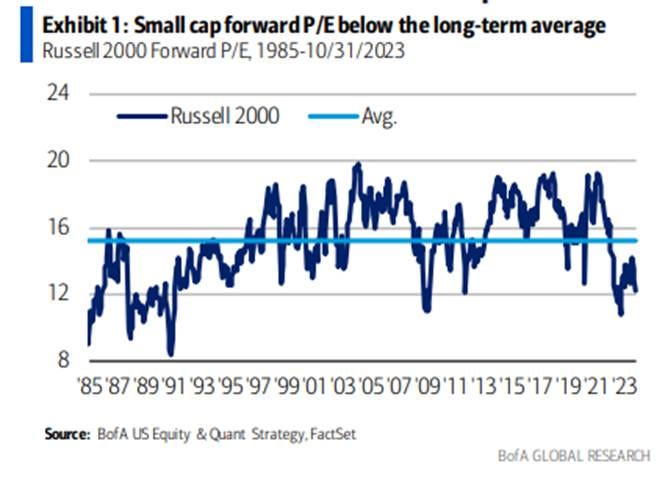
This may be due to a belief that small caps are cheap, with Russell 2000 forward P/E falling to a 14-month low recently, and will see a normalization in their valuation ratio to large caps ratio if the the Fed is done and we get a soft landing scenario.

Analyst have downgraded their fourth-quarter earnings expectation after weaker-than-expected third-quarter earnings season guidance and worries over economic growth.
However, Goldman Sachs says investors are overly concerned about the weakening outlook for US corporate earnings.

Instead, Goldman expects the S&P to have modest gains next year, with strong earnings growth, and improving multiples.
Articles by Macro Themes:
Medium-term Themes:
China’s Post-Pandemic Life:
Helicopter Money: China plans to provide at least 1 trillion yuan ($137 billion) of low-cost financing to the nation’s urban village renovation and affordable housing programs in its latest effort to shore up the struggling property market. The People’s Bank of China would inject funds in phases through policy banks, with the money ultimately trickling down to households for home purchases. Officials are considering options, including the so-called Pledged Supplemental Lending and special loans. The plan, part of a new initiative by Vice Premier He Lifeng, would mark a major step-up in authorities’ efforts to put a floor under the biggest property downturn in decades. Dubbed by some as “helicopter money,” PSL allows the central bank to provide low-cost funds through policy and commercial lenders to the developers of the shantytown renovation projects. - China Mulls $137 Billion of New Funds to Aid Housing Market – Bloomberg

Subsidizing Exports: Some Chinese factories, saddled with overcapacity in a struggling economy, are trying to export their way out of trouble and stoking new trade tensions in the process. Makers of electric vehicles, solar panels, and other products are cutting prices and trying harder to muscle into overseas markets as they face weakened demand at home, upsetting competitors who see threats to their bottom lines. The tensions are most acute in Europe, where European Union regulators in September unveiled an antisubsidy probe, reflecting concern that China is flooding the region with low-cost electric vehicles. Prices of goods shipped from China have fallen around 20% this year, according to ABN AMRO. While some of that drop reflects easing supply-chain bottlenecks, it is also a sign that Chinese sellers are discounting to preserve or expand market share during a period of weaker global demand, according to economists. - China Is Making Too Much Stuff—and Other Countries Are Worried – WSJ

Zig Zag: China’s consumption rebound slowed, and private business confidence lost momentum in October, according to independent surveys and alternative data that suggested the economic recovery remains bumpy. An indicator of Chinese consumer demand for recreation and transport published by Paris-based QuantCube Technology, along with an independent survey of consumer sentiment by US company Morning Consult, both fell in October from the previous month. A poll of private business sentiment from the Cheung Kong Graduate School of Business also declined in the month. Those measures, together with official data showing weak service sector growth and falling consumer prices in October, imply the nation’s consumption rebound struggled last month, even as Beijing announced more fiscal stimulus. China’s leaders in July warned the world’s second-largest economy is following a pattern where short growth upturns are followed by downturns. - China’s Consumption Recovery Is Losing Momentum, Data Show – Bloomberg

Longer-term Themes:
Cyber Life and Digital Rights:
Founding Fathers: A key group of bipartisan lawmakers introduced their blueprint for renewing a controversial surveillance tool before it expires at the end of the year. The bill marks the first piece of legislation that lawmakers have introduced in the year-long battle to reauthorize Section 702 of the Foreign Intelligence Surveillance Act (FISA). Intelligence officials have warned that its expiration would impede investigations into ransomware, terrorism, and other online crimes. FISA Section 702 allows intelligence agencies to conduct warrantless surveillance of non-American citizens outside the U.S. during investigations. But some privacy hawks, progressives, and conservatives have expressed concerns about how the program inadvertently collects texts, emails and other communications from U.S. citizens who are talking to foreigners abroad. The information collected through Section 702 requests is stored for several years in a searchable database that intelligence agencies can later access in other investigations. - Lawmakers unveil first bill to renew controversial surveillance program – Axios
")
Course Change: The future of U.S. global digital policy hangs in the balance following a shock decision by the office of the United States Trade Representative (USTR) that the United States no longer supports provisions that protect cross-border data flows, prohibit forced data localization, safeguard source code, and prohibit countries from discriminating against digital products in the World Trade Organization (WTO). The USTR’s previous position allows data to flow freely, with restrictions as the exception, in contrast to China’s position that seeks stricter control and oversight based on local law and regulation before allowing data to flow. While the difference between the two positions may have seemed rather technical, it served as the foundation for U.S. government support for an open Internet and digital economy. The announcement took many members of Congress, other parts of the Biden administration, and many of the U.S.’s closest trading and digital policy partners by surprise. - China Gains as U.S. Abandons Digital Policy Negotiations - Lawfare

Energy’s Midlife Crisis:
Next-Gen: Senators Mark Warner (D-VA) and Joe Manchin (D-WV) wrote a letter to Secretary of Energy Jennifer Granholm last week detailing the need for the U.S. to establish its leadership in the research, development, production, and manufacturing of new battery technologies. They wrote that the U.S. is “ten to twenty years behind Asia in commercialization of battery technology” and noted that China accounts for more than 75% of battery cell production. The letter said, “it is critical that the U.S. lead in next-generation battery technology and alternative chemistries” and urged the Department of Energy to coordinate with the Department of Defense and other national security agencies “to support procurement of innovative, U.S.-developed energy storage technologies.” The letter noted in 2022 the United States produced less than 10% of lithium-ion batteries in 2022 and said demand is expected to grow over seven times by 2035. The letter wants a committee briefing by Dec. 1 "on ongoing research and development of next-generation battery technologies." - Senators urge US to take steps to boost battery production, citing China - Reuters
 at a factory in Huzhou")
Authoritarianism in Trouble?:
Bespoke Realities: Creating and disseminating convincing propaganda used to require the resources of a state. Now all it takes is a smartphone. Generative artificial intelligence can now create fake pictures, clones of our voices, and even videos depicting and distorting world events. The result: From our personal circles to the political circuses, everyone must now question whether what they see and hear is true. We’ve long been warned about the potential of social media to distort our view of the world, and now, there is the potential for more false and misleading information to spread on social media than ever before. Just as importantly, exposure to AI-generated fakes can make us question the authenticity of everything we see. Real images and real recordings can be dismissed as fake. “When you show people deepfakes and generative AI, a lot of times they come out of the experiment saying, ‘I just don’t trust anything anymore,’” says David Rand, a professor at MIT Sloan who studies the creation, spread, and impact of misinformation. - Is Anything Still True? On the Internet, No One Knows Anymore – WSJ

Cold Places (Deep Sea, Artic, and Space Colonization):
Redundant and Resilient: According to a top U.S. government cybersecurity official, the Ukrainian military’s ability to recover from the Russian attack on satellite company Viasat is an example of the need for redundant systems and resilient organizations. The cyberattack last February left Viasat’s KA-SAT modems inoperable in Ukraine. The attack had several other downstream effects, causing the malfunction of 5,800 Enercon wind turbines in Germany and disruptions to thousands of organizations across Europe. “Space is a horizontal dependency across every other critical sector. There is no sector that does not depend on space assets,” Eric Goldstein, executive director of cybersecurity at CISA, said. Later in the conversation, Goldstein warned that attacks on space infrastructure are now moving beyond nation-states and into the criminal realm. One of his concerns is that while it is fairly easy to sketch out the goals of nation-states, criminal organizations are more difficult to understand. - Ukrainian response to Viasat hack proves need for redundancy, resilience – The Record

Podcasts and Videos:
VIEWS EXPRESSED IN “CONTENT” ON THIS WEBSITE OR POSTED IN SOCIAL MEDIA AND OTHER PLATFORMS (COLLECTIVELY, “CONTENT DISTRIBUTION OUTLETS”) ARE MY OWN. THE POSTS ARE NOT DIRECTED TO ANY INVESTORS OR POTENTIAL INVESTORS AND DO NOT CONSTITUTE AN OFFER TO SELL -- OR A SOLICITATION OF AN OFFER TO BUY -- ANY SECURITIES AND MAY NOT BE USED OR RELIED UPON IN EVALUATING THE MERITS OF ANY INVESTMENT.
THE CONTENT SHOULD NOT BE CONSTRUED AS OR RELIED UPON IN ANY MANNER AS INVESTMENT, LEGAL, TAX, OR OTHER ADVICE. YOU SHOULD CONSULT YOUR OWN ADVISERS AS TO LEGAL, BUSINESS, TAX, AND OTHER RELATED MATTERS CONCERNING ANY INVESTMENT. ANY PROJECTIONS, ESTIMATES, FORECASTS, TARGETS, PROSPECTS AND/OR OPINIONS EXPRESSED IN THESE MATERIALS ARE SUBJECT TO CHANGE WITHOUT NOTICE AND MAY DIFFER OR BE CONTRARY TO OPINIONS EXPRESSED BY OTHERS. ANY CHARTS PROVIDED HERE ARE FOR INFORMATIONAL PURPOSES ONLY, AND SHOULD NOT BE RELIED UPON WHEN MAKING ANY INVESTMENT DECISION. CERTAIN INFORMATION CONTAINED IN HERE HAS BEEN OBTAINED FROM THIRD-PARTY SOURCES. WHILE TAKEN FROM SOURCES BELIEVED TO BE RELIABLE, I HAVE NOT INDEPENDENTLY VERIFIED SUCH INFORMATION AND MAKE NO REPRESENTATIONS ABOUT THE ENDURING ACCURACY OF THE INFORMATION. I MAY OR MAY NOT HAVE POSITIONS IN ANY STOCKS OR ASSET CLASSES MENTIONED. I HAVE NO AFFILIATION WITH ANY OF THE COMPANIES OTHER THAN EXPLICITLY MENTIONED.