


Rising Energy Costs Are a Real Dilemma for Central Banks at This Point in the Cycle - Midday Macro – 9/15/2023
Color on Markets, Economy, Policy, and Geopolitics

Rising Energy Costs Are a Real Dilemma for Central Banks at This Point in the Cycle
Midday Macro – 9/15/2023
Market’s Weekly Narrative and Headlines:
The S&P is lower on the week, down notably today after shaking off more sticky inflationary readings seen in this week’s CPI and PPI reports due to rising energy costs. It’s unclear if today’s large September OPEX helped drive the S&P lower to the 4500 level, where optionality gravity is strongest, or an increase in import/export prices, as well as a rebound in the NY Fed’s Manufacturing Survey and stable Industrial Production readings, led markets to acknowledge that higher inflation and persistent growth may force the Fed to hike rates in November or/and at least further signal their intention to keep rates “higher for longer” in next week’s new September FOMC SEPs. Conversely, September's most recent reading of consumer sentiment, although weaker, also showed reduced inflation expectations, with longer-term readings in danger of finally entering a more historical pre-pandemic range. Elsewhere this week, the ECB successfully orchestrated a dovish hike, reducing their growth outlook for 2024 and causing the Euro to fall and government bond yield curves to invert further. Treasuries had a quiet week despite the plethora of economic data and the ECB rate hike, with yields slightly higher and the curve little changed. Oil continued to rally, as the extension of output cuts by Saudi Arabia and Russia through year-end will notably increase the market deficit, while inventory levels in the U.S. climbed on the week but remain historically low. With implied gas demand lower and refinery runs up, there may be some relief at the pump soon, but not yet. Copper was higher on the week thanks to better-than-expected data out of China and a belief that stimulus measures are starting to bite a little more. The agg complex, on the whole, rose, with cattle going parabolic and other specific crops continued trends higher, while grains and beans moved sideways. The dollar rose on the week, with the $DXY now well above 105, thanks to the more dovish message by the ECB and continued growing rate differential expectations that favor the dollar over most major pairs.

Deeper Dive:
The story mainly remains the same in our view. Inflation is firming due to rises in energy costs, which, on a lagged basis, will move core readings and inflation expectations higher. This is on top of still generally resilient end demand, allowing firms to maintain some pricing power while input costs have reversed their disinflationary trends. As a result, there is a broader strength to recent inflationary readings despite August’s core CPI’s monthly change, mainly driven by transport cost increases, being relatively in line with expecations. Labor markets are loosening, but not yet convincingly, and as a result, growth is starting to show signs of slowing, but overall, it is decelerating from a “well-above-trend” level and not as evenly as hoped. The Fed must adjust its projections to reflect these developments in next week’s September FOMC’s new SEPs. This means there is a risk that one of the four forecasted 25bps cuts next year can come out, effectively keeping the policy stance at a more restrictive level as expected increases in the real effective Fed funds level do not materialize due to a firming in inflation while the growth outlook is upgraded. As a result, the ultimate restrictive stance of policy now looks to be at “higher for longer” level than previously forecasted in the June SEPs. This will be especially true if they raise rates again in November due to any further uptick in inflation and no notable deterioration in labor markets or growth more generally, which, in our opinion, is possible.

*Rises in energy costs will increase inflationary pressures elsewhere and lead to greater uncertainty in central bank forecasting

*The market shrugged off the higher-than-expected CPI report, but continued increases in headline energy readings could change that mentality

*There is a historically short time between the last rate hike and the first reduction. The median lag time is five months, according to Barclays economists who looked at 86 tightening and 87 loosening cycles in developed economies from 1960-2019.
The timing of the first rate cut in 2024 will need to move back if a November hike occurrs. The Fed will be hard-pressed to remove the forecasted “one more” hike this year in next week's new SEPs with the “totality” of the data not materially changing since June, and to maintain credibility, feel compelled to hike in November even if its a 50/50 call. Further, if a “cut and skip” approach was taken following the average half-year pause period between the last hike and first-rate cut, at best, the Fed could go in June, September, and then December next year. Of course, a lot can happen between now and then, but as it stands, it feels like equities are not positioned for this, and a factor/sector rotation in leadership would need to occur to reflect a higher front-end terminal rate duration and more extended inversion of the curve than expected. You throw in an international backdrop that still sees the majority of developed market central banks tightening (maintaining rates at a set level when inflation is falling is tightening) despite lower growth outlooks, as seen by the ECB this week, and the risk of a stagflationary macro backdrop is growing as long as oil rises. In our view, inflation continues to be a supply-side driven story with less policy sensitivity than in past episodes, while growth is increasingly feeling the effects of the cumulative policy tightening to date. This is currently true outside the U.S., and we do not subscribe to American exceptionalism, with Europe’s slowdown a likely precursor for what is coming here next year. In summary, higher oil prices and a reaccelerating China over the next year will be real problems for the global central bank community as may keep inflation above target for longer than forecasted despite weakening domestic final demand.

*Rate cut expectations have moved forward despite the “totality” of the data not materially leaning that way

*The ECB lowered its growth expectations notably for 2024, while slightly reducing its core inflation forecasts at this week’s meeting
Turning to our more tactical outlook, we believe stocks will push back to August lows quickly if the BoJ surprises the market with a more hawkish message next week in combination with our expectations for a “hawkish pause” from the Fed. In combination with all our “bearish” reasonings already communicated in posts over the last few weeks, we maintain our heavily short/defensive positioning in the newsletter’s mock portfolio. The macro headwinds continue to build as the effects of the global cumulative policy tightening cycle increasingly hit the real economy. We believe interest rate sensitivity grows with time as borrowers effectively “run out of time” and have to roll debt at new, more punitive levels (or default). On top of that, and specific to the U.S., we see a consumer running out of savings, having increased monthly bill payments either due to resummed payment on college debt or paying more for gas at the pump, while now facing a labor market that looks to be cooling. As a result, as we have said, resilience will turn to pragmatism and discretionary spending turns to staples. This will increasingly ripple through the entire economy, causing reduced confidence and investment and will not be offset by positive external factors from abroad. We do not yet forecast a notable recession but continue to believe a below period of growth is approaching and will negatively change the risk appetite narrative due to the inability of Fed policy to adjust as we advance into 2024 due to stickier inflation than previosuly envisioned.

*DB sees equity exposure as more neutral…

*With technology sector-specific positioning finally rolling over meaningfully

The mock portfolio’s weighted average return is now 9.52%, with today’s sell-off helping all our positons
Thank you for reading, and please share our newsletter. Feel free to reach out with any questions or comments. - Michael Ball, CFA, FRM
Policy Talk:
Fed Blackout Period This Week
U.S. Economic Data:
Consumer prices rose by 0.6% in August, after a 0.2% increase in July and in line with market expectations. This moved the headline annual rate to 3.7% from 3.2% in July. The energy index rose by 5.6% MoM, driven higher by increases in gasoline (10.6% vs. 0.2% in July), which was the largest contributor, accounting for over half of the headline increase. Meanwhile, food inflation was steady (at 0.2% MoM), as a softer increase in cost for food at home (0.2% MoM vs. 0.3% MoM) was offset by a further advance in prices of food away (0.3% MoM vs. 0.2% MoM). Core inflation rose by 0.3% in August, following a 0.2% increase in July, moving the annual rate to 4.3% from 4.7%. The shelter index (0.3% MoM vs. 0.4% MoM) slowed as owner’s equivalent rent (0.4% MoM) continued to slow, although rent (0.5% MoM vs. 0.4% MoM) slightly strengthened. “Supercore” CPI rose by close to 0.4% MoM, mainly due to increases in transportation service (2% MoM vs. 0.3% MoM) costs as airline fares rose by 4.9% MoM.
Key Takeaways: The disinflationary process lost steam in August due to increases in gas costs at the headline level, but more specific to what the Fed is watching, an increase in transportation costs, which saw core rise more than expected. Excluding energy and food prices, the inflation outlook is encouraging, and over the past three months, core inflation is now rising at a 2.4% annualized rate, the lowest since March 2021. However, gains in individual CPI components were more broad-based in August than in July, as 42% of the components rose at a 5% annualized pace or faster in the month versus 31% in July. The various Fed measures of underlying CPI inflation released in the hours following the official CPI released by regional Fed banks showed a mostly, but not entirely, encouraging picture of a gradually moderating pace of underlying price gains. The Cleveland Fed Trimmed Mean CPI slowed to 4.5% year-over-year in August from 4.8% in July, while the Cleveland Fed Median CPI slowed to 5.7% from 6.1%. The Atlanta Fed’s Sticky CPI moved lower to 5.3% in August from 5.6% in July year-over-year. However, on a three-month annualized basis, the Cleveland Fed Trimmed Mean CPI and Atlanta Fed Sticky CPI measures increased. Nonetheless, there remains a broad signal of slowing inflation momentum through these various Fed measures. Finally, due to the 0.6% MoM rise in headline inflation, real average hourly earnings fell by -0.5% in August, breaking this measure's five-month streak of rising real pay.

*Inflation generally continues to trend lower, but core services ex-housing continues to move sideways on an annual basis while it has picked up on a three-month annualized rate

*“Super-core” inflation picked up in August and, on a year-over-year basis, is moving sideways

*The Cleveland and Atlanta Fed’s various measures of cutting up CPI are still moving lower on an annual basis

*Improvements in the breadth of inflation continued to reverse in the last two months
Producer prices increased by 0.7% in August, following an increase of 0.4% in July, and exceeded market expectations of a 0.4% MoM rise. This moved the headline annual rate to 1.6% from 0.8% in July. Core PPI increased by 0.3% in July versus an upwardly revised 0.4% increase in July, moving the annual rate to 3%. Prices for goods rose by 2% MoM, driven by a 10.5% surge in energy costs. This compares to food prices declining by -0.5% MoM and non-energy/food goods rising by 0.1% MoM. On the other side, prices for services increased by 0.2% MoM due to a 1.4% MoM increase in transportation and warehousing costs, while trade fell by -0.3% MoM and “other” rose by 0.3% MoM. Processed goods rose by 2.1% MoM, from -0.3% YoY in July, due to a 12.1% MoM jump in processed energy goods, while unprocessed goods rose by 1.3% MoM from 2.4% in July, with “foodstuff and feedstuff” declining by -2.3% in August.
Key Takeaways: This was the highest monthly increase in PPI since June 2022. The rise in energy is becoming a problem, with over 60% of the 2% MoM rise in the price of final demand for goods due to a 20% jump in the price of gasoline. On the other side, food prices did fall by -0.5%, helped by a -11.5% decrease in fresh and dry vegetables. As a result, it is becoming a tale of two cities, with energy up and food down, while “other” core goods and services were relatively unchanged. Regarding services, a decline in trade service for intermediate demand showed reduced margin pressures and, in theory, less inflationary pressures in the service sector. Interestingly, prices for nonresidential real estate services rose by 2.9% on the month.

*Headline significantly rose due to increases in energy costs, while changes in core PPI were more subdued

*Increases in service costs in August’s PPI report were more subdued due to declines in trade and other categories, while transportation and warehousing rose

*On an annual basis, final demand for goods has again become a positive contributor

*Margins received by wholesalers and retailers continue to fall, now moving into negative territory on an annual basis
Import prices rose by 0.5% in August, accelerating from a 0.1% increase in July and exceeding the market forecast of a 0.3% MoM advance. On an annual basis, import prices are lower by -3.0%, falling from a revised -4.6% decline in July. The larger-than-expected increase was driven by a 6.7% MoM jump in fuel prices, which was the largest monthly increase since March 2022. Prices for imported oil rose by 6.5% MoM (vs. 1.9% in July), and those for natural gas rose by 19.1% MoM (vs. 13.7%). Prices for nonfuel imports fell by -0.1% MoM for the second consecutive month, as lower prices for industrial supplies and materials, capital goods, and automotive vehicles more than offset higher prices for foods, feeds, and beverages & consumer goods. Export prices rose 1.3% in August, following a downwardly revised 0.5% increase in July and beating market expectations of a 0.4% MoM advance. On an annual basis, export prices fell by -5.5%, compared with a -8% YoY decrease in July. Prices rose notably for non-agricultural exports (1.7% MoM) due to increases in industrial supplies and materials (4.2% MoM) and Fuels and Lubricants (8.5%). On the other hand, prices decreased by -2.2% for agricultural exports as stronger production worldwide lowered costs for soybeans, corn, wheat, and nuts.
Key Takeaways: The third inflation report for the week was also heavily influenced by rising energy prices. However, July's 0.4% MoM increase was revised lower to 0.1%. When excluding the rise in oil prices, import prices were flat on the month. On the other side, declines in food export prices due to higher-than-expected supplies do bode well for reducing global inflation worries. As seen in the PPI report this week, there is a notable divergence between energy and food, while core readings were little changed. How long this lasts and how central bank policymakers view the lagged effects of increased energy costs on the rest of goods and service prices will be highly debated.

*It looks like declines in import prices bottomed in June, with a notable uptick this month due to increases in energy costs

*Export prices also rose notably on the month despite declines in agricultural goods
Retail sales increased by 0.6% in August, higher than a downwardly revised 0.5% rise in July and beating forecasts of a 0.2% MoM advance. Core retail sales, or sales excluding autos, gas, building materials, and food services, edged up 0.1% MoM. Sales at gasoline stations rose by 5.2% on the month, as gasoline prices rose by around 10%. Increases in the rate of monthly spending were seen in electronics & appliances (0.7% MoM vs. -1.1% MoM), health & personal care (0.5% MoM vs. 0.1% MoM), motor vehicle & parts dealers (0.3% MoM vs. -0.4%). In comparison, still positive but slowing growth was seen in food services & drinking places (0.3% MoM vs. 0.8% MoM), food & beverages (0.4% MoM vs. 0.7% MoM), general merchandise stores (0.3% MoM vs. 0.8% MoM), and building material & garden equipment (0.1% MoM vs. 0.2% MoM). On the other hand, sales were flat at nonstore retailers and fell at sporting goods, hobby, musical instrument, & book stores (-1.6% MoM vs. 1.7% MoM), miscellaneous store retailers (-1.3% MoM vs. -1% MoM), and furniture stores (-1% MoM vs. -1.9%).
Key Takeaways: Despite the headline beat due to the price effects of higher gasoline prices on sales, the overall tone of the August retail sales report and revisions to July showed a cooling in consumer spending. As a result, the Atlanta Fed’s GDPNowcast was revised notably lower. Stepping back, when adjusting for inflation, real retail sales continue to be lower on the year, potentially by as much as -2%, versus nominal retail sales being higher by 1.6%, which is still below a 4.7% historical average. The U.S. consumer is not as strong as the common narrative makes out.

*The retail control group was relatively unchanged on the month, while rises in gas prices supported the headline reading rising by 0.6% MoM

*Very few subcomponents accelerated on the month, with most still remaining positive but cooling
Industrial production rose by 0.4% in August, following a downwardly revised 0.7% increase in July and above market expectations of 0.1%. Manufacturing output was little changed, rising by 0.1% MoM, following a 0.4% gain in July. Durable goods production rose by 0.1% MoM, while nondurable manufacturing increased by 0.2% MoM. Consumer goods production fell by -0.2% MoM, slowing from the 1.2% MoM increase seen in July. Business Equipment production rose by 0.8% MoM, following up on strong gains of 0.9% seen in July. Mining output rose by 1.4% MoM, and the output of utilities rose by 0.9% MoM. Capacity utilization increased to 79.7% in August from 79.5% in July.
Key Takeaways: Total industrial production is relatively flat annually, higher by 0.2% YoY and, in real terms, lower. Auto production has been erratic over the last three months and is likely to fall more sharply due to the UAW strikes next month. It is also unlikely business equipment will continue to see the gains they have experienced due to slowing Capex intentions. Meanwhile, the output of defense-related goods continued to increase as manufacturers met demands from the war in Ukraine. Industrial production of defense and space equipment increased another 3.5% in August, the largest gain since May 2020.

*Manufacturing activity was relatively flat on the month, while increases in business equipment, defense, and mining supported the overall IP index

*Declines in auto production are likely to worsen, but excluding auto, August saw a more positive picture
The NFIB Small Business Optimism Index decreased to 91.3 in August from 91.9 in July, below market expectations of 91.6. The quality of labor (24%) and inflation (23%) were the most frequently reported “single most important” business problem.
Sales: Owners expecting better business conditions over the next six months deteriorated by 7 points from July to a net -37%, with poor economic conditions being cited as the primary reason, followed by high-interest rates and a poor political climate. A net -25% of owners reported higher actual earnings in the last three months, an increase of five points, while -14% of owners expect real sales to be higher in six months, a decrease of 2 points from July.
Inventories: Owners reported a further decrease in inventories in August, with “increase” minus “decrease” moving to a net -7% from -3% in July. This was supported by more businesses reporting current inventory levels as “too high” versus “too low.” Respondents had a net neutral view of where their inventories would move in the next six months.
Inflation: A net 27% of owners raised average selling prices over the last three months, an increase of two points, while 30% plan to raise them in the next six months, an increase of 2.
Labor: Owners reported a -4% net change in employment, indicating the negative trend in actual hiring since April continues. A net 40% of owners reported having openings they could not fill, down slightly, but small businesses still suffer from a lack of qualified workers. Plans to fill open positions remain elevated, with a net 17% planning to create new jobs, with manufacturing, services, and construction having the largest amount of openings, while openings are lowest in transportation and financial services. Actual compensation changes fell two points to a net 36% of owners reporting increases over the last three months, while plans to raise compensation increased 5 points to 26%.
Capex: A net 56% of owners reported capex spending in the last six months, mainly on new equipment and vehicles, while there was a decrease of 3 points to a net 24% of owners planning capital expenditures in the next six months.
Borrowing: Small businesses continue to borrow at around the same rate they had since last summer, with the availability of loans improving over the last month, leaving business borrowing needs generally “satisfied” despite higher reported borrowing rates, which are now reported at 9%, up from 8.5% in July. Further, owners reported expectations that credit conditions would ease further in the coming three months.
Key Takeaways: August’s report showed a more pessimistic outlook from small business owners. “With small business owners’ views about future sales growth and business conditions discouraging, owners want to hire and make money now from strong consumer spending,” said NFIB Chief Economist Bill Dunkelberg. “Inflation and the worker shortage continue to be the biggest obstacles for Main Street.” Respondents noted that economic conditions were the main reason it was a bad time to expand/invest, followed by high-interest rates and a poor political climate, despite investment still needed to address labor shortages. Inflationary pressures increased, with price changes and price plans both ticking higher while compensation plans also rose, despite actual compensation changes, job openings, and employment changes all falling. Finally, credit access is not yet problematic, but the “actual interest rate paid” is near the series high reached in June.

*The overall NFIB optimism index ticked lower with the “hard” components weakening more than the “soft” ones

*Owner’s uncertainty ticked slightly lower after jumping higher in June

*Earnings improved slightly, remaining negative, while actual sales changes continued to trend lower and sales expectations moved sideways

*Pricing plans picked up after trending lower since peaking last spring while price plan intentions look to have based and are also rising

*Employment changes remained net negative while current and planned job openings continue to trend lower despite continued reports of trouble finding qualified workers
The University of Michigan Consumer Sentiment Index fell to 67.7 in September from 69.5 in the previous month and missing market estimates of 69.1. The Index for Current Economic Conditions fell sharply to 69.8 from 75.7 in the previous month. However, the Index of Consumer Expectations advanced to 66.3 from 65.5. Year-ahead inflation expectations fell to 3.1% from 3.5% in August, the lowest since March 2021. Long-run inflation expectations came in at 2.7%, falling below the narrow 2.9 - 3.1% range for only the second time in the last 26 months.
Key Takeaways: Consumer sentiment has been relatively flat for the last two months now. However, there have been some changes underneath the surface with “divergent movements across index components and across demographic groups.” The current readings show a “slowing optimism” as inflation remains problematic, which is now increasingly seen at the gas pump again, while consumers increasingly worry about the future of labor markets due to the “Fed’s policy tightening campaign” to slow the economy. This is the preliminary reading for September, and we expect a lower overall reading while inflation expectations will again rise in the final reading later in the month.

*It’s possible consumer sentiment readings have peaked with higher gas prices, loosening labor markets, and a government shutdown looming again

*Despite rises in gas prices, inflation expectations still fell on the month and are beginning to approach pre-pandemic ranges
The NY Fed’s Survey of Consumer Expectations showed one-year-ahead inflation expectations increased to 3.6% in August from 3.5% in the previous month. Year-ahead price expectations broadly rose, with gas (+0.4 percentage point to 4.9%), food (+0.1 percent point to 5.3%), medical care (+0.8 percent point to 9.2%), college education (+0.2 percentage point to 8.2%) and rent (+0.2 percentage point to 9.2%) all higher on the month. Also, home price expectations increased by 0.3 percentage points to 3.1%, its highest reading since July 2022. Inflation expectations for the three-year and five-year ahead horizon increased by 0.1 percentage point each to 2.8% and 3%, respectively. Turning to labor market expectations, respondents expect year-ahead earnings growth to rise by 2.9%, an increase of 0.1 percentage points, and within a tight range seen for two years. Expectations for a higher overall UER rose 1.8 percentage points to 38.5%, while the perceived probability of losing one’s job in the next year rose 2 points to 13.8%, the highest reading since April 2021. However, the probability of leaving one’s job voluntarily also increased. Household finance readings weakened, with income growth expectations for one year ahead falling to 2.9%, the lowest reading since July 2021. Spending growth expectations were little changed, moving slightly lower to 5.3%. The perception of credit access worsened; however, the perceived probability of missing a debt payment fell. Overall, perceptions about households’ current financial situations compared to a year ago “deteriorated slightly,” while year-ahead outlooks also worsened.
Key Takeaways: This was the first uptick in one-year-ahead inflation expectations since March, with broad increases in individual categories. However, inflation uncertainty was unchanged at the one-year-ahead horizon and decreased at the three- and five-year-ahead horizons. Uncertainty peaked in June last year, the same time as expectations, and its continued decline should give policymakers greater comfort that inflation expectations remain well anchored despite an uptick in the one-year ahead readings this month and a higher trending five-year outlook. Job market expectations cooled, both at the national level and when individuals looked at their own expected situation over the next year. However, this was somewhat refuted by an increase in turnover expectations, something more pronounced among lower-income respondents. Household income expectations and financial situation perceptions weakened while spending growth was little changed. Expectations for future stock prices and interest rates on savings accounts both continued to trend lower. There continued to be a negative shift in expectations for credit availability, but the debt delinquency outlook remained stable. Altogether, the consumers indicated a firming in inflation expectations in the latest survey while jobs were likely to be less available, and as a result, income and overall financial situations are expected to be slightly worse, although future earnings uncertainty fell notably.

*One-year ahead inflation expectations ticked higher and remain above historically normal levels, while three-year ahead is more range-bound

*One-year ahead earnings expectations are on the lower end of their range while spending expectations are also trending slightly lower
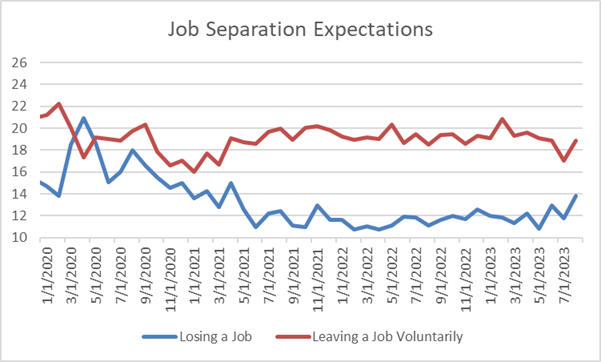
*There was an uptick in expectations to quit and lose one’s job in the next year

*Moving intentions are at the lower level of their post-pandemic range
The NY Fed’s Empire State Manufacturing Index increased to 1.9 in September from -19 in August, beating forecasts of -10. Activity and demand measures improved with Shipments (12.4 vs. -12.3) and New Orders (5.1 vs. -19.9) both bouncing higher back into expansionary territory, while Unfilled Orders (-5.2 vs. -6.8) improved slightly but remained contractionary. Delivery Times (2.1 vs. 1.9) remained steady around neutral while Inventories (-6.2 vs. -9.7) continued to contract, albeit at a slightly slower pace. Changes in labor market indicators were mixed, with the Number of Employees (-2.7 vs. -1.4) contracted slightly further while the Average Workweek (-5 vs. -10.7) contracted by less. Prices Paid (25.8 vs. 25.2) expanded at the same rate as last month, while Prices Received (19.6 vs. 12.6) increased. The six-month ahead General Business Conditions (26.3 vs. 19.9) improved further, with increases in expected new orders, shipments, and delivery times. Changes in expected future prices paid and received mirrored those seen in current readings, with a notable uptick in future prices received. Future hiring intentions declined but remained expansionary. Finally, Capex and technology spending intentions both fell but remained expansionary.
Key Takeaways: The reading showed business activity in the NY state was little changed on the month, with the general activity reading now near neutral. This is an improvement from a deeply contractionary reading last month and now moves the NY district in line with improvements seen in other regional Fed manufacturing PMI readings seen in July. From a policymaker perspective, increases in price pressures outweigh decreases in hiring intentions, and although this report in isolation bodes well for the soft landing scenario, it certainly does not warrant a loosening of policy anytime soon as it indicates expanding growth, increasing inflationary pressures, and only neutral employment activity. Finally, after picking up over the summer, capex and tech spending fell, moving in line with a longer-term downtrend in their respective readings.

*The General Business Condition reading for the NY Fed’s Manufacturing sector moved close to neutral in September after a notable contraction in August

*Price pressures showed greater expected pricing power by respondents, while hiring intentions were less expansionary
Technicals, Positioning, and Charts:
The S&P and Russell are outperforming the Nasdaq on the day with Low Vol, Value, and High Dvd Yield factors, as well as Utilities, Real Estate, and Financials outperforming on the day. Factor and sector performance on the week were more defensive-orientated. Growth and Momentum, along with Tech and Industrials, were the worst-performing factors/sectors. Despite the rise in Treasury yields on the week, higher-yielding stocks outperformed, with Utilities being the best-performing sector on the week. Finally, small-cap value was the best-performing size vs. value/growth combo on the week.

@Koyfin
S&P optionality strike levels have the Zero-Gamma Level at 4459 while the Call Wall is 4600 and the Put Wall is 4300. Today’s September OPEX is large in nominal terms. Until today, positioning around the 4500 strike level was suppressing volatility, as implied by Spotgamma’s tight calculated implied/expected 1-day range. Today’s OPEX is also very neutral regarding puts and calls. There can often be a mean reversion after OPEX driven by an imbalance of positions, but today’s does not have that imbalance. With the removal of the gravity around 4500, the daily trading range should open, and implied vol can rise. Next week has a number of catalysts from the central bank community, especially the Fed’s Sept FOMC meeting, and there is a Sept VIX OPEX, which may clear out put-positions that have acted as support.

@spotgamma
S&P technical levels have support at 4495, then 4475, with resistance at 4530, then 4545. Today saw a major breakdown of support levels, which are now resistance. The break below 4540 opened up the path to 4500, which, if we close below, would be a major psychological win for the “bears,” given the importance that level played in August. The 4460 level is now the yellow triangle wedge support (seen below) and an essential line of support for the current rally. Further, the 4460 support level connects the two rising August lows. Higher lows mean uptrend bias, and if August 20th was “the bottom” for any type of sustained uptrend, this area will need to hold.

@AdamMancini4
Treasuries are lower on the day, with the 10yr yield higher by 3 bps to 4.32%, while the 5s30s curve is unchanged on the session, sitting at -4 bps.

Four Key Macro House Charts:

Growth/Value Ratio: Value is higher on the day and the week, with Small-Cap Value the best-performing size/factor on the week.

Chinese Iron Ore Future Price: Iron Ore futures are higher on the day and the week.

5yr-30yr Treasury Spread: The curve is steeper on the week.

EUR/JPY FX Cross: The Euro is stronger on the day and the week.
Other Charts:

The breadth of the current rally continues to worsen with a growing divergence between the S&P Index and an equal-weighted version of it.
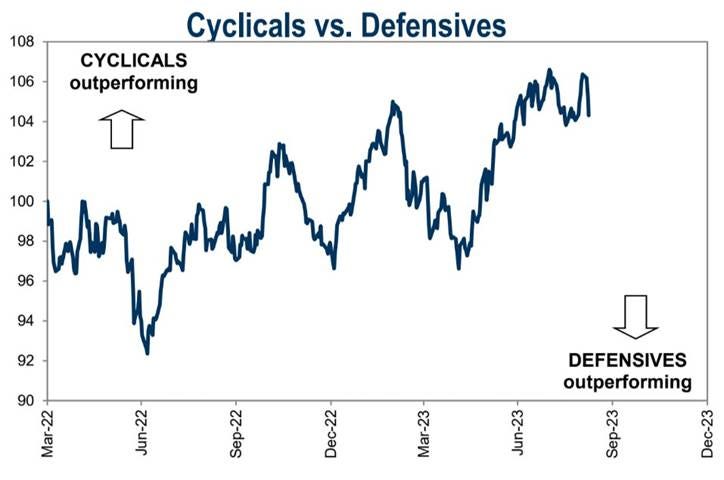
Cyclicals dropped sharply last week relative to Defensives – Goldman Sachs

The Nasdaq’s cumulative advance/decline line continues to fall as fewer stocks participate in the current rally.

Implied volatility is low, and daily moves in the S&P continue to be stuck in a tight range, supported by optionality which will come off in today's large OPEX. Next week should see larger trading ranges and a higher VIX given the number of potential catalysts.
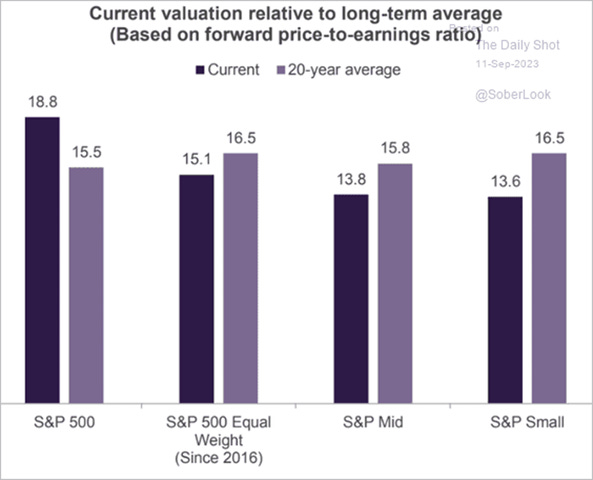
Due to increases in the mega-caps, overall index P/E ratio levels are historically high, but the majority of underlying stocks are at valuation levels below historical averages.

Data from the second quarter show that the value of S&P 500 share buybacks declined sharply. Companies spent just under $175 billion repurchasing shares, down from $215 billion in the first quarter. That’s not encouraging. As this chart from Ed Yardeni of Yardeni Economics demonstrates, declines of such a magnitude have generally in the past prefigured an economic slowdown.

"US households are still heavily invested in equities." - Goldman Sachs

The MOVE index, a measurement of Treasury market volatility, is breaking through past resistance.

However, globally, yields are still trending higher.

“OPEC just said that global oil markets will face a massive supply shortfall next quarter. They expect a supply shortfall of more than 3 million barrels per day. If OPEC is correct, it would result in the biggest inventory drawdown since 2007. Voluntary production cuts by OPEC members are removing 1.3 million additional barrels of oil supply every day currently.” - @KobeissiLetter

Backwardation continues to grow in the Brent and WTI futures curve.
Articles by Macro Themes:
Medium-term Themes:
China’s Post-Pandemic Life:
Tentative Signs: China's industrial output grew 4.5% in August from a year earlier, accelerating from the 3.7% pace seen in July, suggesting that the recent flurry of support measures may be starting to slowly stabilize a stumbling economic recovery. Retail sales also grew at a faster 4.6% pace in August, aided by the summer travel season, and was the quickest growth since May. Fixed asset investment expanded 3.2% in the first eight months of 2023 from the same period a year earlier versus expectations for a 3.3% rise. The figures followed better-than-expected bank lending data, a narrowing in the declines of exports and imports as well as easing deflationary pressure, indicating tentative signs of stabilization in China's sputtering economy. - China August industrial output, retail sales growth beat expectations - Reuters

Uncertainty on Top: Officials in charge of day-to-day economic affairs have been holding increasingly urgent meetings in recent months to discuss ways to address the deteriorating outlook. Yet despite advice from leading Chinese economists to take bolder action, the people said, senior Chinese officials have been unable to roll out central stimulus or make significant policy changes because they don’t have sufficient authority to do so, with economic decision-making increasingly controlled by Xi himself. The top leader has shown few signs of worry over the outlook despite the gathering gloom and hasn’t seemed interested in backing more stimulus, according to the people and publicized remarks by Xi. - Xi’s Tight Control Hampers Stronger Response to China’s Slowdown – WSJ

Longer-term Themes:
A.I. All Day:
Frank Debate: Elon Musk, Bill Gates, Mark Zuckerberg, and other technology heavyweights debated the possibilities and risks of artificial intelligence in a closed-door meeting with more than 60 U.S. senators contemplating legislation to regulate the technology. They agreed that the government needed to play a role in regulating artificial intelligence. Despite that consensus, the meeting also laid bare some of the tension points ahead. One debate centered on so-called “open-source” AI systems that are available for the public to download and modify. Another point of tension related to workers who see AI as a potential threat to their jobs.Some executives in the room argued that adding too many safety guardrails on AI systems risked American leadership in the technology. Another contested topic is the possibility that future AI systems could wipe out humanity. - Musk Warns Senators About AI Threat, While Gates Says the Technology Could Target World Hunger – WSJ

Energy’s Midlife Crisis:
Materials Needed: Most renewable technologies require bulk materials like aluminum, cement, and steel. But others also need specialty ingredients. Solar panels run on polysilicon, while wind turbines need fiberglass for their blades and rare-earth metals for their motors. While we technically have enough of the materials we need to build renewable energy infrastructure, actually mining and processing them can be a challenge. To better understand the material demands of reaching climate targets, researchers looked at 17 of the key materials needed to generate low-emissions electricity. Their estimates of future power sector generation material requirements across a wide range of climate energy scenarios highlight the need for greatly expanded production of certain commodities. However, they found that geological reserves should suffice to meet anticipated needs, and project climate impacts associated with the extraction and processing of these commodities to be marginal. - Yes, we have enough materials to power the world with renewable energy – MIT Technology Review

Food: Security, Innovations, and Climate Change Implications:
Volatile Weather: Scorching temperatures and drought conditions followed by deluges of rain have made for an unusually volatile growing season for U.S. farmers. However, more weather-resilient seed technology is also helping farmers. Seed makers, such as Corteva, Bayer, and Syngenta, have spent years developing more drought-tolerant crops. Turning to livestock, high temperatures can pose a deadly risk to cattle in feedlots in the Midwest before they are shipped to slaughter plants. Persistent drought over the past few years has dried out grazing pastures in many cattle states, such as Nebraska and Kansas. The result has led to ranchers shrinking the size of their herds rather than paying more to buy expensive hay to feed the livestock. A lower cattle supply means more expensive beef for U.S. consumers. All in all, changing weather is affecting production, and farmers and ranchers are reacting accordingly. - How Crops Survived Drought, Deluge and the Hottest Summer on Record – WSJ

Podcasts and Videos:
VIEWS EXPRESSED IN "CONTENT" ON THIS WEBSITE OR POSTED IN SOCIAL MEDIA AND OTHER PLATFORMS (COLLECTIVELY, "CONTENT DISTRIBUTION OUTLETS") ARE MY OWN. THE POSTS ARE NOT DIRECTED TO ANY INVESTORS OR POTENTIAL INVESTORS, AND DO NOT CONSTITUTE AN OFFER TO SELL -- OR A SOLICITATION OF AN OFFER TO BUY -- ANY SECURITIES, AND MAY NOT BE USED OR RELIED UPON IN EVALUATING THE MERITS OF ANY INVESTMENT.
THE CONTENT SHOULD NOT BE CONSTRUED AS OR RELIED UPON IN ANY MANNER AS INVESTMENT, LEGAL, TAX, OR OTHER ADVICE. YOU SHOULD CONSULT YOUR OWN ADVISERS AS TO LEGAL, BUSINESS, TAX, AND OTHER RELATED MATTERS CONCERNING ANY INVESTMENT. ANY PROJECTIONS, ESTIMATES, FORECASTS, TARGETS, PROSPECTS AND/OR OPINIONS EXPRESSED IN THESE MATERIALS ARE SUBJECT TO CHANGE WITHOUT NOTICE AND MAY DIFFER OR BE CONTRARY TO OPINIONS EXPRESSED BY OTHERS. ANY CHARTS PROVIDED HERE ARE FOR INFORMATIONAL PURPOSES ONLY, AND SHOULD NOT BE RELIED UPON WHEN MAKING ANY INVESTMENT DECISION. CERTAIN INFORMATION CONTAINED IN HERE HAS BEEN OBTAINED FROM THIRD-PARTY SOURCES. WHILE TAKEN FROM SOURCES BELIEVED TO BE RELIABLE, I HAVE NOT INDEPENDENTLY VERIFIED SUCH INFORMATION AND MAKES NO REPRESENTATIONS ABOUT THE ENDURING ACCURACY OF THE INFORMATION