


Retail Buyers Reawaken, Driving Rotation into Small-Caps as Markets Await CPI and Fed Next Week– Midday Macro - 6/9/2023
Color on Markets, Economy, Policy, and Geopolitics

Retail Buyers Reawaken, Driving Rotation into Small-Caps as Markets Await CPI and Fed Next Week– Midday Macro - 6/9/2023
Daily/Weekly Price Action and Headlines:
Equities are higher on the day and week, with tech and discretionary sectors leading today but small caps the winner on the week, as lack of Fed speakers and a light week of new data have traders looking to next week’s CPI report and June FOMC meeting results
Treasuries are weaker on the day and the week, with two-year yields higher by almost 40bps on the week as surprise rate hikes from the BoC and RBA increased worries the Fed may raise rates again next week
Oil is lower on the day and the week, with realized vol higher due to OPEC+ cuts, inventory draws, questionable JCPOA 2.0 headlines, and continued demand worries generally leaving WTI prices in the middle of its post-May range

Market’s Weekly Narrative:
Once again, acronyms like FOMO and MEMEs are hitting the subject line in our inbox, as the recent AI-driven “magnificent seven” rally has morphed into a small-cap short covering one. Investor sentiment and risk appetite have rocketed higher while the VIX ends the week with a 13 handle. There was a mix of sector performance this week, with some defensive areas catching up, helping small-cap value be the best-performing size-factor combo on the week. On the one hand, we received further evidence of a cooling labor market this week with increased initial claims and contracting hiring intentions, as seen in the ISM Service PMI report. On the other hand, Fed reports showed that household net worth increased in Q1 while total consumer credit stayed stable in May, increasing the consumer’s potential aggregate demand level and indicating that the healthy balance sheets that have driven above-trend personal consumption expenditures in Q1 are still in place. With a lack of any new messaging from Fed officials this week due to the June FOMC blackout period, other central banks stole the spotlight as the BoC and RBA both delivered surprise hikes, increasing worries that the Fed will go next week, although the market-implied odds have that below 50%. As a result, two-year Treasuries had a rough week, inverting the curve further and keeping the MOVE index elevated, especially in comparison to the VIX. Yields in the front end and belly of the curve are ending the week at their highest level since they crashed in March. Oil had a volatile week, with OPEC+ announcement regarding further cuts by Saudi quickly being dismissed due to continued demand concerns and worries Russia wasn’t anywhere near their cut levels. Inventory draws also didn’t help, and there were what looked to be misleading headlines about JCPOA 2.0 resuming. Copper rebounded slightly on the week due to increased expectations that Beijing would put forth more stimulus and better May purchasing data there. The agg complex also moved higher on the week, with softs especially well bid again, while soy and corn trended higher. The dollar was broadly weaker on the week, with the $DXY ending the week at 103.6.
Deeper Dive:
The resumptions of interest-rate hikes by Canada and the unexpected continuation of rate raises by Australia this week have markets more uncertain over what the Federal Reserve will do next week. We believe the Fed will pause, as somewhat telegraphed last week. We also believe a pause is a stop, given our view that the on-the-ground economic backdrop indicates the Proxy Fed Funds Rate is restrictive enough to bring inflation back to target in a timely fashion while still ensuring the coming below-trend period of growth needed to realign supply and demand does not morph into a deep recession. However, the recent strength in core PCE inflation is outpacing the FOMC’s last SEP forecast. Further, median and trimmed-mean CPI and PCE readings showed no deceleration last month, leaving Fed officials relying on that view with plenty to worry about. If next week’s CPI report shows an a greater than expected uptick in core goods prices (from used cars) and continued stickiness in core services (from transportation and recreation), the Hawks will likely have the ammo needed to make a more convincing argument for a rate hike in July, as telegraphed in the SEPs.
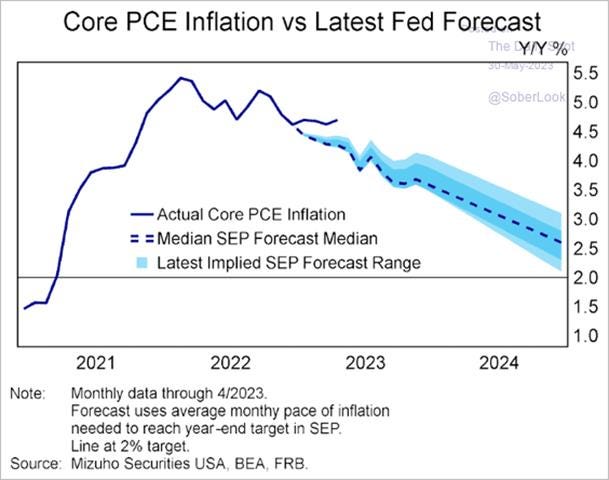
*April’s stronger-than-expected reading further moved the path of core PCE higher than the last FOMC SEPs projections
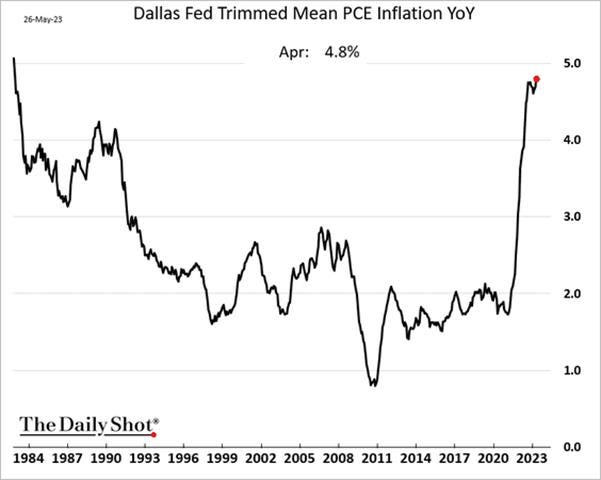
*Trimmed mean is a favorite inflation measure for the Hawks, and it has yet to peak meaningfully
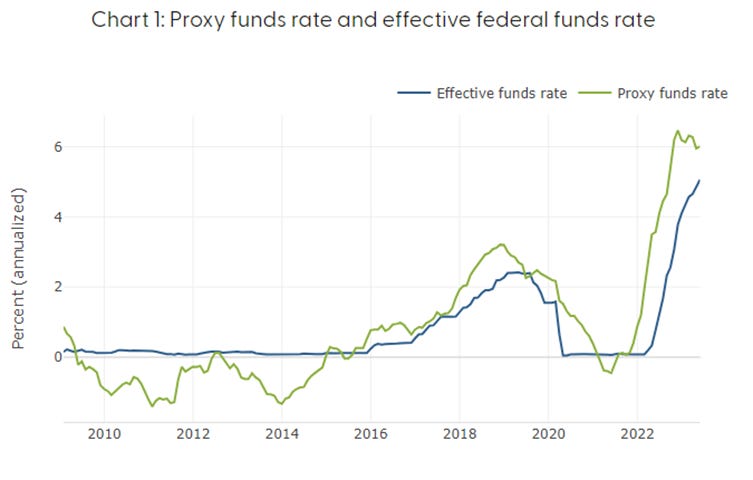
*The SF Fed sees the real effective Fed funds or Proxy Funds Rate, when accounting for QT, at 6%
Remember, supercore CPI only rose by 0.1% MoM in April, but supercore PCE was up 0.4% MoM, and the CPI reading could easily reverse back to the more normal 0.3 - 0.5% MoM recent range given there was no significant deceleration in consumer activity over the last month. It's also unclear when the well-known but yet-seen disinflationary pulse expected from shelter costs will meaningfully hit in May. Housing strength was mentioned multiple times by Fed officials since the May FOMC, and with residential investment is expected to make a positive contribution to Q2 GDP, downward trending home prices seem secondary to outright housing market strength concerns currently, discounting any weakness in shelter CPI coming. On the other hand, last month’s CPI report showed 40% of the CPI basket in outright deflation. Additionally, we expect a continued growing divergence between headline and core disinflation, with headline expected to drop notably in May’s report due to decreases in energy and food prices. Finally, falling leading cost pressure indicators, as seen in PPI and ISM PMI Prices Paid readings, indicate that the disinflationary trend should accelerate. Did you get all that? In summary, the half-full or half-empty view regarding inflation by policymakers is still as strong as it was going into the May FOMC meeting, explaining the wide divergence in views we continue to hear from Fed officials.
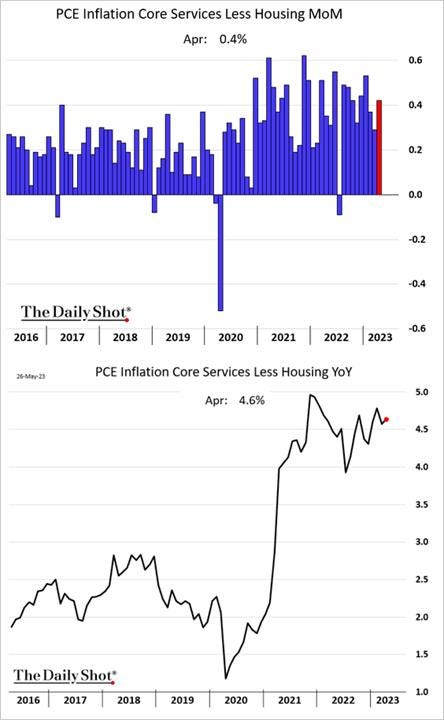
*Even if shelter falls, core services less housing has moved sideways for over a year now. Will this begin to break as price inputs and wage pressures abate?
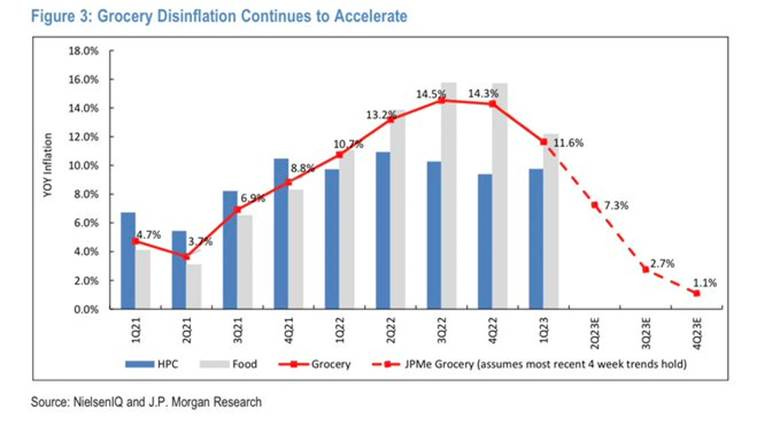
*Recent declines in energy prices and more evidence food prices are stabilizing and beginning to soften should drive headline inflation lower in May, and this tends to pull core lower with a lag
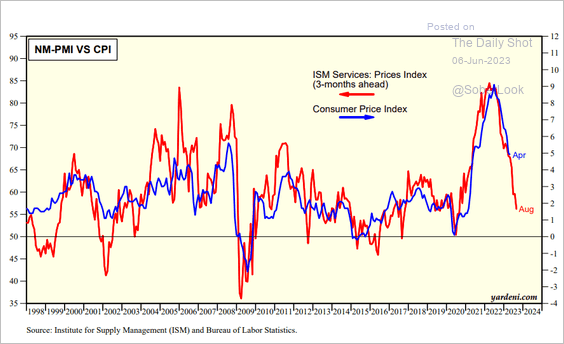
*Declines in ISM Services PMI Prices Paid sub-index indicate overall CPI should trend lower
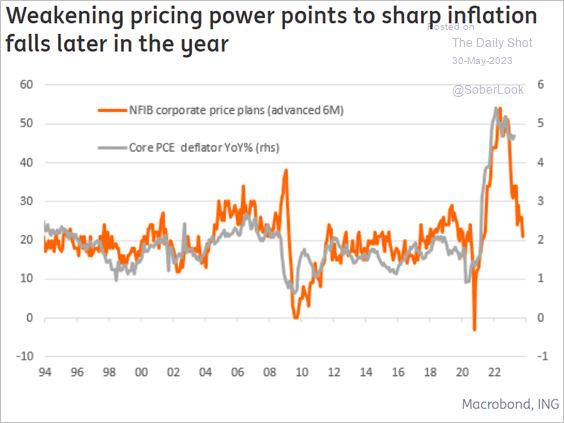
*Declining price increase plans by small businesses reinforce the drops seen in ISM PMI reports
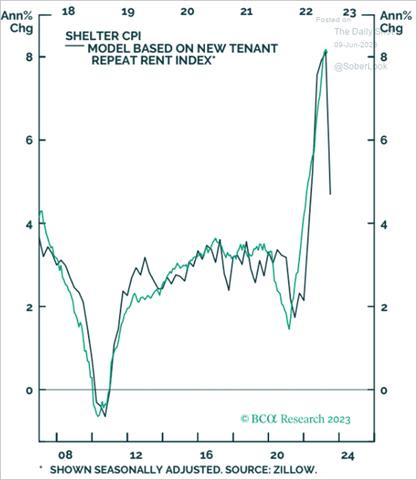
*The lag in the official CPI shelter reading verse what higher frequency new lease data has shown for some time looks to be finally be ending
If the Fed does pause but indicates that a resumption in July is expected through the official statement, Powell press conference, and SEPs messaging, markets may not believe them. This would lead to a further melt-up in stocks, something we have as our modal case. With greed back in control of animal spirits, hope springs eternal again, meaning macro headwinds, increasingly at odds with equity valuations (especially at the index level following recent gains), are being ignored. With other central banks demonstrating this week that consumer strength and tight labor markets are still controlling policymaking conversation/decisions verse skating to where the puck looks to be going, which is a looser labor market and lower demand-pull inflationary pressures, we are certainly at risk of a group-think-induced policy error. In all fairness, consumer resilience still seems well supported in Q2. Labor markets are only now starting to cool, and even if we discount the accuracy of the JOLTs report, it indicated an abundance of openings per available worker, while the recent NFP report handily beat expectations. Further, Q1 household net worth data showed an increase in assets with little change in liabilities. May’s consumer credit reading by the Fed also showed no change in total consumer credit, as the much-watched revolving credit, comprised of credit card debt, actually fell. However, markets price forward, and our expectation is for a more notable slowdown/contraction to begin towards year-end as the full weight of the cumulative policy tightening to date hits more forcefully, weakening confidence and slowing consumer investment demand/activity more notably and finally leading to contacting labor markets.
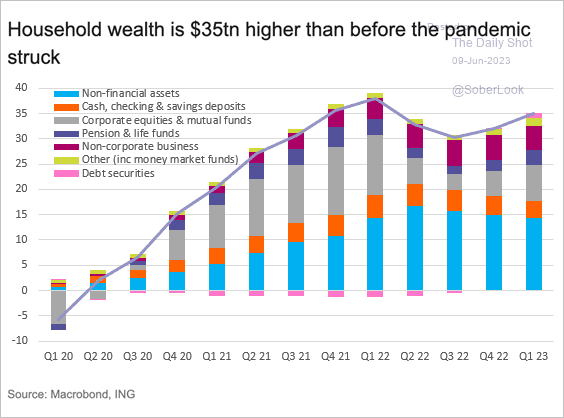
*Gains in financial assets and no meaningful change in debt levels improved household wealth in Q1
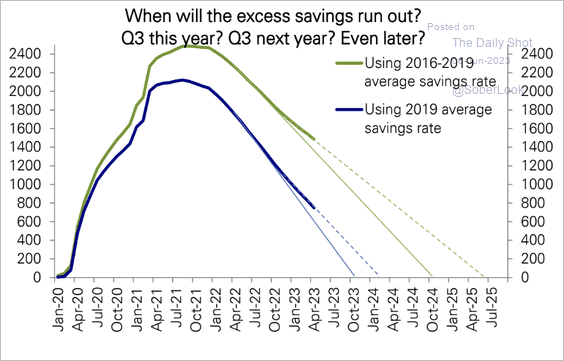
*Projections widely vary, but it is likely coming sometime in Q3, as excess savings continue to run down
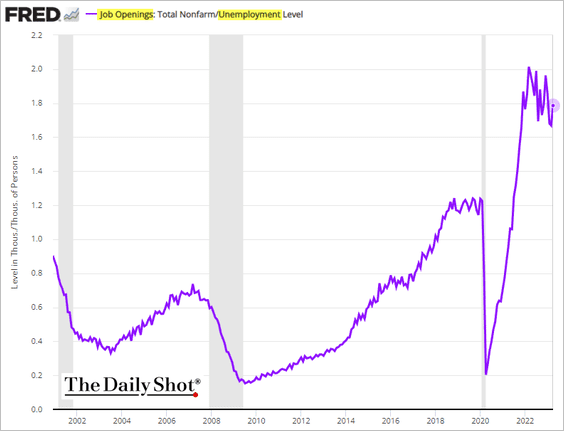
*We have long been skeptical about the quality of the JOLTs report, but even with a steep haircut, openings are at a historically high level per the unemployment level
It is more apparent that the economic community believes the exogenous shock to the supply and demand balance caused by the pandemic has largely played out. The current inflationary pulse is mainly demand-driven as supply-side impairments have normalized. This demand is weakening and, as a result, reducing wage-spiral fears. Moving forward, normalizing consumption patterns, falling excess savings, increased uncertainty regarding future job/income security, and higher costs/reduced access for/to credit will all increasingly weigh on aggregate demand. Conversely, increases in household net worth and real disposable income, which supported the consumer in Q1, will have a diminished ability to allow firms to pass on price increases moving forward (due to the greater weight from the prementioned negative factors) as consumers become more inelastic in demand. Further, firms are seeing decreased input costs, with materials falling and wages stabilizing. As a result, we should increasingly see more active discounting as firms have reduced needs to increase/defend margins and try to capture market share verse competitors in the face of weaker aggregate end demand. Said another way, a more inelastic end buyer that is pushing back on the inflation narrative reduces the ability to increase prices, but falling costs reduce the need to do so, shifting strategy to volume over price. This is already apparent in several sectors, exacerbated by the overbuilding of inventories, with discounting levels growing.

*Not brought up, China's deflationary backdrop will only weigh further on US disinflationary trends
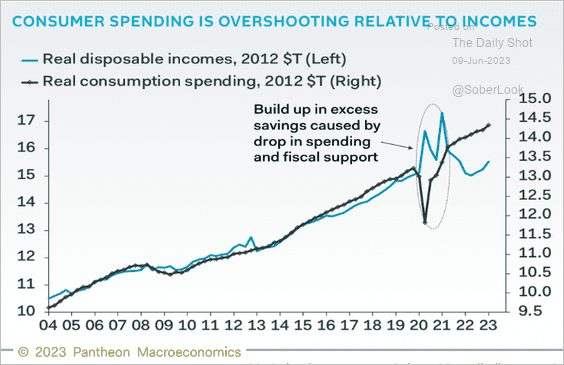
*With inflation falling, especially at the headline level, real disposable incomes are rising, but past inflation led to spending overshooting income for two years now

*Spending will increasingly be feeling the Feds tightening cycle if history is any guide
As a result of all we have discussed, the current risk asset strength, which is best seen in a broadening breadth and FOMO feel in equity markets, is likely establishing a higher range but lacks the backdrop to regain all-time highs. This dip-buying rally that has officially entered bull market territory will level out as earnings expectations again turn negative into Q3 due to weakening data and reduced pricing power by firms. Earning multiples will also be increasingly weighed on by rising real rates and lower levels of liquidity. We believe a final blow-off top formation is coming for stocks as the Fed pauses next week and animal spirits take off, ignoring the coming weaker fundamental story for a FOMO-driven frenzy given the level of dry powder and (wrongly) perceived current earnings backdrop. The consumer also likely has another quarter of above trend strength, supporting Q2 earning expectations for a while longer. But as markets increasingly look to 2024 and the economy slows into year-end, we expect a more range-bound equity and rate market until we get clarity from the Fed later in the year on how long they plan to stay at the terminal rate. Finally, we are adding a long position in the Ishares 20+ Year Treasury Bond ETF $TLT as a hedge to our more growth-orientated book but also due to our belief that a Fed on pause will likely result in lower nominal yields across the curve.
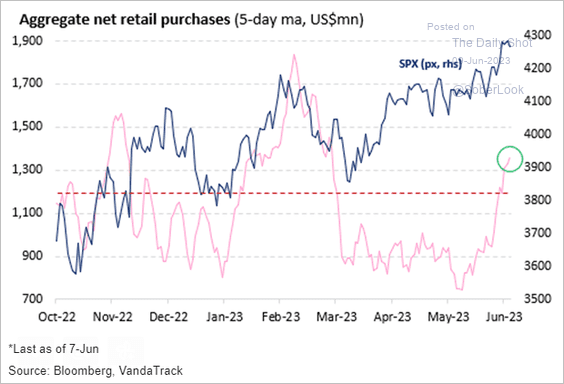
*Retail investors have caught the FOMO bug again, initially driving up the magnificent seven but increasingly rotating into small-caps

*Trailing P/E valuations are now at the top of their recent annual range, with forward P/E’s little different
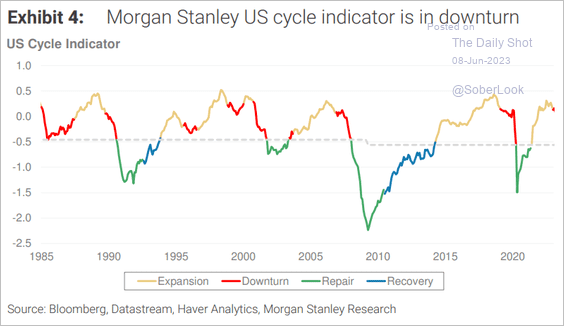
*We look to be entering the “Downturn” stage of the cycle, where firms will look to change strategies as demand inelasticity increases

*We maintain our portfolio positions due to our belief we should see a further rally post-FOMC next week as sidelined cash increasingly comes in but we will likely be exiting our EM and Small-Cap longs soon
Policy Talk:
A joint project between researchers at the Federal Reserve Banks of Atlanta, Cleveland, and New York identified the primary reasons firms raise their prices in the current environment. A Liberty Street Economics blog post titled “How Do Firms Adjust Prices in a High Inflation Environment?” useda combination of open-ended, semi-structured interviews and second-stage quantitative survey of about 700 businesses that was fielded in late 2022 and early 2023 across the Second, Fourth and Sixth Federal Reserve districts. Firms reported that the strength of demand was the most important factor affecting pricing decisions in recent years, while labor costs and maintaining steady profit margins were also highly important. Using three methodological approaches, Fed researchers consistently estimate a rate of cost-price passthrough in the range of 60% for the representative firm over 2022-23. These estimates mask considerable heterogeneity, with some firms reporting a passthrough greater than one. Again, in summary, firms report that the key determinants of their pricing decisions include the strength of demand, maintaining steady profit margins, labor, and nonlabor costs, and competitors’ prices. Fed staff will further research the interplay among these factors and how they contribute to the observed heterogeneity in pass-throughs.

*As demand fall and input cost increases slow, will firms be able to increase prices as much as the last two years? Probably not
Total consumer credit increased by SAR of 5.7% YoY, increasing $23 billion in April, after a downwardly revised 5.7% MoM or $22.83 billion rise in March, beating market expectations of a $22 billion increase. Revolving credit (credit cards) rose by 13.1% YoY, compared to a 14.6% YoY rise in the prior month. Nonrevolving credit (auto and student loans) increased by 3.2% YoY, following a downwardly revised 2.7% YoY gain in the prior month.
Why it Matters: While the annual increase in total consumer credit was the same in April as in March, in a change of pace, the use of revolving credit slowed while nonrevolving picked up. To be clear, at 5.7% YoY, total credit is growing at the fastest pace since last November and is now at $4.86 trillion, its highest level; of course, this is not adjusted for inflation. For now, it still looks like the consumer is not having trouble accessing credit, and although households with lower credit scores are paying more to access credit, this still has not spread more broadly.
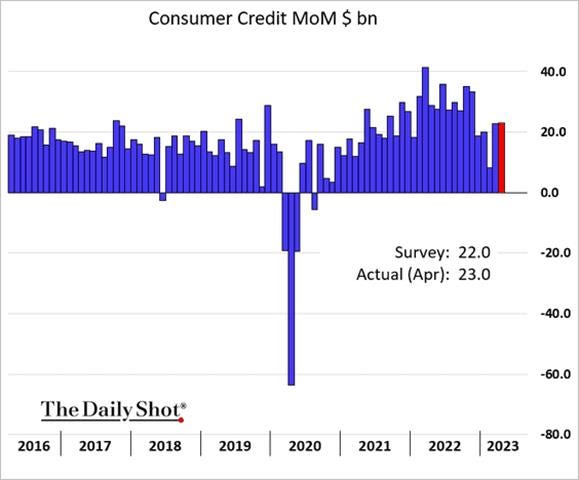
*Increases in nonrevolving kept the total level of credit growth the same as last month as revolving credit use fell
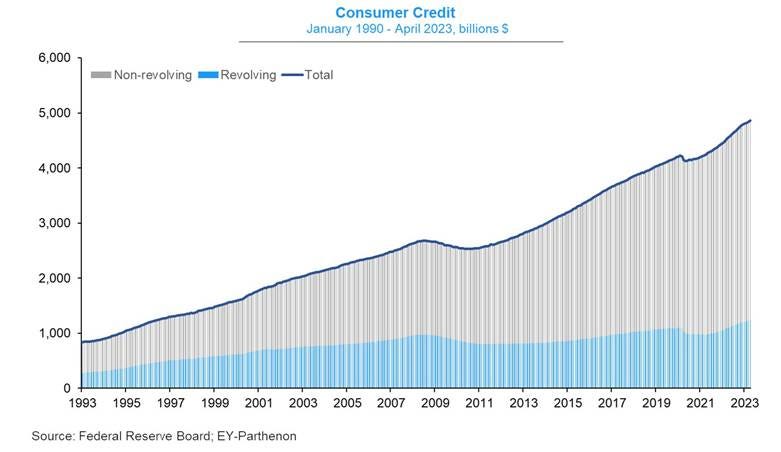
*Nominal levels of consumer credit continue to grow while real levels (adjusted for inflation) show revolving credit usage is still below pre-pandemic levels

*Terms of credit show commercial bank interest rates continue to rise for new car loans (7.5%), credit card plans (20%), and personal loans (11.5%)
The Federal Reserve released its Z.1 Financial Accounts quarterly report showing the net worth of households rose to $148.8 trillion during the first quarter. The rise was due to an increase in equity holding values (+$2.4 trillion) while the value of real estate decreased (-$0.6 trillion). Household liquid assets (cash, bank deposits, and MMF holdings) fell $115.0 billion in the first quarter to $17.8 trillion. This remains $1.9 trillion higher than the level that would have prevailed had these liquid assets continued to rise at pre-Covid growth rates. Liquid assets of nonfinancial companies rose $174.0 billion in the first quarter to $6.5 trillion. The ratio of these liquid assets to GDP rose to 24.5% from 24.2% in the prior quarter, a very elevated level of corporate liquid assets in relation to GDP. Nonfarm nonfinancial companies had a financing gap of 1.7% of GDP in Q1 ’23, with capital spending above the level of corporate cash flow and an increase from the fourth quarter’s financing gap of 0.7%. The aggregate debt-to-equity ratio for the nonfarm nonfinancial corporate business sector declined to a historically low 24.1% in the first quarter from 25.7% in the fourth quarter of 2022. Domestic nonfinancial debt expanded by 3.5% YoY to $69.5 trillion, of which household debt increased by 2.2% YoY to $19.2 trillion, nonfinancial business debt increased by 3.8% YoY to $20 trillion, and total government debt rose to $30.4 trillion. Domestic nonfinancial debt expanded by 3.5% YoY to $69.5 trillion, of which household debt increased by 2.2% YoY to $19.2 trillion, nonfinancial business debt increased by 3.8% YoY to $20 trillion, and total government debt rose to $30.4 trillion. As a share of GDP, federal debt is 102.5% as nominal GDP continued to grow at a faster rate than federal debt.
Why it Matters: Household balance sheets are healthy on aggregate with a historically elevated net worth in relation to disposable income, still lower leverage levels than pre-pandemic norms, and high levels of liquid assets. Q1 data showed net worth growing as financial assets increased while liabilities were stable. Corporate balance sheets also have a high level of liquid assets, and their aggregate debt-to-equity ratio declined to historically low levels. However, their financing gap, the rate at which their capital spending increased faster than corporate cash flow, worsened.
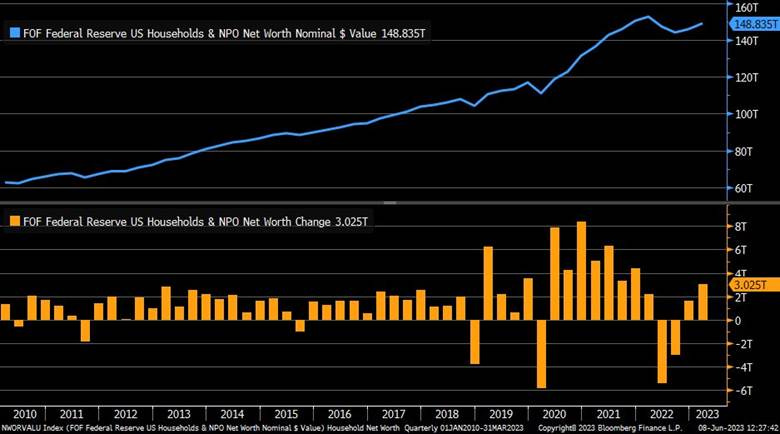
*The rebound in financial assets overcame losses in real estate, helping net worth rise to $149 trillion as debt levels stayed stable in Q1
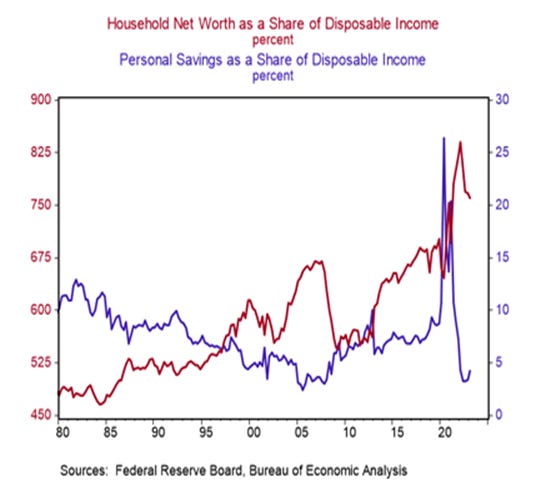
*Although falling, households still have a historically high level of net worth to current disposable income, while the savings rate has also ticked higher as a percent of DI

*The level of liquid assets households have is slowly trending back to longer-term prep-pandemic trend growth but remains elevated
Econ Data:
The ISM Services PMI fell to 50.3 in May from 51.9 in April, below forecasts of 52.2. Demand and activity measures slowed but remained expansionary on aggregate. Readings of Business Activity (51.5 vs. 52), New Orders (52.9 vs. 56.1) fell closer to neutral, while New Export Orders (59 vs. 60.9) still expanded at a stronger pace. The Backlog of Orders (40.9 vs. 49.7) dropped notably further into contractionary territory. Employment (49.2 vs. 50.8) contracted slightly after three months of growth. Supplier Deliveries (47.7 vs. 48.6) indicated continued improvements in logistics, while the large increase in Inventories (58.3 vs. 47.2) and Inventory Sentiment (61 vs. 48.9) readings indicate a significant shift in how firms are viewing their current stock. Imports (50 vs. 51.3) also declined, moving to neutral. Finally, Prices (56.2 vs. 59.6) continued to trend lower, with 70% of firms reporting no change over the month.
Why it Matters: Fed officials would view this as a positive report, with prices falling while activity and demand remained expansionary, keeping a “soft landing” narrative alive. Logistics measures and capacity constraints also improved, reducing inflationary pressures through the supply-side impairment channel. Inventories sentiment significantly changed, and although ISM PMIs don’t provide a future outlook/expectation reading, the jump in inventory sentiment indicates firms are increasingly worried about future demand. This was echoed by Anthony Nieves, Chair of the ISM Services Business Survey Committee, who said, “There has been a pullback in the rate of growth for the services sector. This is due mostly to the decrease in employment and continued improvements in delivery times (resulting in a decrease in the Supplier Deliveries Index) and capacity, which are in many ways a product of sluggish demand. The majority of respondents indicate that business conditions are currently stable; however, there are concerns relative to the slowing economy.” Selected respondent comments echoed this as well, generally tilted more positively but indicating pockets of weakness in various industries and a more cautious outlook.

*Contracting employment and shorter supplier delivery times drove the overall ISM Services PMI lower in May

*The Backlog of Orders continues to show reduced capacity constraints, supporting lower inflationary pressures
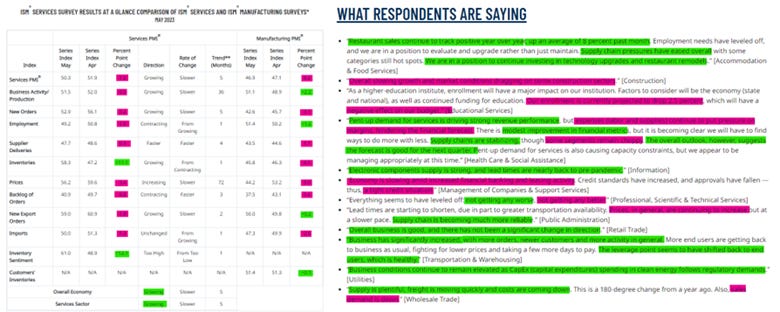
*The majority of sub-indexes fell on the month while selected comments were tilted more positively
New orders for manufactured goods increased by 0.4% MoM in April, following a downwardly revised 0.6% MoM in March and missing market forecasts of a 0.8% MoM increase. Excluding transports, new orders fell by -0.2% MoM, and excluding defense, they were down -0.4% MoM. On an annual basis, manufacturing orders are higher by 1.4% YoY. Transportation equipment (3.7% MoM vs. 9.8% MoM in March) did slow on the month, although defense aircraft and parts (32.7% vs. 26.9%) rose. Demand for machinery rebounded (1.6% vs. -0.1%). On the other hand, new order levels stalled for fabricated metal products (0 vs. 0.7%) and contracted for primary metals (-0.6% vs. 0.5%), computers and electronic products (-1.4% vs. 1.8%), and electrical equipment, appliances, and components (-1.7% vs. 0.4%). Shipments decreased by 0.4% MoM, following a -0.6% decrease in March, and are now down five of the last six months. Unfilled orders increased 0.8% MoM following a 0.4% MoM increase in March, up four of the last five months. The unfilled orders-to-shipments ratio was 6.71, up from 6.60 in March. Inventories increased 0.5% MoM, following a -0.8% MoM decrease in March. The inventories-to-shipments ratio was 1.50, up from 1.48 in March.
Why it Matters: The volatile transport and a lesser extent, defense industries were responsible for April’s positive new order gains. Otherwise, the report showed a mixed picture that indicated a broadly cooling picture in demand and shipments during the month. There were some bright spots. Machinery orders and shipments increased due to an increase in mining, oil field, and gas field equipment as well as metalworking machinery, although demand for industrial machinery fell again. The weakness in electric lighting equipment and appliances reversed recent gains and is worth watching, given the recent stabilization in housing activity. A 1.0% MoM increase in durable goods inventories moved the inventory/shipment ratio back to highs of the year, indicating that despite increased worries about future demand, inventory levels are growing on aggregate; however, as with new orders, this was driven by transportation equipment stock builds.
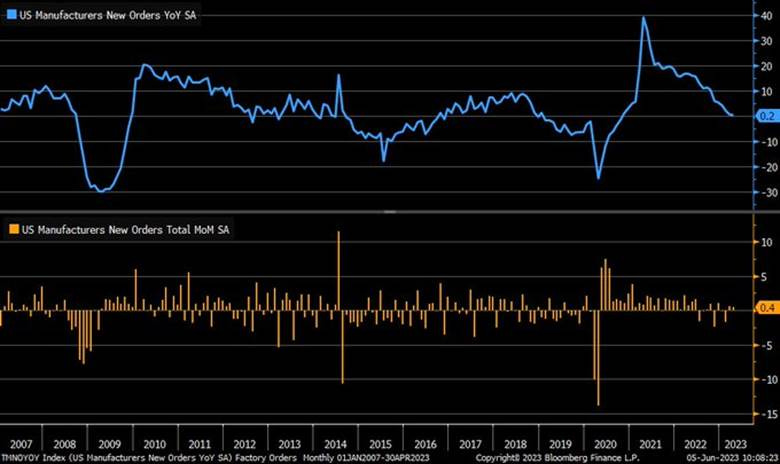
*Transports and Defense again drove gains; excluding transports, new orders fell by -0.2% MoM, and excluding defense, they were down -0.4% MoM

*Inventories and Unfilled Orders both increased compared to Shipments in April
Wholesale inventories decreased by -0.1% MoM in April, less than earlier estimates of a -0.2% MoM decline and following a downwardly revised -0.2% decline in March. Inventories fell the most for nondurables (-1.2% MoM vs. -0.5% MoM in March), mostly due to decreases in holdings of drugs (-0.8% MoM), apparel (-2.3% MoM), and farm products (-7.1% MoM). On the other hand, stocks for durable goods rose 0.6% MoM (vs. a flat reading in March). Compared to a year earlier, wholesale inventories are higher by 6.3%. The total inventory-to-sales ratio moved slightly lower to 1.40 from 1.41, with the durables ratio (1.85 vs. 1.83) moving slightly higher while the nondurables ratio (1.01 vs. 1.03) moved slightly lower.
Why it Matters: Wholesalers' inventories and sales continue to trend lower in April. This follows private inventory investment rising at its slowest pace in one and a half years in the first quarter, notably weighing on GDP growth. Wholesale motor vehicle inventories rose 0.3% in April after increasing 2.0% in March, while machinery inventory rose 2.1% MoM. But inventories of furniture, lumber, computer equipment, and professional equipment all fell. We should start to see a restocking of inventories over the summer into the holiday period as inventory levels increasingly look tighter. Still, firms are being much more careful, given the greater uncertainty over where end demand will be.
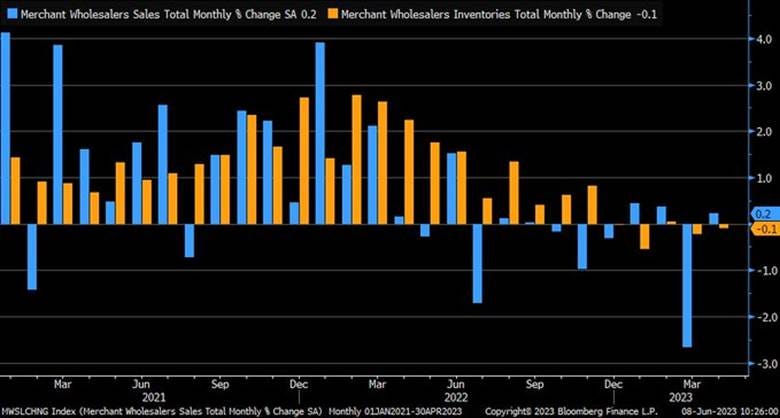
*Wholesalers continue to report weaker sales and lower inventory accumulation
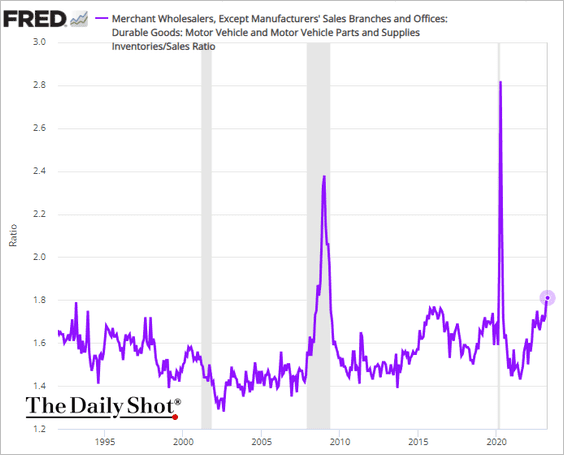
*Auto inventories are trending higher as supply chains and part shortages have normalized
Technicals, Positioning, and Charts:
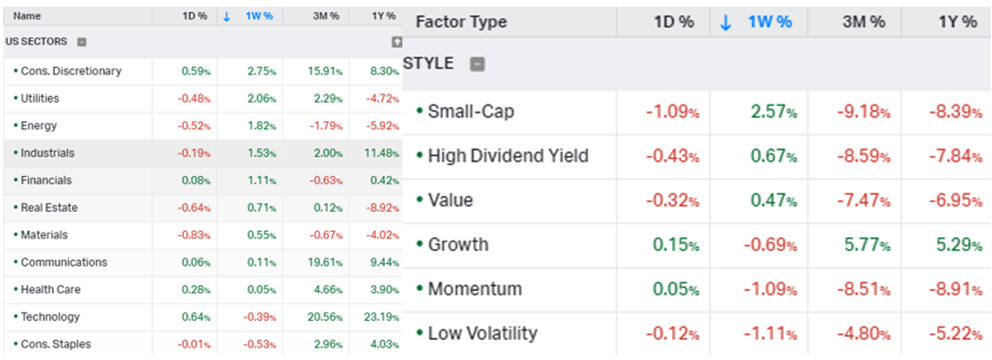
The Nasdaq is outperforming the S&P and Russell, with Growth and Momentum factors, as well as Technology, Consumer Discretionary, and Healthcare sectors all outperforming on the day. There was no clear tilt to sector performance this week as Discretionaries, Utilities, and Energy outperformed, indicating a mixed defensive vs. cyclical growth view. Small Caps were the clear winner in regards to size factor on the week, while Value and High Dividend Yield also made gains compared to the S&P.
@KoyfinCharts
S&P optionality strike levels have the Zero-Gamma Level at 4205 while the Call Wall is 4300 and Put Wall is 4000. The SPY Call Wall has rolled higher to 435, which is a function of both calls being added to that strike but also puts filling in the 425-430 range. 4,300 is a massive call strike level for the S&P and will provide notable resistance. However, ultimately calls being added at strikes above is a net positive. The S&P implied vol is the lowest it has been in two years. As a result, it's hard not to view this market as becoming a crowded long trade. This seems to be reflected in the rolling nature of the chase, first AI, now onto small caps and memes.

@spotgamma
S&P technical levels have support at 4280, then 4250, with resistance at 4315, then 4325.

@AdamMancini4
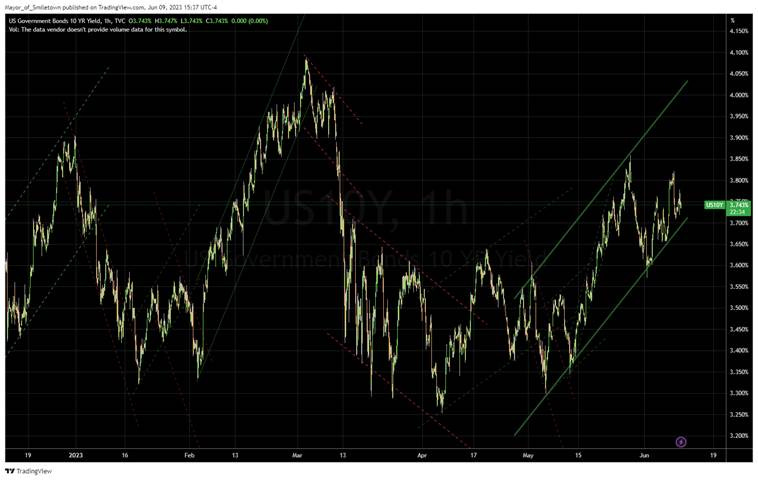
Treasuries are lower, with the 10yr yield rising to 3.74%, higher by around 2 bps on the session, while the 5s30s curve is flatter by 6 bps on the session, moving to -3 bps.
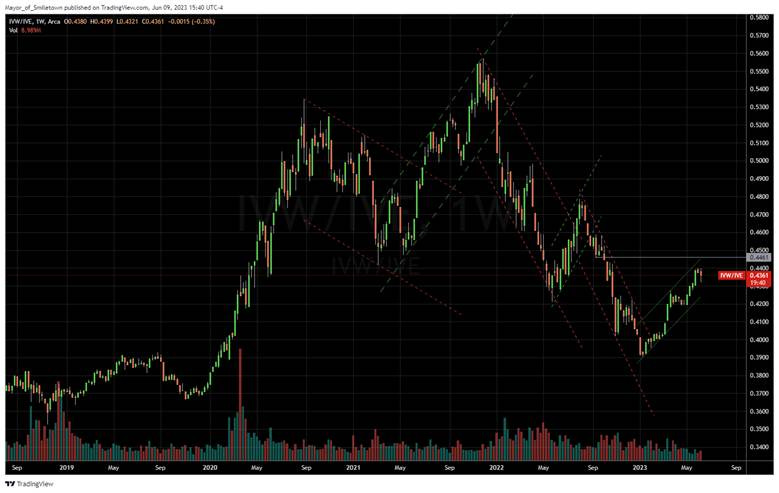
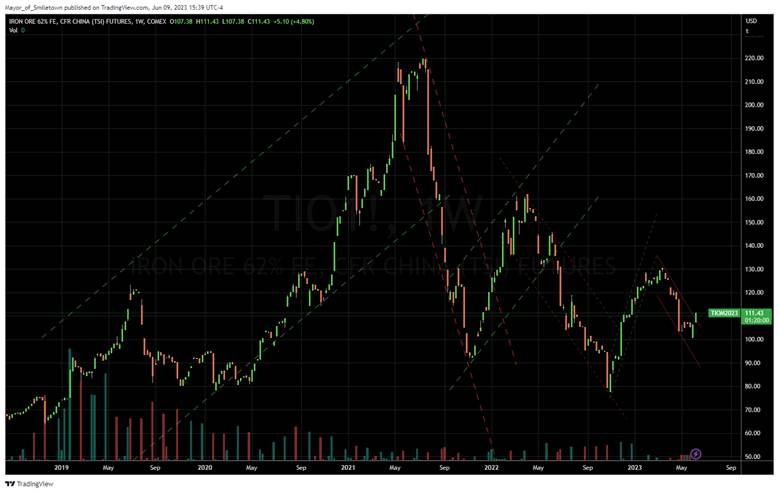
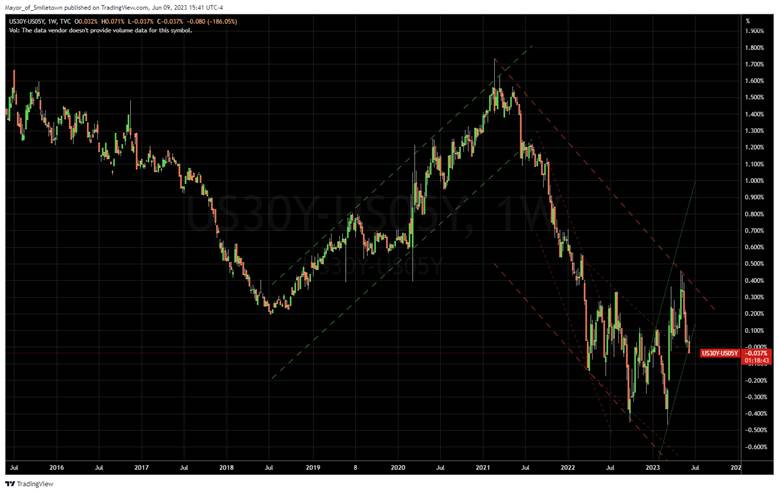
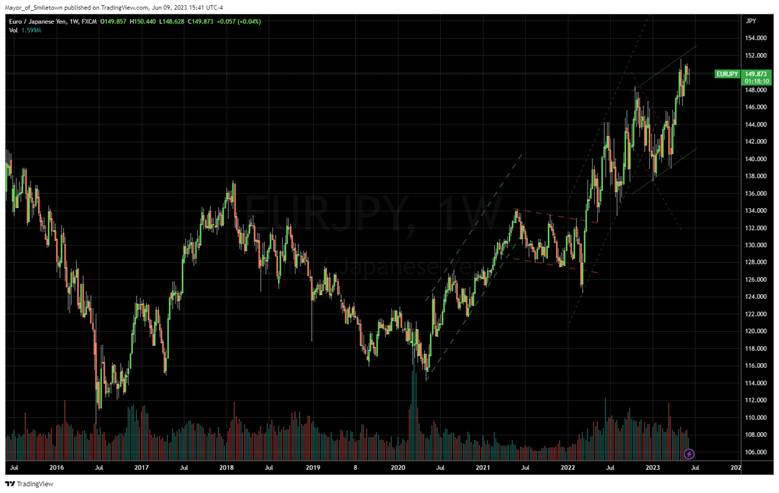
Four Key Macro House Charts:
Growth/Value Ratio: Value is higher on the day and week, with Small-Cap Value the best-performing size/factor on the week.
Chinese Iron Ore Future Price: Iron Ore futures are higher on the day and the week.
5yr-30yr Treasury Spread: The curve is flatter on the day and the week.
EUR/JPY FX Cross: The Euro was stronger on the day but little changed on the week.
Other Charts:
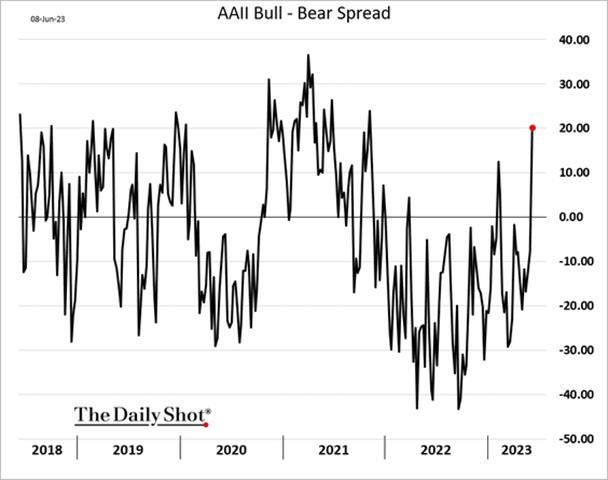
The AAII bull-bear spread soars to highest level since Nov 2021 as bulls (44.5) > bears (24.3) for the first time in 16 weeks. - @WillieDelwiche
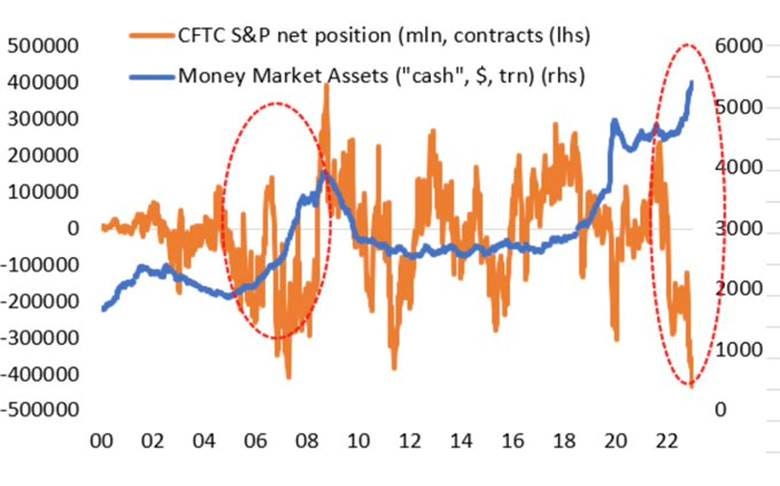
“The dry tinder for a melt-up has grown exponentially. The short positions are at even more dramatic levels than during the GFC. The amount of ‘cash’ in money market funds has swollen .. over 60% of the Fed’s balance sheet ..” - @NewEdgeWealth
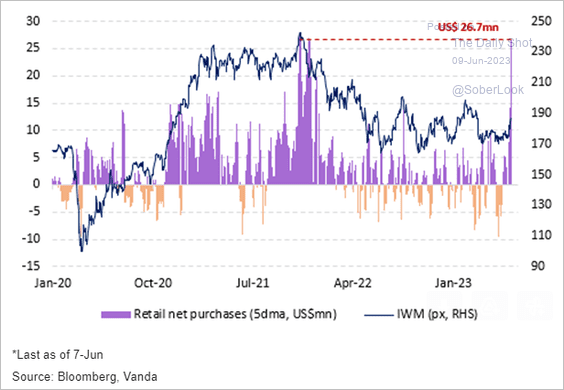
Retail traders have reentered the market in size and are favoring small-caps
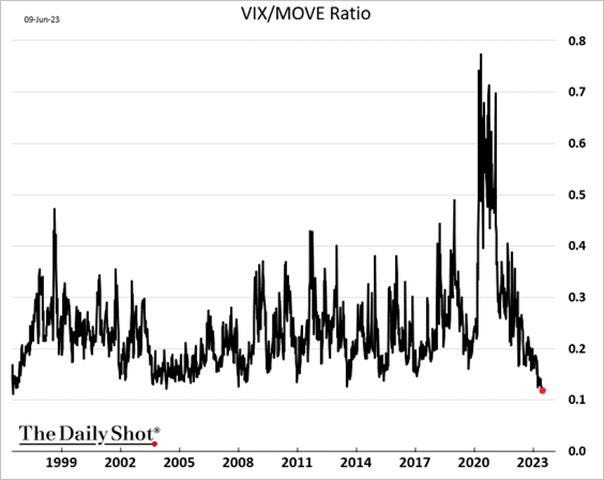
The VIX/MOVE ratio reached its lowest level since 1996, reflecting a stark contrast between stock investors’ calmness and rates investors’ relative unease. - @SoberLook
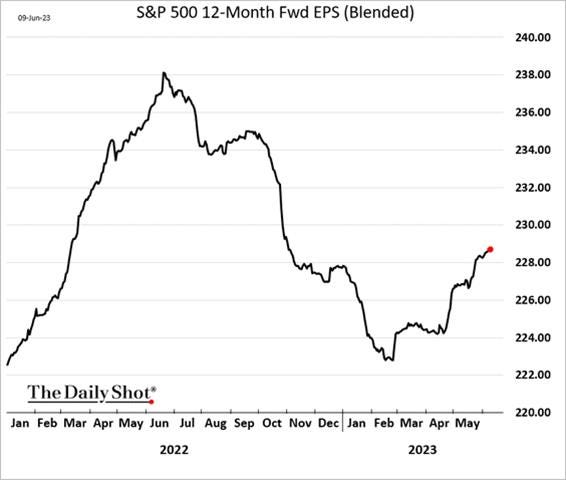
Forward earnings estimates continue to creep higher, helping the current rally; however, P/E ratios are also rising
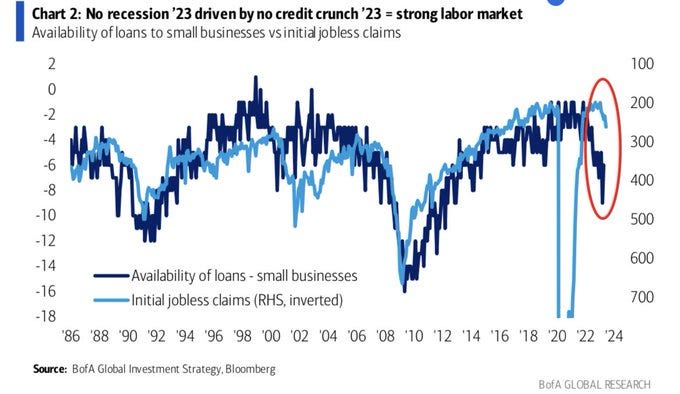
“Watch the “quiet credit crunch .. 30 large US companies defaulted in the past 5 months, 11 in the past 4 weeks .. just as unemployment claims turning higher .. interrupts new ‘no recession ‘23’ narrative ..” - BofA Hartnett
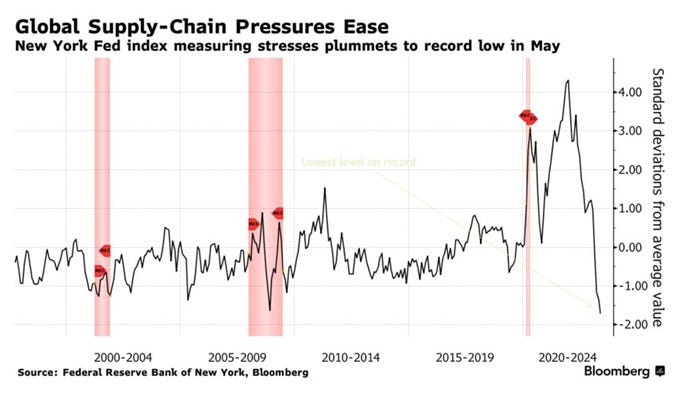
The NY Fed’s Global Supply Chain Pressure Index fell to -1.71 in May from -1.35 the month before, marking the lowest level on record in data stretching back to 1997, according to data published Tuesday. It peaked at 4.31 in December 2021.
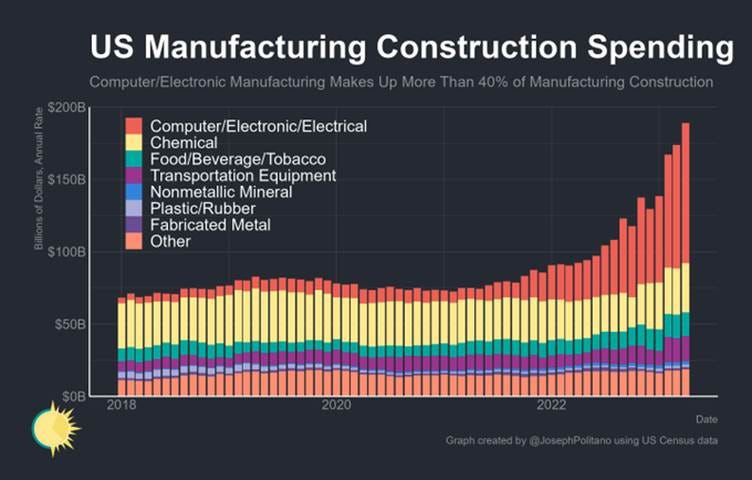
The US manufacturing construction boom keeps growing. There has been a large increase in computer/electronic manufacturing thanks to the CHIPS Act and massive increases in transportation equipment thanks to the IRA. - @JosephPolitano
Articles by Macro Themes:
Medium-term Themes:
China’s Post-Pandemic Life:
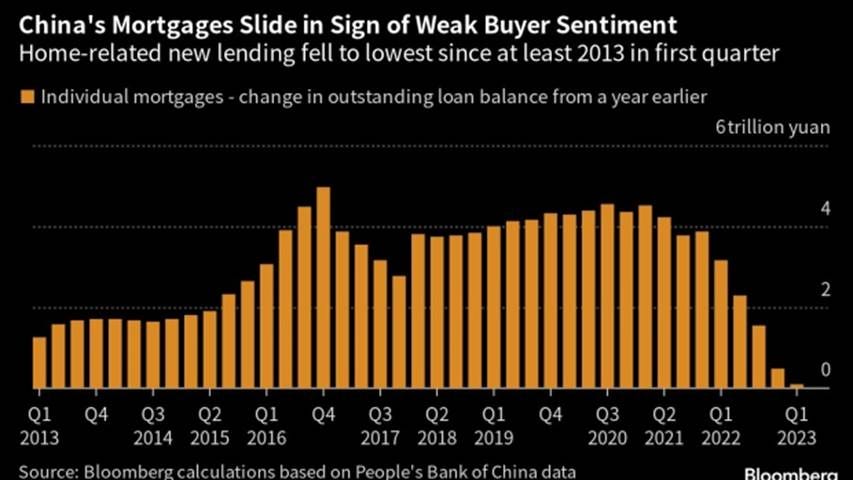
Key Drag: China is working on a new basket of measures to support the property market after existing policies failed to sustain a rebound in the ailing sector. Regulators are considering reducing the down payment in some non-core neighborhoods of major cities, lowering agent commissions on transactions, and further relaxing restrictions for residential purchases. The government may also refine and extend some policies laid out in the sweeping 16-point rescue package it rolled out last year, the people said. The plans have yet to be finalized and may be subject to change. Separately, China is set to extend incentives for electric-vehicle purchases as it views the foundation of the economic recovery as not yet solid. - China Mulls New Property-Market Support Package to Boost Economy – Bloomberg
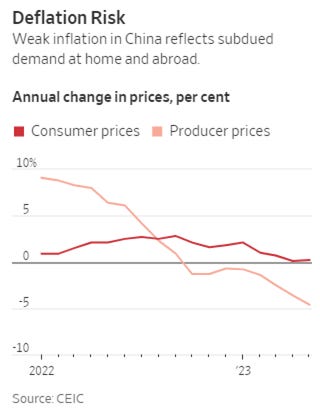
Deflation: Prices charged by Chinese factories tumbled in May at their steepest annual pace in seven years, while consumer prices barely budged. In remarks made at a meeting Wednesday and published by China’s central bank after the release of monthly inflation data Friday, central-bank Gov. Yi Gang said he expects consumer-price inflation to edge up in the second half of the year and exceed 1% in December. He said the People’s Bank of China would use its tools to support the economy and promote employment. Falling prices in China aren’t necessarily bad news for the global economy, as lower costs to import Chinese goods should help bring down inflation rates that, for many economies, are still uncomfortably high. “In a sense, China is already exporting deflation to the world,” said Carlos Casanova, senior Asia economist at Union Bancaire Privée in Hong Kong. That could help ease the pressure on the U.S. Federal Reserve and other central banks that are battling to bring down inflation, he said. - China’s Inflation Problem? It Has None – WSJ
Longer-term Themes:
Cyber Life and Digital Rights:
Really Fake News: This week, a video from Republican presidential candidate Ron DeSantis included apparently fake images of former President Donald Trump hugging Anthony Fauci. It's the latest example of how rapidly evolving AI tools are supercharging political attacks by allowing politicians to blur the line between fact and fiction. The rapid improvement and deployment of generative AI, which can produce realistic images, audio, video, and text, is raising alarms over how it could worsen the spread of misleading claims and propaganda and be used to create entirely plausible yet false depictions of events that never happened. - DeSantis campaign shares apparent AI-generated fake images of Trump and Fauci - NPR

A.I. All Day:
Combating Technology: While artificial intelligence is rapidly improving, and some economists predict the technology will put millions of workers out of jobs, labor unions are fighting against it. In bargaining sessions, AI is increasingly becoming a central sticking point. Some unions have recently made strides, such as Hollywood directors who struck a tentative agreement Saturday with motion picture studios and garnered promises that they “will not be replaced” by artificial intelligence. It was one of the first concessions organized labor has gotten regarding AI protections. But it will be a far messier and longer fight for other industries, according to economists. Union membership is declining, corporations hold more sway in bargaining fights, and labor unions must find messaging that appeals to cost-cutting leaders, these experts added. - From airlines to Hollywood, workers are fighting to keep AI at bay – Washington Post

Energy’s Midlife Crisis:
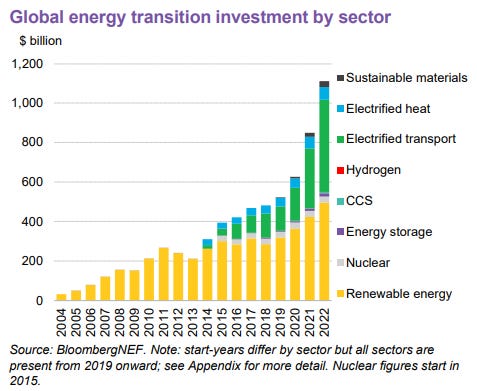
Transition Update: In 2022, global energy transition investment totaled $1.1 trillion, up 31% on the prior year and the first time the figure has been measured in trillions. This figure includes investment in projects, such as renewables, storage, charging infrastructure, hydrogen production, nuclear, recycling, and CCS, as well as end-user purchases of low-carbon energy tech, such as small-scale solar, heat pumps and zero-emission vehicles. While renewable energy remained the largest sector at $495 billion (up 17% YoY), electrified transport is growing much faster and hit $466 billion (up 54%). China is by far the largest contributor, accounting for just under half of global energy transition investment. The US is a distant second. Energy transition investment is on the brink of overtaking fossil fuel investment for the first time. Both are estimated at $1.1 trillion in 2022. But transition investment could average more than 3x this level for the rest of this decade. Climate-tech companies raised a total of $119 billion from global public equity markets and private investors in 2022, down 29% from the year before. Investment in clean energy manufacturing facilities grew to $79 billion in 2022. - Energy Transitions Investment Tredns in 2023 – BloombergNEF
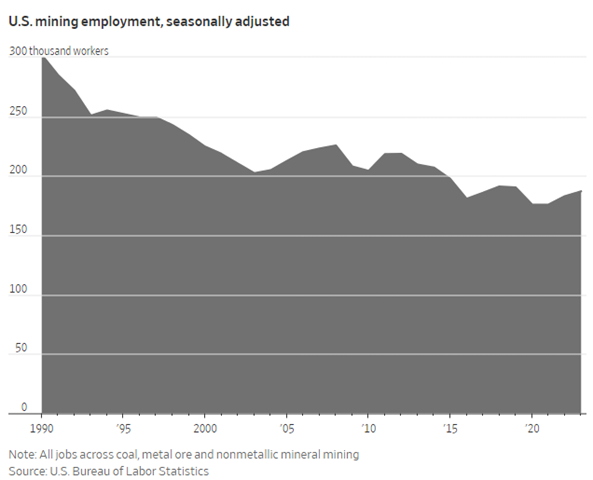
Workers Needed: Multinational companies and startups in the US mining industry are competing for labor with more generous benefits and sustainability commitments to rehabilitate the industry’s image for dirty and sometimes dangerous work. The push comes as the green-energy transition is expected to jack up demand for mined materials, and the US works to increase domestic production and reduce reliance on metals-rich China. Some investors say the challenge of meeting those goals will power higher prices for commodities such as copper, lithium, nickel, tin, and zinc in coming years. - ‘War for Talent’ at Mines Could Drive Up Cost of Energy Transition – WSJ
Slowing Things Down?: Democrats wanted a deal to mandate more transmission immediately, and Republicans hoped for new limits on litigation against infrastructure projects. Instead, the deal called for 2½ years of studies of a proposal requiring the nation’s big power regions to share electricity during peak periods. Critics say the transmission study is a costly delay to badly needed upgrades to the nation’s grid, including increases in long-range transmission across regions. As more clean-energy supply is installed across the country, more and longer power lines are required to move that electricity to the places that need it. Members of both parties and energy-policy experts expect lawmakers to revisit the topic. “This was a starting point, and we are going to make sure that we can get clean energy expanded by working on transmission in the future,” said Shalanda Young, director of the Office of Management and Budget, who helped negotiate the agreement on behalf of the White House, in a press briefing. - Electricity Transmission Plan Likely to Get New Look in Washington – WSJ

ESG versus the World:
Planting Trees?: The market for carbon offsets is estimated to be about $2 billion today. By mid-century, BloombergNEF projects it could grow to anywhere from $160 billion to $624 billion annually. However, the UN may declare nature-based solutions the one and true way to remove carbon from the atmosphere and effectively ice a growing industry out of the market it’s trying to serve, potentially imperiling the climate. In essence, the world currently has two choices: pay a little money for nature-based solutions or pay a premium for more durable removal. Both natural and technological approaches can be effective ways to stave off the most catastrophic impacts of global warming. Hence the UN draft document tilt might not sound like a big deal, but to the carbon removal industry, it’s existential. - A Major Showdown Is Brewing Over What Counts as a Carbon Credit – Bloomberg

Pushback: On Wednesday, Exxon Mobil and Chevron’s shareholders struck down a raft of proposals urging the companies to cut greenhouse-gas emissions derived from fuel consumption, put out new reports on climate benchmarks, and disclose certain oil-spill risks, among other initiatives. The votes were abysmal for climate activists. According to preliminary results, all but two of the 20 shareholder proposals for the two companies garnered less than 25% of investors’ votes, with some performing much worse than similar proposals put forward last year. In recent weeks, similar climate proposals failed to win over most shareholders at annual meetings of British oil and gas giants BP and Shell. These failures demonstrate how some shareholders have backed off from pushing major oil companies to embrace certain climate goals. Investors said many voices pushing ESG measures had been drowned out following Russia’s war in Ukraine, which caused oil and gas prices to skyrocket as global supplies were crimped. - ESG Blowback: Exxon, Chevron Investors Reject Climate Measures – WSJ

Cold Places (Deep Sea, Artic, and Space Colonization):
Silent Bark: The US Space Force is set to launch a constellation of satellites this summer to track Chinese or Russian space vehicles that can potentially disable or damage orbiting objects, the latest step in the burgeoning extra-terrestrial contest between superpowers. Dubbed “Silent Barker,” the network would be the first of its kind to complement ground-based sensors and low-earth orbit satellites. “This capability enables indications and warnings of threats” against high-value US systems and will “provide capabilities to search, detect, and track objects from space for timely threat detection,” the Space Force said in a statement. - New US Spy Satellites to Track Chinese, Russian Threats in Orbit - Bloomberg

Clear Dilemma: Western countries are worried that China and Russia could try to exploit growing geopolitical tensions in the Arctic to increase their influence over the region and its abundant natural resources. The seven western members of the Arctic Council, the main regional body, stopped cooperating with Russia on everything from protecting the environment to discussing the rights of indigenous people after its full-scale invasion of Ukraine last year. Russia’s relations with China over the Arctic have traditionally been tense. But since the start of Russia’s invasion of Ukraine, that appears to be changing. During a visit by Chinese leader Xi Jinping to Moscow in March, the two sides announced the creation of a joint working body for the development of the Northern Sea Route, a shipping route, and Russia’s flagship Arctic development project. The bottom line, Russia’s de facto exclusion from the council creates a “clear dilemma.” One senior Arctic policymaker said, “On the one hand, the agenda we want to promote in the Arctic doesn’t make much sense without Russia. It makes up 40 percent of the Arctic. On the other hand, we can’t cooperate with Russia right now. This is what we’re struggling with.” - Arctic chill: western nations fear China and Russia will exploit regional tensions - FT.

Lots of Life: A remote area of the Pacific Ocean seafloor contains mineral-laden nodules that could power electric-vehicle batteries, wind turbines, and consumer electronics. However, researchers recently discovered that 90% of the marine creatures living near the potato-size nodules are new species, challenging the idea that the vast mining area is an ecological wasteland. The research on the biodiversity of marine life in the zone will be reviewed by the International Seabed Authority, a United Nations-affiliated agency that regulates access to seafloor mining in the zone. Delegates to the authority are devising new rules to oversee deep-sea mining, which must be approved before companies can apply for a license. The authority has granted exploration contracts of the mining area to several nations, including China, Russia, Korea, France, Germany, the UK, and India, many of whom are partnering with commercial firms. - Thousands of New Species Discovered in Ocean Area Targeted by Deep-Sea Miners – WSJ

Other Articles of Interest:
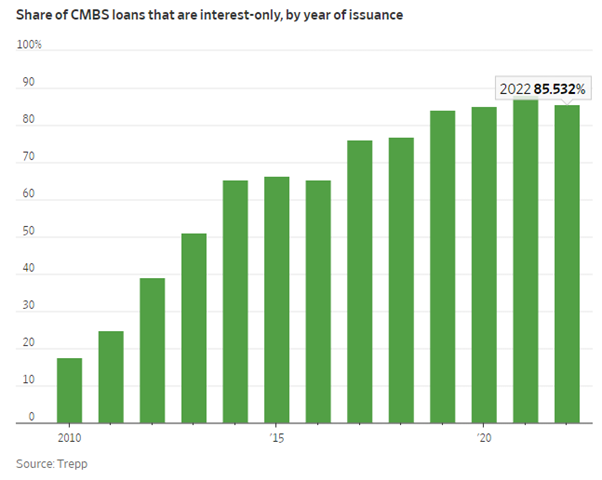
Unfortunate Collision: Nearly $1.5 trillion in commercial mortgages are coming due over the next three years, according to data provider Trepp. Many of the commercial landlords on the hook for the loans are vulnerable to default in part because of the way their interest-only loans are structured. Interest-only loans as a share of new commercial mortgage-backed securities issuance increased to 88% in 2021, up from 51% in 2013, according to Trepp. Typically, owners pay off this debt by getting a new loan or selling the building. Now, steeper borrowing costs and lenders’ growing reluctance to refinance these loans are raising the likelihood that many of them won’t be paid back. - Interest-Only Loans Helped Commercial Property Boom. Now They’re Coming Due. – WSJ
Podcasts and Videos:
“It’s a bond picker’s market” - Guggenheim Macro Markets Podcast
Soros’ CEO Fitzpatrick on Coming Contraction in Credit - Youtube
VIEWS EXPRESSED IN "CONTENT" ON THIS WEBSITE OR POSTED IN SOCIAL MEDIA AND OTHER PLATFORMS (COLLECTIVELY, "CONTENT DISTRIBUTION OUTLETS") ARE MY OWN. THE POSTS ARE NOT DIRECTED TO ANY INVESTORS OR POTENTIAL INVESTORS, AND DO NOT CONSTITUTE AN OFFER TO SELL -- OR A SOLICITATION OF AN OFFER TO BUY -- ANY SECURITIES, AND MAY NOT BE USED OR RELIED UPON IN EVALUATING THE MERITS OF ANY INVESTMENT.
THE CONTENT SHOULD NOT BE CONSTRUED AS OR RELIED UPON IN ANY MANNER AS INVESTMENT, LEGAL, TAX, OR OTHER ADVICE. YOU SHOULD CONSULT YOUR OWN ADVISERS AS TO LEGAL, BUSINESS, TAX, AND OTHER RELATED MATTERS CONCERNING ANY INVESTMENT. ANY PROJECTIONS, ESTIMATES, FORECASTS, TARGETS, PROSPECTS AND/OR OPINIONS EXPRESSED IN THESE MATERIALS ARE SUBJECT TO CHANGE WITHOUT NOTICE AND MAY DIFFER OR BE CONTRARY TO OPINIONS EXPRESSED BY OTHERS. ANY CHARTS PROVIDED HERE ARE FOR INFORMATIONAL PURPOSES ONLY, AND SHOULD NOT BE RELIED UPON WHEN MAKING ANY INVESTMENT DECISION. CERTAIN INFORMATION CONTAINED IN HERE HAS BEEN OBTAINED FROM THIRD-PARTY SOURCES. WHILE TAKEN FROM SOURCES BELIEVED TO BE RELIABLE, I HAVE NOT INDEPENDENTLY VERIFIED SUCH INFORMATION AND MAKES NO REPRESENTATIONS ABOUT THE ENDURING ACCURACY OF THE INFORMATION