

Reduced Treasury Supply, Higher Productivity, Looser Labor Markets, and Slowing Growth Support a More Dovish Fed and Lower Yields/Higher Equities - Midday Macro – 11/3/2023
Reduced Treasury Supply, Higher Productivity, Looser Labor Markets, and Slowing Growth Support a More Dovish Fed and Lower Yields/Higher Equities - Midday Macro – 11/3/2023
Color on Markets, Economy, Policy, and Geopolitics

Reduced Treasury Supply, Higher Productivity, Looser Labor Markets, and Slowing Growth Support a More Dovish Fed and Lower Yields/Higher Equities
Midday Macro – 11/3/2023
Market’s Weekly Narrative and Headlines:
It was another historic week for markets, with massive declines in yields and rises in equities as highly negative risk sentiment last week completely reversed due to a perfect storm of positive catalysts. First, the Treasury’s refunding announcement reduced long-end supply fears, finally allowing for a more meaningful rally in Treasuries. Second, Powell sounded more dovish in the Q&A part of the November FOMC press conference, leading markets to believe the Fed is done raising rates. Finally, the batch of labor-related data indicated reduced tightness on the aggregate and increased productivity, both things that reduce inflationary pressures. The ISM PMIs also indicated a cooling in the service sector while manufacturing activity contracted further. This was further supported by weaker Dallas Fed PMI readings, although factory orders and construction data remained more resilient. In the end, given the extreme levels of negative sentiment and bearish positioning, what started out as a relief rally in both Treasuries and equities quickly took a life of its own, with the most hated sectors/factors seeing the greatest gains on the week as short position coverings and flows driven to right previously under-allocated sectors drove price action. Elsewhere, oil prices fell on the week, with WTI now a little above $80 due to reduced geopolitical risk premium and weaker seasonal demand. On the other side, copper was higher on the week, as were other industrial metals, as the situation in China continued to look more favorable despite weaker PMI readings there, while global growth is showing a few signs of improving more generally, albeit unevenly. The agg complex was also higher, mainly due to stronger demand for beans, as wheat and corn were little changed on the week. The dollar took a notable dive this week, as would be expected given the drop in yields and hence favorable rate differentials, with the $DXY dropping to 105 to end the week.

Deeper Dive:
No “Deeper Dive” this week. Next week, we plan to give a more comprehensive tally of the good and bad narratives occurring at the macro level and what this means for markets. As for now, we see the whipsaw price action as problematic for investing in general and are happy to have low gross/net exposure currently. We also have low conviction the somewhat violent and chaotic rebound that Treasuries and risk assets had this week is sustainable, given the macro headwinds we have highlighted for some time. We recommend readers remain tactical and do not chase price action. However, we also acknowledge there have been positive fundamental developments that indicate Treasury yields may have peaked for this cycle and, as a result, support risk assets having a Santa Clause rally. It’s too early to tell and we want to be careful with our analysis, given the high level of uncertainty.

As always, thank you for reading, and please share our newsletter. Feel free to reach out with any questions or comments. - Michael Ball, CFA, FRM
Policy Talk:
The Federal Reserve policy-setting Federal Open Market Committee voted on Wednesday to maintain the target range for federal funds rate at 5 ¼ to 5 ½ for a second straight meeting. The official statement was little changed, upgraded the economic activity assessment to “strong” from “solid” and categorizing job gains as “moderating” from “slowing.” The committee continued to see the banking system as “sound and resilient.” Still, the statement added that tighter financial conditions, as well as credit conditions, would “likely” weigh on economic “activity, hiring, and inflation.” There were no descents.

Chairman Powell maintained a more hawkish tilt in his initial press conference statement but a greater acknowledgment of tighter financial conditions, meaning policy had become more restrictive and less pushback on adherence to the SEPs Fed fund projections during the Q&A led market participants to see more dovishness between the lines. Powell acknowledged the stronger-than-expected level of growth in the third quarter but went on downgrade previously seen strength in the housing market and noted that higher rates “appeared” to be weighing on business investment. The prepared remarks went on to highlight that the demand and supply of labor was “coming into better balance,” noting better labor force participation and reduced nominal wage growth. He concluded his remarks by noting that tighter financial conditions had increased the uncertainty on how restrictive policy is. As a result, the committee would move more cautiously and continue to focus on the “totality” of the data. The prevailing view now is that the Fed is likely done raising rates.
“There are really two processes at work here, one of which is the unwinding of the distortions to both supply and demand from the pandemic and the response to the pandemic, and the other is restrictive monetary policy, which is moderating demand and giving the supply side time and space to recover. A significant increase in the size of the labor market now, both from labor-force participation and from immigration, is a big supply-side gain that is really helping the economy. And it's part of why GDP is so high - because we’re getting that supply. So we welcome that. But I think those things will run their course, and we're probably still going to be left with some ground to cover to get back to full-price stability. And that's where monetary policy and what we do with demand are still going to be important."
“I still believe, and my colleagues, for the most part, I think still believe, that is likely to be true. It is still likely to be true—not a certainty, but likely—that we will need to see some slower growth and some softening in the labor market—in labor-market conditions to get—you know, to fully restore price stability.”
“So I think what we can say is that financial conditions have clearly tightened, and you can see that in the rates that consumers and households and businesses are paying now and over time, that will have an effect. We just don’t know how persistent it’s going to be, and it’s tough to try to translate that in a way that I’d be comfortable communicating into how many rate hikes that is.”
“…it’s fair to say that’s the question we’re asking, is should we hike more? It’s not—it’s not—you know, and that is the question. And you’re right that in September, we wrote down one additional rate hike. But, you know, we’ll write down another forecast, as you know, in December.”

The New York Fed's inflation gauge that attempts to capture the underlying inflation trend called the "multivariate core trend," rose to 2.9% in September. August was revised up to 2.6% from 2.5%.

The National Financial Conditions Index (NFCI) ticked up to –0.34 in the week ending October 27, suggesting financial conditions tightened.

U.S. Economic Data:
Nonfarm payrolls rose by 150K jobs in October, following a downwardly revised 297K in September and below market forecasts of 180K. Job gains occurred in health care (58K), government (51K), construction (23K), social assistance (19K), leisure and hospitality (19K), and professional and business services (15K). On the other hand, employment in manufacturing declined by -35K, way more than forecasts of a 10K fall, reflecting a 33K drop in motor vehicles and parts that was largely due to strike activity. The unemployment rate increased to 3.9% in October, slightly exceeding market expectations and the previous month's figure of 3.8%. The U6 rate increased to 7.2% from 7% in the prior month. The number of unemployed individuals rose by 146K to 6.51 million, while the count of employed individuals decreased by 348K to 161.2 million. The employment rate declined to 60.2% from September's 60.4%, and the participation rate slightly decreased to 62.7% from 62.8%. Average hourly earnings increased by 0.2% in October, after an upwardly revised 0.3% increase in September and just below market estimates of 0.3%. This moved the annual increase to 4.1%, down from 4.3% in the prior month. The average workweek fell slightly by 0.1 hour to 34.3 hours, compared with market estimates of 34.4 hours. In manufacturing, the average workweek was little changed at 40.0 hours, and overtime edged down by 0.1 hours to 2.9 hours.
Key Takeaways: This was a “goldilocks” jobs report for the Fed in many ways, as it showed that labor markets continued to move into a better supply and demand balance. The risk of a recession remained capped even as payrolls in October were below the average monthly gain of 258K over the prior 12 months but remained well above the 70K-100K needed per month to keep up with the growth in the working-age population. The labor market remains tight, though, with the ratio of job vacancies (measured at the end of September) to the number of unemployed job seekers (measured in the middle of October) at 1.47 (versus 1.49 in the prior month and a peak of 2.02 in April 2022) well above the prep-pandemic average of 1.20 in 2019. With labor markets cooling and wage pressures subsiding, it is hard to see the Fed hiking in December. However, until the totality of the data indicates a below-trend period of growth, which this report did not, a further hike may still be on the table.

*October’s NFP gains of 150K were below the three-month average of 204K

*The household survey, where we get the unemployment rate data from, saw a decline of -348k, the most since April 2020

*The UER looks to have bottomed, as the household survey is indicating a higher level of job losses

*Average hourly earnings continued to trend lower in October, reducing wage-spiral worries

*Average workweeks continue to trend lower with manufacturing overtime hours also stable
The number of job openings increased to 9.55 million in September, reaching the highest level in four months and exceeding the market consensus of 9.25 million. During the month, job openings grew in accommodation and food services (+141K) and in arts, entertainment, and recreation (+39K). Conversely, job openings declined in other services (-124K), the federal government (-43K), and information (-41K). Regarding regional distribution, job openings rose in the South (+126K) and the Northeast (+26K), while they declined in the West (-72K) and the Midwest (-24K). The number of hires and total separations was little changed, coming in at 5.9 million and 5.5 million, respectively. Within separations, quits were 3.7 million, and layoffs and discharges were 1.5 million, both changing little.
Key Takeaways: The total job openings rose modestly, increasing by 56K in September from a downwardly revised level in August. The ratio of vacancies to unemployment (V/U) was 1.50 in September versus 1.49 in August, which means no progress in reducing the excess demand for labor, according to this data series. The quits rate held steady at 2.3%, which is a level that prevailed throughout the third quarter and is in line with the quits rate in 2018-19. Layoffs fell in September to 1.52 million from 1.88 million in August, resulting in a layoff rate of 1.0%, below the 1.2% rate seen in 2018-2019. As a result, there was no meaningful change in labor market trends through the end of September. However, comments seen in PMIs elsewhere indicate that firms may be moving from hiring attrition over last winter to hiring freezes this summer to soon-to-be layoffs as worries demand will meaningfully finally fall.

*Job openings increased by 56K in September, more than expected

*September’s increase was driven by openings in low-wage service sector jobs, mainly in the accommodation and food services sector

*The number of job openings per unemployed remains well above pre-COVID levels, however, the quits rate (voluntary resignations) is back to pre-pandemic levels

*Hires and separations are slowing broadly, layoffs little changed, and openings generally grew outside of the government
The ISM Services PMI fell to 51.8 in October from 53.6 in September and below forecasts of 53. Demand and activity readings were mixed in direction but still broadly expansionary. Business Activity and Production (54.1 vs. 58.8) fell on the month, while New Orders (55.5 vs. 51.8) expanded at a faster pace. The Backlog of Orders (50.9 vs. 48.6) moved slightly above neutral, while New Export Orders (48.8 vs. 63.7) fell notably into contractionary territory. Contrasting this was a large increase in Imports (60 vs. 50.6), while Supplier Deliveries (47.5 vs. 50.4) saw their times shorten. Inventories (49.5 vs. 54.2) contracted, and Inventory Sentiment (54.4 vs. 54.8) was little changed, with around 80% of respondents seeing stock levels as “about right.” Employment (50.2 vs. 53.4) fell to a near-neutral reading. Finally, Prices (58.6 vs. 58.9) declined slightly.
Key Takeaways: A mixed report with the headline softening due to declines in employment and production subindex readings. However, new orders and the backlog of orders picked up, indicating stronger monthly demand. "Sentiment among firms is mixed, with some optimistic about the current steady and stable business conditions and others concerned about such economic factors as inflation, interest rates, and geopolitical events. Employment-related challenges are also prevalent, with comments about increasing labor costs, as well as shortages”, Anthony Nieves, Chair of the ISM Services Business Survey Committee said. The price index was little changed in October, with four industries reporting lower prices, compared to ten reporting increases. The current price index reading of 58.6 is near the three-year average ending 2019 of 59.1 and down significantly from the peak during this cycle of 84.5 in December 2021.

*The ISM Service PMI declined on the month due to production expanding at a reduced pace while employment intentions were more neutral

*Demand measures increased while sub-index declines were broader elsewhere

*Comments highlighted labor tightness was still a problem while uncertainty due to rising fuel costs brought on by geopolitical risk created increased uncertainty
The ISM Manufacturing PMI declined to 46.7 in October from its 10-month high of 49 in September, well below expectations of 49. Demand and Activity measures broadly declined. New Orders (45.5 vs. 49.2), the Backlog of Orders (42.2 vs. 42.4) further contracted, while New Export Orders (49.4 vs. 47.4) improved, moving closer to a neutral reading. Production (50.4 vs. 52.5) contracted to a neutral reading. Imports ( 47.9 vs. 48.2) further contracted, aligning with reduced demand. However, Supplier Deliveries (47.7 vs. 46.4) contracted at a slightly slower rate. Inventories (43.3 vs. 45.8) were reduced further, although Customer Inventories (48.6 vs. 47.1) grew slightly due to an increase in respondents seeing levels as “about right.” Employment (46.8 vs. 51.2) took a notable move into contractionary territory due to increased staff reduction. Finally, Prices (45.1 vs. 43.8) contracted at a slower rate.
Key Takeaways: This was the eleventh consecutive month of the ISM Manufacturing PMI indicating contraction. Of the five subindexes that contribute to the headline index, only production was in expansionary territory, and barely, while of the six biggest manufacturing industries, only food and beverage registered growth in October. “Demand remains soft, but production execution is stable compared to September as panelists’ companies continue to manage outputs, material inputs and — more aggressively — labor costs. Suppliers continue to have capacity. Seventy-five percent of manufacturing gross domestic product (GDP) contracted in October, up from 71 percent in September. More importantly, the share of sector GDP registering a composite PMI calculation at or below 45 percent — a good barometer of overall manufacturing weakness — was 37 percent in October, compared to 6 percent in September and 15 percent in August. Three of the top seven industries by contribution to manufacturing GDP fell into this category,” said Tim Fiore, Chair of the ISM Business Survey Committee. Despite this weaker report and comments noting weakness in export orders, panelists indicated that trade appears to be improving. None of the top six industries reported price increases in October, and panelist comments indicated that buyers and suppliers aggressively negotiate price levels for 2024. Electronic components/equipment continued to be in short supply.

*The overall ISM Manufacturing PMI Index declined sharply due to contractionary activity in everything but productions

*New orders and employment readings moved notably lower, now both well in contractionary territory

*Only two manufacturing industries reported growth in October, with sub-index readings and comments indicative of a recessionary period
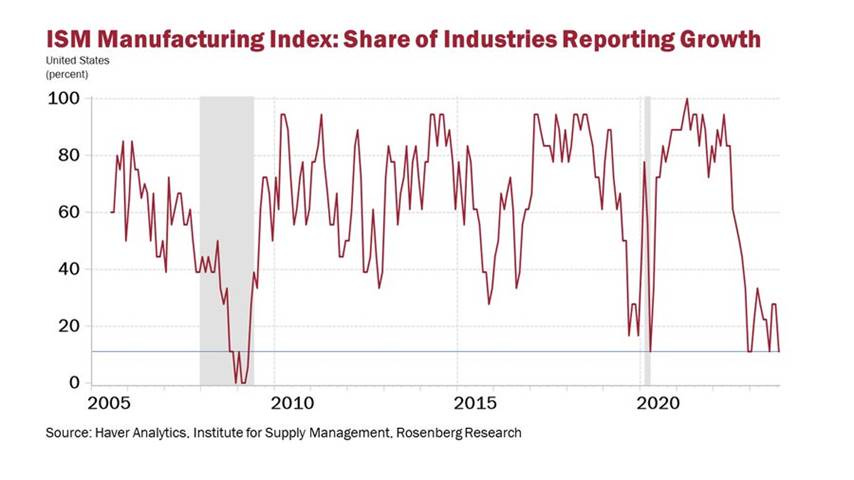
*Today’s ISM showed that a grand total of 11% of industries (2 out of 18) posted any growth in October, the same depressed share as in the spring of 2020 and the fall of 2008. - @EconguyRosie
Compensation costs for civilian workers increased by 1.1% during Q3 ‘23, slightly higher than the previous period and the expected 1.0%. Wages and salaries increased by 1.2%, compared to 1.0% in Q2, while benefit costs increased by 0.9%, the same as in Q2. Compensation costs for private industry workers rose by 1.0%, while state and local government workers saw a greater increase of 1.5%, mainly from a jump in wages and salaries (1.8% vs. 0.8%). This moved the annual increase for employment costs to 4.3% in Q3, down from a 4.5% increase in the second quarter. Nonfarm business sector labor productivity increased by 4.7% in Q3, as output increased by 5.9% and hours worked by 1.1%. On an annual basis, labor productivity is higher by 2.2%. On the quarter, manufacturing sector labor productivity declined by -0.7%, as output decreased by -0.1%, and hours worked increased by 0.7%, moving the annual productivity change to -0.7% from the same quarter a year ago.
Key Takeaways: The increase was mainly driven by increases in state and local compensation, where there was a notable uptick thanks to increases in educational and health service workers (1.5% vs. 0.8%) pay. The ECI component of greatest relevance to the Fed, wages, and salaries for private sector workers, excluding incentive-paid occupations, however, actually slowed in Q3. Goods-producing industries saw a slight uptick in compensation, while service industries were unchanged. At the occupational group level, there were decreases in total compensation growth for management professionals ( 1% vs. 1.2%) and sales and office workers (0.7% vs. 1.1%). Total compensation for transportation and material moving (0.7% vs. 1.2%) workers also declined significantly. The increase in labor productivity is the highest rate since the third quarter of 2020.

*The overall ECI index moved slightly higher on the month due to increases in governement workers

*The Employment Cost Index eased to 4.3%, rolling over from its peak but still relatively strong relative to historical averages

*3Q23 nonfarm productivity (orange) +4.7% q/q vs. +4.3% est. & +3.6% prior (rev up from +3.5%); unit labor costs (blue) -0.8% q/q vs. +0.3% est. & +3.2% prior (rev up from +2.2%) - @LizAnnSonders

“We expect the current productivity growth boom to peak by the end of the decade around 4.0%. That would allow real hourly compensation to grow as much. It would also support greater than expected economic growth while keeping a tight lid on inflation.” - Yardeni
Challenger layoff announcements fell to 37K in October from 47K in September. This compares to 34K in October 2022, an 8.8% increase from year-ago levels. The tech sector led all industries with 6.5K cuts, the most since May, followed by warehousing (4.1K), financial companies (3.4K), and insurers (2.7K). So far this year, employers have announced plans to cut 641.3K jobs, a 164% increase from the 243.3 cuts announced in the first ten months of 2022. The tech sector also leads all industries this year with 158.5K job cuts. Through October, companies have announced plans to hire 760K workers, down 46% from the 1,400.5K new positions employers announced in the same period last year.
Key Takeaways: Job cuts slowed in October, but the total for the year remains well above last year and is the highest January-October total since 2020 and the second-highest total since 2009. “Job cut plans have slowed significantly since the first half of the year, and consumers have continued to spend, even in the face of high inflation… That said, hiring has also slowed, workers are less likely to quit their jobs, and many companies are beginning to recognize the potential for artificial intelligence in their workforces,” said Andy Challenger, Senior Vice President of Challenger, Gray & Christmas. Finally, the seasonal hiring plans are starting to come in and are worth taking a look at in the last table of the report.

*There was an -22% decrease in cuts from last month to 37K

* The technology sector led all industries in October with 6,524, the most since May of this year
The S&P CoreLogic Case-Shiller 20-City Home Price Index rose 2.2% year-on-year in August, above forecasts of a 1.6% rise. Chicago (5%), New York (5%), and Detroit (4.8%) had the largest increases, while the strongest declines were seen in Las Vegas (-4.9%), Phoenix (-3.9%), and San Francisco (-2.5%). Compared to the previous month, house prices rose unadjusted 0.4%, marking a seventh straight month of increases. The MoM increase in the seasonally adjusted Case-Shiller National Index was at 0.9%.
Key Takeaways: This was the seventh consecutive MoM increase following seven straight MoM decreases as low supply continues to increase home prices despite higher mortgage rates. “The year’s increase in mortgage rates has surely suppressed housing demand, but after years of very low rates, it seems to have suppressed supply even more. Unless higher rates or other events lead to general economic weakness, the breadth and strength of this month’s report are consistent with an optimistic view of future results”, says Craig J. Lazzara, Managing Director at S&P DJI.

*Both the S&P Case Shiller and FHFA Price Index were higher again

*Low supply is keeping prices elevated even as demand is falling
New orders for manufactured goods increased by 2.8% in September, after a 1% increase in August. New orders for manufactured durable goods increased by 4.6% MoM, rebounding from two consecutive monthly decreases, led by transportation equipment, which rose by 12.7% MoM. Nondurable goods increased by 1% MoM, versus 2.2% in the prior month, contributing to the bulk of the ex-transportation slowing. Excluding transportation, factory orders increased 0.8% MoM, easing from a 1.5% MoM rise in the prior month. Excluding defense, orders rose 3.2%, following a 0.8% increase. Total shipments slowed to a 0.4% MoM increase versus 1.3% in August, while Unfilled Orders grew by 1.4% MoM, versus 0.3% in the prior month.
Key Takeaways: Despite the strong influence of transportation goods, there were also broad increases in new orders for durable goods elsewhere. Machinery (0.7% vs. 0.5% in Aug), Computers and Electronic Products (1% vs. 0.8%), and Furniture (2% vs. 1.9%) all accelerated further. Primary metals also contracted at a reduced rate, while electrical equipment expanded at a reduced rate. The increase in unfilled orders mainly came from transportation equipment, indicating that although new orders remain positive, capacity utilization continues to fall.

*A large increase in new orders for non-defense aircraft and parts drove the outsized headline gains
Construction spending rose by 0.4% to a seasonally adjusted annual rate of $1,996.5 billion in September, after an upwardly revised 1% increase in August, matching market estimates. Private construction spending advanced by 0.4% MoM, driven by a 0.6% MoM increase in residential housing, particularly in single-family projects, which rose by 1.3% MoM, offsetting a 0.1% MoM decline in multi-unit projects. Construction spending on the non-residential segment increased by 0.1% MoM. Public spending rose by 0.4% MoM, as growth in the non-residential segment (+0.5%) partly offset the drop in the residential one (-3.2%). Yearly, construction spending is higher by 8.7% after September’s results.
Key Takeaways: This was the smallest increase in five months but still indicated a positive rate of growth ending the third quarter. Private single-unit residential construction was a bright spot in the report, breaking out of a multi-month range. Construction spending on manufacturing finally decreased (-0.4% MoM); however, commercial (0.7% MoM) saw an uptick. Power (0.9% MoM) also saw an uptick, while Highway and Street spending was flat.

*Private residential single-home construction is rebounding, supporting overall construction activity
The Conference Board Consumer declined slightly to 102.6 in October from an upwardly revised 104.3 in September. The Present Situation Index declined to 143.1 from 146.2, while the Expectations Index fell slightly to 75.6 from 76.4. The average 12-month ahead inflation expectations increased to 5.9% after holding steady at 5.7% for the past three months.
Key Takeaways: October was the third consecutive month of declines, with both present and expectations worsening as higher prices, specifically for groceries and gasoline, and current events weighed on sentiment. “Consumers also expressed concerns about the political situation and higher interest rates. Worries around war/conflicts also rose, amid the recent turmoil in the Middle East. The decline in consumer confidence was evident across householders aged 35 and up, and not limited to any one income group,” Dana Peterson, Chief Economist at The Conference Board. The weaker assessment of the present situation was driven by worsening views on business conditions, but the current job outlook held steady. When asked to assess their current family financial conditions, the number of ‘good’ replies rose, and those citing ‘bad’ were little changed, suggesting consumer finances remained healthy. However, the expected family financial situation, six months hence, continued to fall. “More than two-thirds of consumers still said recession is ‘somewhat’ or ‘very likely’ in October. The fluctuating soundings likely reflect ongoing uncertainty, given mixed buying plans. On a six-month moving average basis, plans to purchase autos and appliances rose while plans to buy homes continued to trend downward.” Peterson added. The Fed will not take comfort that more than a quarter of households in October still see jobs plentiful versus hard-to-get and the expectation for inflation a year ahead rose to the highest level since May.

*The Consumer Confidence Index declined moderately in October to 102.6

*Both the Present and Expectations Indexes fell on the month mainly due to business condition outlooks

*The labor differential (“jobs plentiful” less “jobs hard to get”) edged higher but is trending lower

*The spread between expectations and current conditions indicators continues to signal a recession ahead.
The Dallas Fed Manufacturing Index declined slightly to -19.2 in October from -18.1 in September. The General Business Activity (-19.2 vs. -18.1) and Company Outlook (-17.1 vs. -17.5) were little changed during the month and remained well in contractionary territory. Current activity and demand measures broadly fell, with notable decreases in the Growth Rate of Orders (-16.8 vs. -7.7) and Unfilled Orders (-12.9 vs. 0.4). The level of Production (5.2 vs. 7.9) expansion slowed while Shipments (-1.4 vs. -1.1) was little changed but remained slightly contractionary. New Orders (-8.8 vs. -5.2) also further contracted. Finished Inventories (-5.3 vs. -6.9) contracted by less, and Delivery Times (-7.8 vs. -1.5) shortened further. Various measures of labor activity also weakened, with Employment (6.7 vs. 13.6) still expanding but at a slower pace. Hours Worked (-2.3 vs. 5.1) contracted, and Wages and Benefits (24.4 vs. 34.8) expanded at a still historically high rate, but that expansion rate fell considerably from the prior month. Price measures fell considerably, with Prices Paid (13.6 vs. 25) halving while Prices Received (-2.1 vs. 1.8) actually contracted. Capex (2.3 vs. -6.8) moved back into expansionary territory. Countering the broadly negative current readings was a notable uptick in the six-month ahead outlook readings. Although still viewed as contractionary, general business activity and company outlook moved closer to neutral. Demand and activity measures all increased further into expansionary territory. Price pressures firmed while employment, although still expanding, cooled slightly.
Key Takeaways: Despite the overall headline index being little changed on the month (and remaining negative for the 18th consecutive month), the majority of sub-indexes worsened, indicating a still negative business backdrop for manufacturers in the Texas region, There was a broad and notable improvement in the six-month ahead readings. Further, outlook uncertainty fell on the month, moving closer to the average level. However, comments by respondents did not echo this sentiment, with many noting increased uncertainty both domestically and globally. Machinery and metals manufacturing comments were the most negative, but generally, comments highlighted slowing demand.

*Current readings broadly weakened, moving the index lower than expected and keeping it in negative territory since the beginning of 2022

*Price received moved back into contractionary territory. However, expectations for future prices rose

*As often seen in regional Fed PMI reports, there was a notable difference between current and future readings
The Dallas Fed’s Texas Service Sector Outlook Survey Index declined to -18.2 in October 2023 from -8.6 in September. The overall Company Outlook (-12.8 vs. -4.4) worsened notably, with the Outlook Uncertainty (23 vs. 14.8) almost doubling. Revenue (0.7 vs. 8.7) fell to a neutral reading. Labor measures all broadly weakened, with actual Employment (0.1 vs. 2.7) falling to a neutral reading, Part-Time Employment (-3.4 vs. -1.7) hiring contracting further, Hours Worked (-1.3 vs. 3) also contracting after growing last month, and finally Wages and Benefits (17 vs. 18.5) growing at a slightly decreased but still robust pace. Price measures marginally slowed, with Input Prices (37.3 vs. 37.6) still expanding strongly, while Selling Prices (9.5 vs. 9.8) edged lower. Capital Expenditures (7.1 vs. 6.5) plans did continue to expand. Six-month ahead readings were also broadly lower; however, outside of the general business activity and company outlook readings remained expansionary.
Key Takeaways: This was the seventeenth consecutive negative reading and the lowest level year-to-date for the Dallas Fed’s Manufacturing Index, which began to “coincidentally” decline when Biden came to office. Despite the negative reading, capital expenditure readings, both current and future, remained expansionary, indicating all hope is not yet lost in Texas. As a result, the continued pressure on input prices versus weaker gains in selling prices may be increasingly weighing on overall sentiment as profit margins continue to be pressured. Comments were mixed but skewed negative, as to be expected with “high uncertainty” often cited. One respondent summed it up best by saying, “something must give. Interest rates, a tightening of capital access, increasing geopolitical turmoil, and more all add up to problematic conditions.”

*The service sector in Texas has remained in contractionary territory for almost two years despite robust growth elsewhere in the U.S. making it truly a unique place

*Sub-index readings broadly weakened in October’s report with uncertainty increasing
Technicals, Positioning, and Charts:
The Russell outperformed the Nasdaq and S&P on the week. Real Estate, Financials, and Communication were the best-performing sectors, while Small-Caps, Momentume, and Growth were the best-performing factors.

@Koyfin
S&P optionality strike levels have the Zero-Gamma Level at 4292 while the Call Wall is 4350 and the Put Wall is 4000.

@spotgamma
S&P technical levels have support at 4355, then 4336, with resistance at 4400, then 4425.

@AdamMancini4
Treasuries are higher on the day, with the 10yr yield lower by 12bp to 4.54%, while the 5s30s curve is steeper by 9bp on the session, moving to 25 bps.

Four Key Macro House Charts:

Growth/Value Ratio: Value is higher on the day and the week, with Small-Cap Value the best-performing size/factor on the week.

Chinese Iron Ore Future Price: Iron Ore futures are higher on the day and the week.

5yr-30yr Treasury Spread: The curve is steeper on the week.

EUR/JPY FX Cross: The Euro is stronger on the day and the week.
Other Charts:

Earnings day moves so far in Q3 are on par with the most negative quarters of the last 15 years. - @Marlin_Capital

"In cumulative notional terms, the combined net selling from August to October across global equities was the second largest over any three-month period in the past 10 years (only Q1 ’22 was larger) and ranked in the 99th percentile." - Goldman Sachs

HOWEVER… After substantial equity sales in recent weeks, hedge funds became net buyers of US stocks over past few days, with breakdown by sector. - @LizAnnSonders
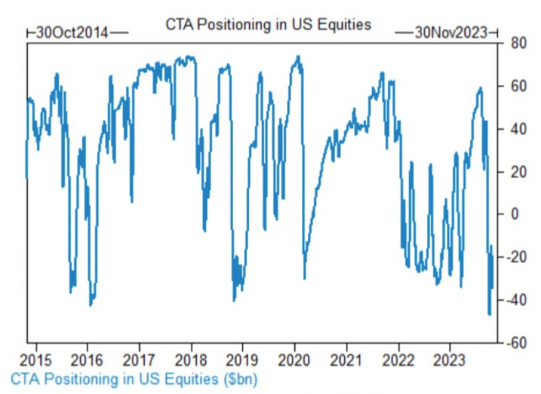
FURTHER… CTAs were short $25 billion of U.S. Equities to start the week, one of the largest short positions in the 8 years. - @Barchart

“The median return for SPX during November is +1.50% going back to 1928. SPX is higher in 10 out of the last 11 November's.” - Goldman Sachs

Increases in real rates were the main driver in rises in nominal Treasury yields in October.

For weeks now, rising yields have been seen as the driver of equities, with both moving in lockstep. That’s resulted in pain for the time-honored portfolio of 60% stocks and 40% bonds. More recently, a Bloomberg gauge of the 60/40 model had slumped roughly 8.4% since July until the recent rebound. While they move together, they offer no diversification. – John Authers - Bloomberg

Foreign holders’ share of the Treasury market continues to trend lower. – @SoberLook

Interest costs as a share of US corporate profits are near the lowest levels in 40 years. This is partly because many companies have locked in long-term financing at low rates - @SoberLook

Commercial real estate lending continued to trend lower in the third quarter, now at its lowest quarterly level in almost a decade.

Implied gasoline demand weakened again last week while inventory levels remain historically high.

October’s Caixin Private Manufacturing PMI report showed a renewed contraction in activity.
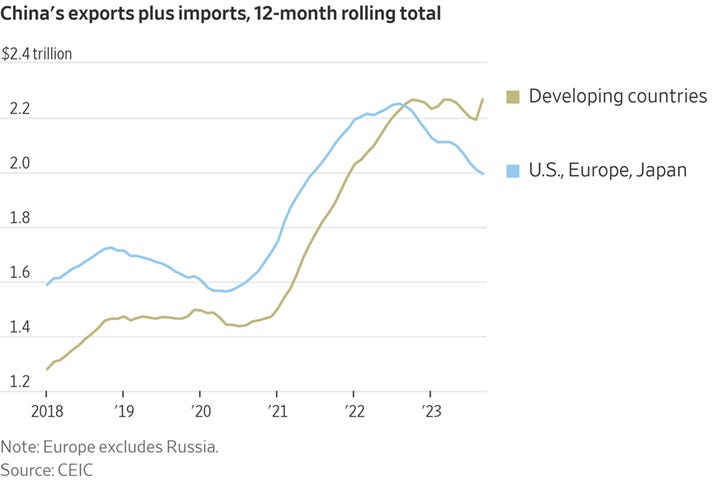
For the first time since its economic opening more than four decades ago, China traded more with developing countries than the U.S., Europe, and Japan combined. It was one of the clearest signs yet that China and the West are going in different directions as tensions increase over trade, technology, security and other thorny issues. - WSJ
Articles by Macro Themes:
China’s Post-Pandemic Life:
Back Down: China’s manufacturing activity unexpectedly contracted in October, underlining the daunting task facing policymakers as they try to revitalize economic growth. Recent indicators pointed to encouraging signs of stabilizing in the world’s second-largest economy, supported by a flurry of policy support measures, although a protracted property crisis and soft global demand remain major headwinds. The PMI fell to 49.5 in October from 50.2, missing forecasts of 50.2. "The weak PMI data may reflect some of the weakness in demand related to the housing slump and a slowdown in infrastructure spending," said Xu Tianchen, senior economist at the Economist Intelligence Unit. "Although there are signs of exports bottoming out, a strong recovery in external demand is probably elusive," he added. - China factory activity unexpectedly shrinks in Oct, dents recovery momentum – Reuters

Longer-term Themes:
A.I. All Day:
Turing Test: On Wednesday morning, the U.K. Government released a document called the Bletchley Declaration, signed by representatives from the 28 countries attending the event, including the U.S. and China, which warned of the dangers posed by the most advanced “frontier” A.I. systems. “There is potential for serious, even catastrophic, harm, either deliberate or unintentional, stemming from the most significant capabilities of these A.I. models,” the declaration said. “Many risks arising from A.I. are inherently international in nature, and so are best addressed through international cooperation. We resolve to work together in an inclusive manner to ensure human-centric, trustworthy, and responsible A.I.” The document fell short, however, of setting specific policy goals. A second meeting is scheduled to be held in six months in South Korea and a third in France in a year. - Global Leaders Warn A.I. Could Cause ‘Catastrophic’ Harm - NYT

Energy’s Midlife Crisis:
Get the Word Out: High-stakes climate and energy decisions are on the ballot in a number of U.S. state-level elections next week. Both Virginia and New Jersey are within a slim margin of flipping from Democratic to Republican control, putting major clean-energy and electric-vehicle initiatives at risk as many voters remain unaware of the economic benefits of Biden administration climate policy. Voters in Texas and Maine, meanwhile, will choose whether to place more control of their electric grids in the hands of fossil-fuel companies. Local governments are also critical gatekeepers for Inflation Reduction Act dollars, having the choice to apply or not for federal loans and grants to support investments in manufacturing facilities, job retraining, building efficiency upgrades, and other measures. So far, most post-IRA clean energy investment has flowed to Republican-majority states. But as the general election approaches, state Republicans may be more cautious about handing Biden any wins, and if next week’s elections consolidate Republican control of states with potential for growing clean energy sectors, the outflow of IRA money could slow. - A referendum on Biden’s climate agenda is coming - Semafor

Not Working: The world’s largest offshore wind developer, Ørsted, has abandoned two important US projects and announced a higher-than-expected write-down of its portfolio, in a big blow to American efforts to develop renewable energy. The offshore wind industry, which has been championed by governments as part of the answer to global warming, has been hit hard by supply chain disruptions, rising costs, and higher interest rates. The challenges have been particularly acute in the US, where the contracts that developers sign typically have less protection against inflation, and the industry’s supply chain is still in its infancy. Mads Nipper, chief executive of Ørsted, said the global offshore industry had been hurt by a “perfect storm.” The pressure, he said, “is the same everywhere, but it is nowhere near as profound as it is in the US market.” - Ørsted shares tumble after company ditches two US wind projects – FT

Mutual Respect: U.S. and Chinese defense officials met briefly Monday at a multilateral security forum in Beijing to discuss communication between the countries' militaries. Chinese Defense Ministry spokesperson Wu Qian and Cynthia Carras, a U.S. Defense Department official in charge of exchanges with China, spoke at the Beijing Xiangshan Forum. In a keynote speech for the forum, Gen. Zhang Youxia, China's top uniformed military official, expressed a desire for greater military exchanges with the U.S. "on the basis of mutual respect, peaceful coexistence and win-win cooperation." Defense dialogue between the U.S. and China broke off after then-U.S. House Speaker Nancy Pelosi visited Taiwan in August 2022. The Chinese People's Liberation Army accepts no attempt by any actor to separate Taiwan from China, with the "One China" principle, in which Beijing views Taiwan as part of China, a "consensus of the international community.” - U.S. and Chinese defense officials meet at Beijing forum – NikkeiAsia

Other Articles of Interest:
Bottoming Out: Nearly four years after the pandemic started, something resembling normalcy is returning to the global semiconductor industry, executives say, signaling a rebound in some areas of technology, although executives caution that the recovery likely won’t be as rapid as the downturn that struck last year. South Korea-based Samsung, the world’s largest memory-chip maker, on Tuesday posted a 38% year-over-year drop in net profit for the third quarter, but it said customers were getting back to normal inventory and that production cuts had eased the supply glut. The company cited growing demand related to artificial intelligence and new personal computers and smartphones incorporating more memory as reasons for optimism. Semiconductor revenue worldwide is expected to fall by about 12% this year but rebound next year by more than 11% to roughly $550 billion, according to International Business Strategies, a chip-industry consulting firm. - After a Boom and Bust, the Chip Industry Is Regaining Its Health – WSJ

VIEWS EXPRESSED IN “CONTENT” ON THIS WEBSITE OR POSTED IN SOCIAL MEDIA AND OTHER PLATFORMS (COLLECTIVELY, “CONTENT DISTRIBUTION OUTLETS”) ARE MY OWN. THE POSTS ARE NOT DIRECTED TO ANY INVESTORS OR POTENTIAL INVESTORS AND DO NOT CONSTITUTE AN OFFER TO SELL -- OR A SOLICITATION OF AN OFFER TO BUY -- ANY SECURITIES AND MAY NOT BE USED OR RELIED UPON IN EVALUATING THE MERITS OF ANY INVESTMENT.
THE CONTENT SHOULD NOT BE CONSTRUED AS OR RELIED UPON IN ANY MANNER AS INVESTMENT, LEGAL, TAX, OR OTHER ADVICE. YOU SHOULD CONSULT YOUR OWN ADVISERS AS TO LEGAL, BUSINESS, TAX, AND OTHER RELATED MATTERS CONCERNING ANY INVESTMENT. ANY PROJECTIONS, ESTIMATES, FORECASTS, TARGETS, PROSPECTS AND/OR OPINIONS EXPRESSED IN THESE MATERIALS ARE SUBJECT TO CHANGE WITHOUT NOTICE AND MAY DIFFER OR BE CONTRARY TO OPINIONS EXPRESSED BY OTHERS. ANY CHARTS PROVIDED HERE ARE FOR INFORMATIONAL PURPOSES ONLY, AND SHOULD NOT BE RELIED UPON WHEN MAKING ANY INVESTMENT DECISION. CERTAIN INFORMATION CONTAINED IN HERE HAS BEEN OBTAINED FROM THIRD-PARTY SOURCES. WHILE TAKEN FROM SOURCES BELIEVED TO BE RELIABLE, I HAVE NOT INDEPENDENTLY VERIFIED SUCH INFORMATION AND MAKE NO REPRESENTATIONS ABOUT THE ENDURING ACCURACY OF THE INFORMATION. I MAY OR MAY NOT HAVE POSITIONS IN ANY STOCKS OR ASSET CLASSES MENTIONED. I HAVE NO AFFILIATION WITH ANY OF THE COMPANIES OTHER THAN EXPLICITLY MENTIONED.