


r** Reached, “F Around and Find Out” Time for the Fed with Increased Two-Sided Risk Management Now Warranted - MIDDAY MACRO WEEKEND READ – 3/17/2023
Color on Markets, Economy, Policy, and Geopolitics

r** Reached, “F Around and Find Out” Time for the Fed with Increased Two-Sided Risk Management Now Warranted - MIDDAY MACRO WEEKEND READ – 3/17/2023
Overnight and Morning Recap / Market Wrap:
Price Action and Headlines:
Equities are lower, ending the week on a negative note, but overall the S&P was flat on the week while the Nasdaq was higher due to yesterday’s notable rally; however, negative bank-related headlines again moved risk sentiment lower, with financials and small-caps leading today’s losses
Treasuries are higher, with the curve notably steeper on the week despite a weaker growth outlook as demand for safety and reduced Fed tightening expectations saw the front-end better bid, driving 2yr Treasury yields lower by 100 bps
WTI is lower, having a significant down week due to the general risk-off tone, reduced IEA demand projections, and continued inventory builds, driving prices to find support three times this week at $66 and ending the onslaught slightly higher, around $67

Narrative Analysis:
Financial stability concerns took center stage last week, and not much has changed, with market price action displaying a unique split between flight to safety and increased exposure to growth and tech due to falling real rates. This is best seen in the notable difference between the Nasdaq's outperformance, which is light on financials, energy, and materials, the biggest losers on the week, verse the small-cap Russell index declines. Today’s price action is again being driven by negative headlines indicating that the liquidity crisis which hit SVB last week is not yet over, as the private injection of capital into First Republic is being viewed as insufficient. Despite these continued concerns and due to today’s large OPEX, equity markets are again negatively chopping around with the VIX higher after somewhat of a breakout of recent ranges yesterday by the S&P. On the other side, the MOVE Index, which measures rate volatility, is off highs as Treasury yields are ending the week near their recent lows, with historic moves lower not only in the U.S. but also in European govies as traders recalibrate the expected path of central bank policy due to the tighter financial condition bank failures have brought and expectations growth, and by relation inflation, will now fall faster. Speaking of big moves, oil had a complete breakdown from its multi-month range, with the IEA changing the game by reducing future demand forecasts while inventory levels continue to remain sticky. The general risk-off mode didn’t help either and also pulled down industrial metals, with copper dropping on the week to a lesser extent. The agg complex also fell on the week, with commodities generally pricing in lower growth expectations despite idiosyncratic supply/demand stories still being problematic. The dollar was flat on the week, with the $DXY giving up mid-week gains and ending the week under 104, as real rates fell while the ECB went through with its increasingly questioned 50bp hike. Now all eyes turn to the Fed’s March FOMC meeting and the message it will bring next week.
The Nasdaq is outperforming the S&P and Russell with Growth, Low Volatility, and Momentum factors, as well as Technology, Communication, and Consumer Staples sectors all outperforming on the day. The week had a unique risk-off tilt with falling yields and worsening growth expectations supporting more duration-sensitive sectors such as Tech and Communication as well as the general flight to safety flows supporting Utilities, Staples, and Health Care. Factor performance followed suit, with small caps being notably hurt by the regional banks, while growth beat value by around 5% on the week.

@KoyfinCharts
S&P optionality strike levels have the Zero-Gamma Level at 4057 while the Call Wall is 4065 and Put Wall is 3800. Today’s large OPEX will reduce implied vol due to the reduction in negative gamma. However, the drop in open interest also weakens many of the downside strikes, like 3850, which have supported markets. This will make 4000 the strike with the largest gamma and maximum resistance. There is unlikely to be a more material decline in implied vol until next week’s March FOMC results.

@spotgamma
S&P technical levels have support at 3935, then 3910 (major), with resistance at 3985, then 4010 (major). We broke out into what could be a strong trend move higher after yesterday’s notable move up out of a week-long chop range, with price action today doing a standard retest of resistance levels that could now be support. Trading after a strong trend move is risky, there is a higher chance of a fake breakout/breakdown, and today’s OPEX indicated a choppy environment was likely coming. A close above the 200-dma would also be positive, while technicals remain neutral to bullish above 3885, the 2022 downtrend line.

@AdamMancini4
Treasuries are higher, with the 10yr yield at 3.30%, lower by 19 bps on the session, while the 5s30s curve is steeper by 15 bps on the session, moving to 12 bps.

Deeper Dive:
As indicated by this week’s title, the Fed has now raised rates to a level that generates financial instability (r**) before hitting the natural real interest rate (r*) that would trend inflation back to target, significantly complicating their road ahead. With indication that credit markets are increasingly feeling the negative effects of liquidity drying up and rate vol, and to a lesser extent equity vol, rising, it is clear that financial conditions have significantly tightened due to the cascading effects of the somewhat sizeable bank failures we are all experts on now. As a result, it is game over for this tightening cycle. Unfortunately, as expressed by the ECB this week, the Fed will still be forced to raise rates one more time, given any inaction or cuts would create a more worrisome signaling effect for markets. As a result, the March FOMC meeting will require a very dovish message to be crafted through the presser, Q&A, and of course, the Summary of Economic Projections (SEPs) that acknowledge that now tighter financial conditions along with the lagged “cumulative effects” of policy to date are reason enough to pause further rate hikes and consider suspending QT. With the Fed’s balance sheet showing a weekly increase of over $300 billion in credit extension but a continuation of asset sales, you have a very mixed message which undermines credibility. This is still a liquidity risk event, but the negative effects of raising rates so quickly mean the underlying pressures that caused poorly risked managed banks to fail due to deposit flight and losses to assets are very applicable to the overall banking system. Until that uncertainty surrounding that settles, likely through the Fed signaling a pause in further tightening, we will continue to endure a choppy volatile headline-driven market environment.
Fed nerds will be familiar with the concept of r**, effectively the real interest rate level where things in the financial system begin to break due to financial conditions tightening too much. As a reminder, financial conditions are measured by movements in price-related indicators, such as interest rate levels, credit spreads, equity prices, the dollar, and the volatility of said things. As they tighten, future economic activity weakens due to access and the cost of capital worsening along with more negative investor, business, and consumer wealth effects and confidence channels. The concept of r** differs from the concept of r*, the theoretical rate level that allows macroeconomic stability and a targeted inflation level to persist, something more commonly discussed in policy debates. We highlight this not to go down an academic rabbit hole but to warn readers that they will be hearing significantly more about the need for the Fed to take a two-sided risk management approach in future policy decisions, managing the worsening financial instability while also remaining focused on price stability goals. As a result, they will look to clarify their “shadow” financial stability third mandate’s importance.

*Traditional financial assets reacted heavily to this week’s risk-off tone, while financial institutions are expected to reduce risk exposure and lending activity moving forward

*The current volatility in rates had the MOVE Index see its largest daily jump and drop this week since the beginning of the pandemic

*Borrowing from primary credit, the new BTFP facility, and FDIC activity drove total assets higher on the Fed’s balance sheet

*As a result of the current “banking crisis,” the path of rates has considerably changed in short order, with almost 100 bps of cuts coming before year-end
Turning to inflation, the now red-headed stepchild of market concerns, this week gave us a mixed picture from a policymaker perspective but a somewhat more realistically positive one that it will continue to trend lower. The CPI report continued to have rising shelter and “super core” prices. Other Fed favorite measures, such as the Clevland Fed’s Median CPI and Atlanta Fed Sticky CPI indexes, also moved higher, showing there is still too broad of an inflationary pulse in progress according to the official data. This was countered by declines in PPI index readings, import prices, and regional Fed surveys showing reduced prices paid and received. When coupled with notable drops in one-year-ahead consumer expectations seen in the NY Fed’s and the University of Michigan consumer sentiment surveys, we take comfort that the uptick in inflationary readings in January was short-lived. However, with policymakers focused on backward-looking, lagged official readings, it is unclear if the mosaic of other deflationary readings this week matters as much as it should in regard to policy decisions. Put simply, with all that’s happened in the last two weeks, the increasing divergence between more up-to-date private data verse lagged official data (both in inflation and labor readings), and no credible case that inflation is becoming more engrained in the consumer psyche while leading labor market readings continue to cool (despite strong NFP gains), reducing wage-spiral worries, the conversation around the FOMC table should begin to change. Further, recent drops in commodity prices and market-derived inflation measures resuming their trend lower should also help convince policymakers to reduce their inflation expectations in the new set of March SEPs.

*PPI leads CPI, and when combined with business surveys showing lower inflationary pressures and better supply chain situations, the trend lower should continue

*The Bloomberg Commodity Index has been methodically trending lower since the peak following Russia’s invasion of Ukraine

*CPI Shelter price readings have remained stubbornly sticky despite expectations they will follow private data rent and official housing price depreciation reading lower

*With the Fed connecting wage rises to core-service ex-shelter inflation stickiness, falling turnovers, and likely significantly lower openings will keep AHEs trending lower
In summary, we now have a Fed that can increasingly make a case for a more two-sided risk approach to policy decisions moving forward, buying time for the official inflation data to increasingly reflect a more realistic picture, one with falling shelter costs and reduced wage pressures on service costs. The worsening financial stability situation has tightened financial conditions, effectively increasing the impact of the cumulative policy tightening to date and reducing the need to tighten further. Market price action indicates a greater chance of a recession. At the same time, inflationary pressures are falling, albeit more unevenly and unclearly than hoped for at this point in the cycle. Effectively the Fed’s period to “F*@% around and find out” is ending. We will now enter the next stage of the cycle, staying at the terminal restrictive policy level and marking-to-market incoming data more neutrally. As a final thought, the failure of “SVB and company” may become a longer-term risk-asset bullish event as it reduces the “higher for longer” heavier drag that could have occurred on risk assets versus the current financial condition tightening that could ease substantially quicker.

*The effects of reduced risk exposure and lower lending activity by regional banks are expected to have a significant drag on growth moving forward

*We are now over half of a year from when the official inflation data looked to have peaked

*Equities have historically risen after inflation has peaked, but things are going a little different this time around

*If the Fed was to stop after this coming March FOMC meeting, it would be a notable surprise to businesses

*The drop in oil caused us to reach our $USO long’s stop level while we reached our $TLT long’s target. We have moved lower stops on Copper, EM, and China equity longs and now have a reduced notional exposure level
Econ Data:
Headline CPI increased 0.4% in February, slowing from a 0.5% rise in January and matching market forecasts. This moved the annual inflation rate down to 6% from 6.4% in January. Core CPI rose by 0.5% MoM, following a 0.4% increase in January and above market expectations of 0.4% MoM. The annual core CPI rate moved to 5.5% from 5.6% in January. The energy index fell by -0.6% MoM after increasing by 2% in January, mainly due to a -8% decrease in natural gas prices. The food index increased 0.4% MoM in February, with the food at home index rising 0.3% MoM and the food away from home index increasing by 0.6% MoM. Core goods were flat on the month mainly due to a drop in used cars and trucks (-2.8% MoM vs. -1.8% MoM), while apparel (0.8% MoM vs. 0.8% MoM) and new vehicles (0.2% MoM vs. 0.2% MoM) monthly increases remained sticky. Shelter (0.8% vs. 0.7% in Jan) was again the largest contributor. Core services ex-shelter rose to 0.5% MoM from 0.4% in January, driven higher by transportation services (1.1% MoM vs. 0.9% MoM), which saw a 6.4% increase in airfares, although medical care fell further (-0.5% vs. -0.4%).
Why it Matters: Not a great report concerning the Fed’s fight against inflation. The majority of the gains again came from the shelter component, while at the headline level, food price increases remained sticky while goods and energy fell. There was no decrease in the rate of core inflation as seen in the three-month annualized basis, rising to 5.2% in February from 4.6% in January and 4.3% in December, which was initially reported at 3.1% before revisions to the seasonal adjustment factors for 2022. The so-called “super-core CPI” (CPI services less energy and rents) rose to 5.2% on a three-month annualized basis and 5.3% on a six-month basis. The Fed has highlighted this sub-index as a good gauge of the secondary effects of past goods inflation, and despite decreases in goods, it remains sticky. The decline in used cars and trucks countered general increases seen elsewhere in core goods, and with expectations for this to increase moving forward given what is being seen in the Manheim Used Car Index, which CPI lags by two to three months, shows that the flat reading from goods this month will likely reverse. The Cleveland Fed’s trimmed mean measure (outlier components are discarded and an average taken of the rest) is still above 6%, while the median measure has topped 7% for the first time. Meanwhile, the Atlanta Fed Sticky CPI index, which divides components whose prices are flexible and sticky, shows sticky price inflation is actually higher than flexible, the opposite of what the Fed wants, as it implies that inflationary psychology is becoming ingrained. Without the current financial stability concerns, this report would have dictated a 50 bps move higher next week from the March FOMC meeting.

*Service inflation, mainly driven by the methodical increase in shelter costs, continues to drive the bulk of the monthly gains

*Despite more up-to-date data pointing to falling housing prices and new leases, “Rent on Shelter” continues to show little change due to the lagged ability to capture more current cost changes

*Transportation cost increases, mainly from auto insurance, are driving higher the much-watched Fed favorite “supercore” index

*In fact, on an annual basis, transportation by far remains the largest contributor, showing despite reduced claims during the pandemic, auto insurance companies were still quick to raise prices during the reopening

*The Cleveland Fed’s Median CPI rose above 7% for the first time, while the Trimmed Mean fell only marginally

*The Atlanta Fed’s measures of “sticky” inflation continue to trend higher while flexible falls
The Producer Price Index fell by -0.1% in February, against market expectations of a 0.3% MoM increase. Core PPI, or final demand less foods, energy, and trade services, increased by 0.2% MoM in February after rising 0.5% in January. The price index for final demand for goods decreased by -0.2% MoM, after a 1.2% rise in January, helped by a -2.2% MoM decline in prices for foods, while energy was marginally lower by -0.2%. Final demand for services fell by -0.1% MoM, the same as in January. Margins for final demand trade services fell by -0.8% MoM, and the final demand for transportation and warehousing services index decreased by -1.1% MoM. Prices for processed goods for “intermediate demand” moved down by -0.4% in February, following a -1.1% increase in January, mainly due to a -4.7% MoM decrease in the cost of diesel. The index for unprocessed goods for “intermediate demand” fell by -3.8% MoM in February, following a -6.3% MoM decrease in January due to a -9.1% MoM move in the cost of energy materials. Likewise, unprocessed “foodstuffs and feedstuffs” fell by -1.1% MoM. Finally, services for intermediate demand moved up 0.3% MoM following a 0.7% increase in January, with some of the rise attributable to loan services rising by 8.35% MoM, although there were broad increases elsewhere.
Why it Matters: The report showed a continuation of deflationary pressures more broadly at the wholesale producer output level. There were outright decreases in energy and food prices, while core goods decelerated after picking up in January. There were also broad decreases in the final demand level on the service side. Equally importantly, the intermediate level, processed and unprocessed goods also broadly continue to fall, with processed goods now higher by 2.1% YoY and unprocessed goods lower by -10.9%. This feeds through to final demand and ultimately to CPI/PCE, with varying lags, and is one of the main reasons we continue to see inflationary pressures subsiding back to target by the beginning of next year, sooner than most. Specific to the household, decreases in the prices of natural gas, which dropped by -41% MoM, and lower chicken eggs, milk, fresh fruits, fresh vegetables, and meat costs should support consumer confidence, which is usually more influenced by the price at the pump but, but lately, increasingly by the cost of heating one's home and paying for groceries.

*PPI price pressures broadly declined in February, with headline and core down 0.1% and unchanged, respectively

*Final demand for services remains the largest part of the annual increase, with all sub-indexes for final demand falling on the month

*The decline in the core PPI was helped by declining trade services (business markups), which indicate contracting profit margins
Business inventories declined by -0.1% in January, following a 0.3% rise in the prior month and against market expectations of no change. It was the first drop in business inventories since April 2021, as wholesalers' stocks fell (-0.4% vs. 0.1% in December). Meanwhile, inventories remained unchanged for manufacturers and slowed in their increase for retailers (0.2% vs. 0.4%). Year-on-year, business inventories are still higher by 11.1%. Trade sales and manufacturers’ shipments for January increased by 1.5% MoM, moving the annual rate to 5.0%. The total business inventories/sales ratio in January moved to 1.34, verse the January 2022 ratio of 1.27.
Why it Matters: Decreased inventory levels by wholesalers were the main driver of the total decline as retailers increased while manufacturers were unchanged during the month. The pick-up in sales was mainly attributable to retailers (2.9%), although manufacturers (0.7%) and wholesalers (1%) had positive gains. As a result of the still growing sales but shrinking inventory stocks, the inventory-to-sales ratio took a tick down after a methodically rising for the last year.

*January was the first negative inventory growth month in some time; however, sales continued to expand
Prices for U.S. imports fell by -0.1% in February, following a revised -0.4% decrease in the previous month and compared with market expectations of a -0.2% decline. The decline was driven by decreases in fuel costs (-4.9% MoM, the same as in January), as natural gas prices slumped -55.6% in February. By contrast, nonfuel imports broadly rose by 0.4% MoM after advancing 0.2% in January. On an annual basis, import prices are lower by -1.1%, the first 12-month decrease since December 2020. On the other side, export prices increased by 0.2% in February, following a downwardly revised 0.5% increase in the prior month and compared to market expectations of a -0.1% decrease. It was the second consecutive monthly rise in export prices since June 2022. Prices for exported agricultural goods rebounded (1% vs. -0.9% in January), as higher prices for vegetables, soybeans, and corn more than offset declining meat prices. Meanwhile, the non-agricultural export price increases slowed down (0.1% vs. 0.6%). On a yearly basis, prices for exports fell by -0.8%, also the first decline since November 2020.
Why it Matters: Both imports and exports are now lower on an annual basis for the first time since late 2020. It was the eighth consecutive month of decline in import prices, driven by falling fuel costs. Outside of fuels, higher prices for consumer goods, foods and beverages, capital goods, and autos offset lower nonfuel industrial supplies and materials prices. As a result, there is still some inflationary pressure flowing through core imports. Meanwhile, a jump in agricultural product costs drove export prices higher, while core exports were effectively flat on the month. This report would be viewed as more mixed by the Fed due to the increased costs for nonfuel imports. The annualized three-month average for nonfuel imports is 4%, which is still too high in the current environment despite consistent drops in energy costs.

*Import prices were lower on the month due to declines in energy costs, while prices increased for each of the major finished goods categories

*Exports prices increased on rises in the cost of agricultural products while non-agricultural export prices were flat
Retail sales were lower by -0.4% in February, compared to market forecasts of a -0.3% fall, and following an upwardly revised 3.2% surge in January, the biggest gain since March of 2021. Excluding autos, retail sales were down 0.1% MoM, and excluding gas and autos, sales were flat. The retail sales control group (excludes autos, gas, building materials, and food services and relates more with the consumer spending component of GDP) rose by 0.5% in February, and January's 1.7% increase was revised higher to 2.3% MoM. The most significant increases were seen in nonstore retailers (1.6%), health (0.9%), food and beverages stores (0.5%), general merchandise stores (0.5%), and electronics and appliances (0.3%). The most significant decreases were seen in sales at furniture stores (-2.5%), food services and drinking places (-2.2%), miscellaneous retailers (-1.8%), motor vehicles and part dealers (-1.8%), clothing stores (-0.8%), gasoline stations (-0.6%).
Why it Matters: Despite the headline weakness, core retail continued to expand in February after a very strong and revised higher January. However, shoppers did pull back on discretionary spending with declines in sales at department stores and home furnishings retailers. However, department store sales surged by 18% in January, so a decline of -4% in February still indicates a healthy activity level. Further, decreases in food service sales may indicate reduced inflationary pressures are coming for “food away from home,” which has remained somewhat sticky. With January’s retail sales so strong, it is hard to say if the broader level of decreasing sales indicates a peaking in consumer demand or simply a tough monthly comparison. As a reminder, retail sales aren’t adjusted for inflation, so the continued increase in core retail is more impressive, given the reduced inflationary drag there.

*Increases in the retail sales control group indicate that the PCE component of Q1 GDP improved, as seen in the Atlanta Fed GDPNow

*Weakness was tilted towards more discretionary items, with the rebound in nonstore potential weather impacted as well
Housing starts surged 9.8% in February to a seasonally adjusted annualized rate of 1.45 million, the highest in five months and above market forecasts of 1.31 million. Single-family housing starts were up 1.1% MoM to 830K, while multi-unit starts surged 24.1% MoM to 608K, the highest since April last year. Starts soared in the Midwest (70.3% to 201K) and West (16.8% to 347K), while they rose by less in the South (2.2% to 796K) and fell in the Northeast (-16.5% to 106K). On an annual basis, housing starts are lower by -18.4%. Building permits were also significantly higher, rising by 13.8% to a seasonally adjusted annual rate of 1.524 million in February, following a flat 0.1% advance in January and recovering from a 31-month low of 1.337 million in December. It was the highest reading in five months and well above market expectations of 1.34 million. In February, single-family increased 7.6% to a rate of 777K, up from January's near three-year low, while the volatile multi-segment jumped 21.1% to 747K. Permits were up in the South (10.9%), West (30%), and Midwest (9.6%) but were down in the Northeast (-2.8%).
Why it Matters: February was clearly a strong month, but there was also some payback after a weak winter, with starts in December and January revised down. The overall weakness over the last year has been in single-family starts, and the increase in total starts in February was again due to the volatile multi-family starts, a common theme now. On an annual basis, multi-family starts were up 9.9% year-over-year in February, while single-family starts, which increased slightly in February, are down -31.6% year-over-year. Finally, there are 1.691 million units under construction, just below the all-time record of 1.711 million set in October 2022. The reason there are still so many homes under construction is still due to supply constraints.

*Total housing starts in February were above expectations, with a large number of multi-family units to be delivered in ‘23

*Currently, there are 957 thousand multi-family units under construction. This is the highest level since November 1973!

*The South continues to show no sign of slowing with multi-family construction projects rising while other regions show some peaking

*In 2022, it took an average of 8.3 months from start to completion for single-family homes, up from an already elevated 7.2 months in 2021
The NAHB/Wells Fargo Housing Market Index increased for a third month to 44 in March, a new high since September of 2022 and beating market forecasts of 40. The gauge for current sales conditions rose to 49 from an upwardly revised 47, and traffic of prospective buyers edged 3 points higher to 31, hitting a 6-month high. On the other hand, sales expectations in the next six months fell slightly to 47 from 48. The South region drove the increase, with Midwest and West slightly lower and the Northeast unchanged.
Why it Matters: The HMI survey showed that builders had better than anticipated new home sales during the past two months because of the continued use of incentives and price discounts. Thirty-one percent of builders said they reduced home prices in March, the same share as in February, but lower than the 36% that was reported last November. And 58% provided some type of incentive in March, about the same as the 57% who did in February but lower than the 62% of builders who offered incentives in December. “Even as builders continue to deal with stubbornly high construction costs and material supply chain disruptions, they continue to report strong pent-up demand as buyers are waiting for interest rates to drop and turning more to the new home market due to a shortage of existing inventory,” said NAHB Chairman Alicia Huey. She also noted that “recent instability concerns in the banking system and volatility in interest rates, builders are highly uncertain about the near- and medium-term outlook. For example, 40% of builders in our March HMI survey currently cite lot availability as poor. And a follow-on effect of the pressure on regional banks, as well as continued Fed tightening, will be further constraints for acquisition, development, and construction (AD&C) loans for builders across the nation. When AD&C loan conditions are tight, lot inventory constricts and adds an additional hurdle to housing affordability.” As a result, it is likely the NAHB Index will turn lower until uncertainty over tighter financial conditions passes.

*Two of the three sub-indexes rose while expected sales six-month ahead fell as recent banking problems increased credit availability concerns

*Softer mortgage applications recently, despite more stable rates, signal weakness may be coming
The NFIB Small Business Optimism Index increased to 90.9 in February, the highest in three months, from 90.3 in January. More owners reported inflation as their single most important business problem, but there was a drop in reported supply chain disruptions. However, the percentage reporting they were raising prices decreased, correlating with lower sales over the last three months. Owners expecting better business conditions over the next six months deteriorated slightly. However, the percentage expecting sales to be higher improved but remains negative on aggregate. As a result of the more pessimistic outlook, the net percent of owners reporting inventory increases fell to a neutral reading. There is still a positive tilt to creating new jobs, but it has cooled slightly since last month, although 60% of firms reported hiring or trying to hire in February. A high percentage of small business owners continue to report trouble finding qualified workers, with difficulty filling open positions, particularly acute in the transportation, services, and construction sectors. As a result, 46% of small businesses reported raising compensation, while 23% plan on raising it further in the next months. Capex spending remains strong, with 60% of respondents reporting spending on new equipment in the last year, while 21% plan capital outlays in the next few months. Access to credit remained neutral, with 62% of firms saying they had no interest in getting a loan, which now has a 7.9% average rate paid for short maturity.
Why it Matters: Profit trends continue to be reported as a net negative, with weaker sales and higher costs being the primary reason. As a result, inflationary pressures are still the top business concern, while a weaker ability to raise prices is compressing margins. To be clear, firms are still historically “aggressively” raising prices, which is hard to do in a recession, suggesting that there is still a large pool of demand for goods and services. The labor situation remains frustrating for small business owners, and the staffing shortage has limited small business owner’s ability to take advantage of current opportunities fully. Those opportunities are starting to fade, but not dramatically, leaving job openings and hiring plans as the strongest metrics in the report. In summary, “the incidence of price hikes among Main Street firms has peaked but remains historically very high. But, the incidence of compensation increases has barely declined, making it harder for firms to justify reducing prices, even if other input costs are falling. If a slowing economy forces firms to cut prices, the bottom-line situation worsens, and revenues fall, but wage costs do not. Historically, this leads to a reduction in employment and rising unemployment,” according to official NFIB commentary. As always, this is our favorite report due to the wealth of information and small businesses' importance in job creation and inflation.

*Labor and investment intentions remain positive, with a net 6% of firms thinking now is a good time to expand

*Although still net positive, CapEx plans are falling. Separately concerns about inflation, while still elevated, have peaked

*Current and future compensation plans tocked higher slightly as finding qualified labor remains problematic

*Growing uncertainty regarding future business conditions is starting to reduce hiring plans despite job openings “hard to fill” remaining high

*Despite rising compensation, falling input and logistical costs seem to be lowering pricing plans despite demand reportedly remaining strong
Industrial production was unchanged in February, missing market expectations of a 0.2% MoM increase after rising by 0.3% in January. Manufacturing output edged up 0.1%, compared with forecasts of a -0.1% decrease. Durables (0.1% MoM) and nondurable (0.2% MoM) manufacturing was positive, while “other manufacturing” (publishing and logging) fell by -1.5% MoM. Meanwhile, mining output fell by -0.6% MoM, while the output of utilities rose by 0.5% MoM. Capacity utilization was unchanged in February at 78%, a rate that is 1.6 percentage points below its long-run average.
Why it Matters: After a rebound in January following three months of declines in Q4 ’22, industrial production again cooled. Business equipment (-0.2% MoM) and construction (-0.5%) products saw the largest decreases after having the largest gains last month. This was also the case for mining. Utilities normalized after January’s plunge in activity due to unseasonably warm weather.

*A flat month after the strong start to the year, increasing worries that January was an anomaly
The NY Fed’s Empire State Manufacturing Index dropped to -24.6 in March, from -5.8 in February, and well below market forecasts of -8. Demand and activity measures fell with New Orders (-21.7 vs. -7.8 in Feb) and Shipments (-13.4 vs. 0.1) notably declining, although Unfilled Orders (-6.7 vs. -9.2) improved slightly but remained in contractionary territory. Delivery Times (-7.6 vs. -9.2) continued to fall, while firms also reported more neutral Inventories (-1.9 vs. 6.4). Prices Paid (41.9 vs. 45) and Prices Received (22.9 vs. 28.4) fell further, but remained in highly expansionary territory. Finally, the two labor sub-indexes, Number of Employees (-10.1 vs. -6.6) and Average Workweek (-18.5 vs. -12.1), moved further into contractionary territory. Looking ahead, General Business Conditions over the next six months (2.9 vs. 14.7) fell notably, even as expectations for New Orders only marginally fell while Shipments and Unfilled Orders improved, with all three in expansionary territory. Notably, expected prices paid and received fell significantly but are still obviously historically high, while changes in future labor expectations were more neutral and remained expansionary. Finally, CapEx expectations fell but remained positive while tech spending expanded further.
Why it Matters: Improvements in the future outlook subindexes saved this report from being a total disappointment, given the declines in the current readings. The decline in demand and activity readings is disappointing after the move higher last month, which had a more neutral reading. Clearly, things are again contracting in the NY region, as was the case in the last two months of ’22. However, regarding inflation, the report showed both current and future price trends falling. Labor readings were more mixed, with current contracting further while the expected headcount six months ahead remained expansionary. Finally, Capex and IT plans both remained positive, and little changed on the net.

*Big declines in sentiment, demand, and activity readings drove the headline index lower in March

*Firms expect future inflationary pressures to ease further, approaching more historically normal levels
The Philadelphia Fed Manufacturing Index rose one point to -23.2 in March, missing market expectations of -15.6 and marking its seventh consecutive negative reading. Demand and activity measures all worsened with New Orders (-28.2 vs. -13.6 in Feb), Shipments (-25.4 vs. 8.7), and Unfilled Orders (-21.3 vs. -17) all moving notably into contractionary territory. Delivery Times (-24.3 vs. -13.6) fell further while Inventories (-11.2 vs. 15.3) significantly moved from too much to too little. Current price readings fell, although Prices Paid (23.5 vs. 26.5) moved less than Prices Received (7.9 vs. 14.9). The labor picture also notably contracted, with the Number of Employees (-10.3 vs. 5.1) and Average Workweek (-22 vs. -3.2) all contracting now. The future outlook wasn’t much better, with only shipments and average workweek improving while prices paid also rose, which is a negative. Otherwise, all other subindexes declined, with the expected general business activity moving into contractionary territory.
Why it Matters: It is unclear how the overall index rose when current sub-indexes significantly worsened, leading this to be a much more negative report than the slight headline rise indicated. There are some tough times in the city of brotherly love currently occurring. Further, future expectations for demand and labor significantly declined while CapEx expectations are now contractionary. The month’s special question showed that a slight majority of firms expected increased production this quarter verse last, with capacity about the same as this time last year. Labor supply shortages followed by supply chain constraints were the top reasons constraining capacity.

*A slight tick higher in the general activity index hid a much more negative underbelly of the report, while future expectations also dropped notably

*A lot of red, with every current sub-index lower
The University of Michigan consumer sentiment fell to 63.4 in March from 67 in February, and well below forecasts of 67, a preliminary estimate showed. Overall, all components worsened relatively evenly as both current conditions (66.4 vs. 70.7 in Feb) and expectations (61.5 vs. 64.7) worsened. At the same time, inflation expectations fell for both the year ahead (3.8% vs. 4.1%) and the five-year outlook (2.8% vs. 2.9%).
Why it Matters: It was the first drop in four months after February saw the highest reading in a year. The drop was mainly due to persistently high prices, continuing to be a headwind to sentiment while financial turmoil raised further worries. Sentiment declines were concentrated among lower-income, less-educated, and younger consumers and consumers with the top tercile of stock holdings. Notably, the decrease was already fully realized prior to the failure of Silicon Valley Bank, meaning the later-in-the-month revision will likely be lower. On a happier note, year-ahead inflation expectations fell to the lowest level since April 2021.

*A move lower due to continued inflationary worries, although views by Democrat-leaning respondents did improve

*As seen in the NY Fed survey below, inflation expectations continue to trend lower
The NY Fed’s Consumer Expectations Survey showed that inflation expectations for the year ahead fell sharply to 4.2% in February, the lowest since May of 2021, and compared to 5% in the previous two months. Consumers expect prices to rise at a slower pace across the board, with gas, food, medical care, college education, and rent all falling. On the other hand, median home price growth expectations increased. Meanwhile, inflation expectations for the three-year horizon remained unchanged at 2.7% and increased by 0.1 percentage point to 2.6% at the five-year-ahead horizon. Improvements were seen in labor market expectations and households’ perceptions and expectations for current and future financial situations.
Why it Matters: The report was a positive sign for the Fed, given the worry that inflation is becoming more entrenched, as seen in other readings such as median and sticky CPI indexes. Declines in inflation uncertainty also increase the value of falling overall inflation expectations at the one-year horizon. Earning and labor market expectations were also stable on aggregate, with voluntarily quit expectations rising while income growth expectations fell.

*Expected one-year ahead inflation expectations fell rather sharply over the month thanks to a broad view of cooling costs
Technicals and Charts:
Four Key Macro House Charts:
Growth/Value Ratio: Growth is higher on the day and the week, and Large-Cap Growth is the best-performing size/factor on the week.

Chinese Iron Ore Future Price: Iron Ore futures are lower on the day and the week.

5yr-30yr Treasury Spread: The curve is steeper on the day and week.

EUR/JPY FX Cross: The Yen was stronger on the day and the week.

Other Charts:

Large-cap growth has been one of the best-performing factors, with a more bifurcated response to the current bank failures as investors increased speculative (Crypto, Tech, Growth) and defensive ones (Utilities, Health Care, Low Volatility) since last week.

European and U.S. equities were the worst performance, with indexes dragged down by financials, energy, and materials due to financial stability concerns and a lower global growth outlook.

Investor sentiment has moved notably over the last few weeks as “good is bad” due to “higher for longer” has moved toward financial stability concerns.

The S&P is on the higher end of the range for “bear market” returns after about a year.

Seasonality should increasingly improve in the second half of March and throughout April.
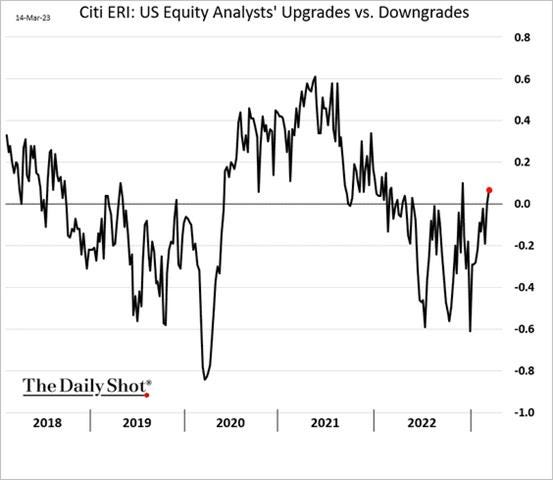
There has been an uptick in earnings estimates due to the stronger start to the year, but will this continue, given increased financial stability concerns and expected tighter financial conditions?

“This week saw the biggest inflows into US Money Market funds ($116bn) since march 2020 with inflows of $36bn and $55bn on Monday (13th) and Tuesday (14th)” - @ExanteData, @jnordvig, @EtraAlex

U.S. oil production continues to trend lower, with the second half of this year moving from the current surplus situation to a more deficit-prone environment.

Falling prices and mortgage rates, as well as high levels of savings, points to a likely rebound in Chinese housing markets.
Articles by Macro Themes:
Medium-term Themes:
Labor Markets Loosening:
Desperate Times?: Legislators in multiple states are invoking a widespread labor shortage to push bills that would weaken long-standing child labor laws. The laws and proposals have largely been introduced by Republicans but received support from some Democrats in Ohio and New Jersey. A new Arkansas law signed by Gov. Sarah Huckabee Sanders last week makes it easier for teens as young as 14 to work without obtaining a permit. Iowa lawmakers are considering Republican legislation that would allow 14- and 15-year-olds to work in industrial laundry services and freezers at meatpacking plants. It'd also prevent many of them from receiving worker's compensation if they are sickened, injured, or killed on the job. States will still have to comply with federal regulations, which sets standards for the types of jobs minors can work. - Lawmakers target child labor laws to ease worker shortage - Axios

China’s Post-Pandemic Life:
Military-Civil Fusion: China has unveiled reforms that will allow President Xi Jinping to exert closer direct control over the government in areas ranging from the financial sector to the integration of technologies with civilian and military uses. State media announced new Communist party commissions that will supervise government ministries and regulators under the State Council, China’s cabinet, as Xi further consolidates political oversight of the organs of the state. The reforms include a new central commission for science and technology that will oversee a revamped ministry of science and technology. The commission’s purpose will be to “strengthen the party’s leadership” on scientific and technological reform and to “co-ordinate the integration of civil-military technological development.” China’s drive for “military-civil fusion,” under which the Communist party has ordered that new technologies developed by the private sector must be shared with the military, is an important source of tension with the US. - Xi tightens control with party overhaul of China government - FT

"Precise and Forceful": The People's Bank of China said it would cut the reserve requirement ratio for all banks, except those that have implemented a 5% reserve ratio, by 25 basis points, effective March 27, moving the weighted average RRR to around 7.6%. The move, which came earlier than financial markets had anticipated, comes after data showed a gradual but uneven recovery in the first months of the year and stronger-than-expected credit expansion in February. The central bank said the cut reflected its intention to "make a good combination of macro policies, improve the level of services for the real economy, and keep liquidity reasonably sufficient in the banking system." - China cuts banks' reserve ratio for the first time in 2023 - NikkeiAsia

“Unprecedented and Severe Challenges”: The People’s Bank of China will “appropriately respond to the containment and suppression of the U.S. and other Western countries,” it said following the National People’s Congress session. It’s common for government ministries and agencies to hold meetings after major Communist Party and state events in order to show their backing for key policies. However, the PBOC’s comments were unusual in repeating Xi’s criticism of US “containment,” phrasing that wasn’t used in official statements. To support domestic tech champions, the PBOC could potentially extend or expand the 200 billion yuan re-lending program launched last year that encourages bank loans to tech firms, he said. There could also be more supportive measures for tech companies’ financing through equity and bonds. - China’s Central Bank Takes Up Xi Call to Fight US ‘Containment’ - Bloomberg

Black Thaw: China will allow all domestic companies to import Australian coal, signaling an end to trade restrictions imposed in late 2020. Earlier this year, authorities gave four major importers permission to resume purchases of Australian coal, which began shipping in January. High-quality Australian coal is much sought after by China’s steelmakers and power plants. China is the world’s biggest producer and consumer, and its coal imports exceeded 290 million tons last year. The thaw in relations between the two countries comes as a welcome development for Australian exporters of other commodities hit by a raft of restrictions, including lobster, beef, barley, and wine. - China Removes All Remaining Curbs on Australian Coal Imports - Bloomberg

Longer-term Themes:
Cyber Life and Digital Rights:
“And It’s Gone!”: The panic surrounding Silicon Valley Bank’s weak balance sheet churned through a tight-knit and chatty technology industry at lightning speed. It started at venture capital funds, trickled down to their fleet of tech startups, and was supercharged by the instantaneous communication facilitated by tweets and DMs. The online transactions that have streamlined finance in recent years allowed people to react immediately. “It’s almost unheard of for the FDIC to come in and bail an institution as quickly as this,” says William Isaac, who was chairman of the FDIC from 1981 to 1985. The bank couldn’t withstand the pace of withdrawals, which he suspects amounted to one of the quickest bank runs in U.S. history. Things moved fast, and they broke. - The Digital Age Ushers in a Speedier, More Viral Breed of Bank Run - Bloomberg

Making a Case: The U.S. Department of Justice is probing ByteDance’s surveillance of American journalists via TikTok as authorities scrutinize the popular social media platform’s Chinese owner after it admitted to improperly obtaining user data. ByteDance in December revealed user data from the short-form video app was obtained to study journalists’ locations as part of an internal investigation into the information being shared with the media. The probes come as the US government has threatened to ban TikTok on national security grounds if ByteDance does not sell its stake. The Committee on Foreign Investment in the United States, the US Treasury-led panel that vets foreign investment in the country, has requested the divestiture as part of its assessment of the app, according to people familiar with the matter. - US prosecutors probe ByteDance’s use of TikTok to track journalists – FT

Energy’s Midlife Crisis:
“Firewall”: President Biden moved to block future oil and gas leasing in the Arctic Ocean’s federal waters, part of a sweeping plan to protect 16 million acres of land and water in Alaska. As part of the conservation plan, the administration will also move to issue new federal rules limiting oil and gas leasing on 13 million acres of Alaska’s National Petroleum Reserve, and extend protections to key rivers and lakes in the state. The limits apply to future leases and wouldn’t stop ConocoPhillips’s Willow project from moving forward. - Biden Declares U.S. Arctic Ocean Off Limits to New Oil and Gas Leasing – WSJ

Food: Security, Innovations, and Climate Change Implications:
Peak Phosphorus: About 50m tonnes of phosphate fertilizer is sold worldwide every year, and these supplies play a crucial role in feeding the planet’s 8 billion inhabitants. However, significant phosphorus deposits are found in only a few countries: Morocco and western Sahara have the largest amount, China has the second biggest deposit, and Algeria has the third. In contrast, reserves in the U.S. are down to 1% of previous levels, while Europe and the U.K. have always had to rely on imports. This growing strain on stocks has raised fears the world will reach “peak phosphorus” in a few years. Supplies will then decline, leaving many nations struggling to obtain enough to feed their people. - Scientists warn of ‘phosphogeddon’ as critical fertiliser shortages loom – The Guardian

ESG versus the World:
Blaming Woke: The failure of Silicon Valley Bank has become the latest target for conservative politicians and news outlets in their mounting campaign against ESG. The NY Post, a city tabloid owned by Rupert Murdoch’s News Corp., published a story on Saturday with the headline, “While Silicon Valley Bank collapsed, top executives, pushed ‘woke’ programs,” which by its definition included an affinity group for LGBTQ employees and a Pride campaign. A day later, a sister newspaper, The Wall Street Journal, ran an editorial noting that SVB’s board of directors included a Black person, an LGBTQ person, and two military veterans, and suggested that the company “may have been distracted by diversity demands.” “Blaming ESG and ‘woke’ policies for the fall of SVB is absurd,” said Michael Sheren, a former Senior Advisor at the Bank of England, now a fellow at the Cambridge Institute for Sustainability Leadership. “SVB failed due to poor bank treasury choices and a concentrated and lumpy tech deposit base that was highly sensitive to rate moves in the market.” The bottom line is that conservative politicians and propaganda outlets quickly blamed ESG policies despite evidence suggesting more traditional poor risk management was to blame. - SVB Failure Becomes Fodder for Anti-ESG Crowd in US Culture Wars – Bloomberg

Asian Tigers 2.0:
“China Plus One”: Siemens is scouting for investments in south-east Asia to diversify away from China as multinationals work to reduce supply chain risks against a backdrop of geopolitical tension between the West and Beijing. The German group, one of the world’s biggest industrial conglomerates, is taking on staff and considering adding factories in fast-growing economies, including Indonesia, Vietnam, and Thailand. A number of multinationals are reducing exposure to China and building up a supply chain role for other countries in a “China plus one” production strategy. Sony, Apple, Samsung, and Adidas are among businesses that have shifted production from China to south-east Asia, including Vietnam and Thailand. - Siemens scours south-east Asia for deals to diversify from China – FT

Cold Places (Deep Sea, Artic, and Space Colonization):
Going Big: President Biden’s $842 billion budget request for the Defense Department for the 2024 fiscal year includes $30 billion for the U.S. Space Force, the military space branch's largest funding request to date. The $30 billion request is $3.7 billion more than what Congress enacted for the Space Force in 2023. The proposed budget “procures and modernizes capabilities to secure the use of space in the face of increasing threats to U.S. national security space systems,” the Pentagon said in budget documents. Most of the increase proposed for the Space Force is for the development and procurement of missile-warning satellites and for launch services. The service plans for 15 missions, compared to last year's 10 missions. Frank Kendall, secretary of the Air Force, said the 2024 budget begins a transition to a more diversified satellite architecture. - U.S. Space Force budget hits $30 billion in 2024 proposal - SpaceNews

VIEWS EXPRESSED IN "CONTENT" ON THIS WEBSITE OR POSTED IN SOCIAL MEDIA AND OTHER PLATFORMS (COLLECTIVELY, "CONTENT DISTRIBUTION OUTLETS") ARE MY OWN. THE POSTS ARE NOT DIRECTED TO ANY INVESTORS OR POTENTIAL INVESTORS, AND DO NOT CONSTITUTE AN OFFER TO SELL -- OR A SOLICITATION OF AN OFFER TO BUY -- ANY SECURITIES, AND MAY NOT BE USED OR RELIED UPON IN EVALUATING THE MERITS OF ANY INVESTMENT.
THE CONTENT SHOULD NOT BE CONSTRUED AS OR RELIED UPON IN ANY MANNER AS INVESTMENT, LEGAL, TAX, OR OTHER ADVICE. YOU SHOULD CONSULT YOUR OWN ADVISERS AS TO LEGAL, BUSINESS, TAX, AND OTHER RELATED MATTERS CONCERNING ANY INVESTMENT. ANY PROJECTIONS, ESTIMATES, FORECASTS, TARGETS, PROSPECTS AND/OR OPINIONS EXPRESSED IN THESE MATERIALS ARE SUBJECT TO CHANGE WITHOUT NOTICE AND MAY DIFFER OR BE CONTRARY TO OPINIONS EXPRESSED BY OTHERS. ANY CHARTS PROVIDED HERE ARE FOR INFORMATIONAL PURPOSES ONLY, AND SHOULD NOT BE RELIED UPON WHEN MAKING ANY INVESTMENT DECISION. CERTAIN INFORMATION CONTAINED IN HERE HAS BEEN OBTAINED FROM THIRD-PARTY SOURCES. WHILE TAKEN FROM SOURCES BELIEVED TO BE RELIABLE, I HAVE NOT INDEPENDENTLY VERIFIED SUCH INFORMATION AND MAKES NO REPRESENTATIONS ABOUT THE ENDURING ACCURACY OF THE INFORMATION