

No March Cut? No Worries: Markets Focus on Stronger Growth and Earnings Over a Patient Fed - Midday Macro – 2/2/2024
No March Cut? No Worries: Markets Focus on Stronger Growth and Earnings Over a Patient Fed - Midday Macro – 2/2/2024
Color on Markets, Economy, Policy, and Geopolitics

No March Cut? No Worries: Markets Focus on Stronger Growth and Earnings Over a Patient Fed
Midday Macro – 2/2/2024
Market’s Weekly Narrative:
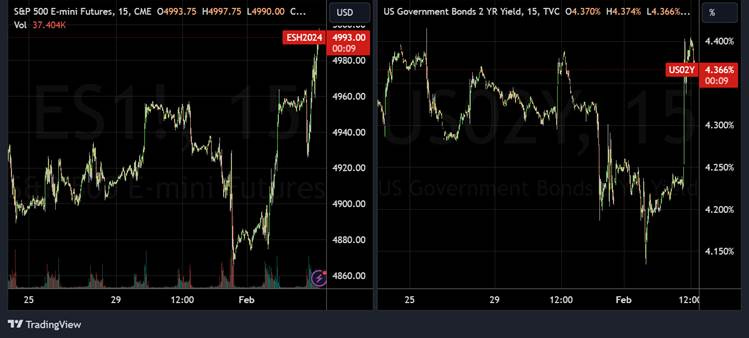
It was another roller coaster ride of a week, with a rally in equities today driven by stronger-than-expected mega-cap earnings from Meta and Amazon, pushing the Nasdaq and S&P to new ATHs. Consumer discretionary and communciation sectors outperformed, but staples and healthcare also did well. Momentum continues to be the best-performing factor. Small-caps lagged as regional bank worries and underperformance by the energy sector weighed on the Russell. Treasuries sold off hard on today's better-than-expected jobs report, with 10yr yields back above 4%. This followed a notable rally earlier in the week, which even a patient and more balanced Powell didn’t derail. The jobs report was broadly positive, although the increases in AHEs were likely due to cold weather reducing hours worked. However, the totality of this week’s data still indicated a tight labor market, with JOLTs rising, although quits fell. The Challenger Job Cut report did show an uptick in layoffs. Further, the ECI continued to trend lower in Q4 while productivity remained strong, reducing inflationary worries for policymakers. Elsewhere, construction data again showed positive momentum, truly supporting overall growth, and the ISM manufacturing survey moved closer to neutral with a jump in demand and prices.
Oil had a rough week with reduced geopolitical risks driving prices back towards the low $70s for WTI as a ceasefire was increasingly expected in Gaza, and Iran seemingly told its proxies forces in the region to cool it. Aramco reduced production goals, however, U.S. frackers increased theirs. Copper was little changed on the week. The overall agg index rose on the week, as gains in softs, grains, and corn outweighed weakness in beans. Finally, the dollar was higher on the week, recovering post-January FOMC losses today due to the backup in yields from the strong jobs report. The $DXY is ending the week near 104.

Headlines:

Deeper Dive:
The economy looks structurally sound despite the prolonged period of tighter monetary policy. Although still uncertain on whether inflation will fall to target in a timely manner, the Fed likes the “totality” of what it has seen in the economy over the last six months. Stronger-than-expected growth did not derail disinflationary progress, and although still historically tight, labor markets are in better balance. Outside the U.S., the ECB and BoE struck similar neutral tones, but weaker growth and greater disinflationary progress led markets to believe they, too, would be easing policy sooner than later. Add in a bottoming of global manufacturing PMIs and reduced geopolitical risk worries (on a Gaza ceasefire and Iranian proxies de-escalation), and risk sentiment should continue to be supported. It is seemingly becoming increasingly harder to find a negative narrative. However, underneath the surface, we still see things to worry about and continue to be reluctant to chase risk here, still preserving our short-equities bias into a seasonally weak period of the year but adding new positions to hedge that view, as well as express new ones.

*Rate cut expectations have moved back based on Powell’s comments and continued strong data

*Productivity gains mean Fed officials feel disinflationary progress will continue
For starters, the soft landing is far from assured. Although Q1 momentum is undoubtedly positive, equities and credit markets look to be pricing in a no-landing scenario. We must be careful because the bulk of the equity index gains have come from the “Sizzling Six”™ (Magnificent Seven minus Tesla), while small caps have lost momentum. Further, credit markets have benefited from lower supply from stronger corporate balance sheets (versus the larger expected mandatory volumes of refinancing needs coming). As time passes, weaker (refinancing) hands will extend out, and commercial real estate losses will likely worsen, especially as more transactions go through and true price discovery occurs. This came back into focus this week as New York Community Bankcorp had to disclose a large loss from a specific CRE loan in its fourth-quarter financial filing. Recall the banking crisis last March was mainly due to duration mismatch, not credit losses. That part of the cycle is only now starting.

*The CRE loss cycle is still in its early innings

*The following few years will see a growing need to refinance
Business investment is also likely to cool due to reduced capacity needs and, funnily enough, increased productivity. This should cool historically high construction activity that was a major contributor to growth in 2023. Past investments in physical and digital automation certainly increased productivity during the year, reversing losses seen in 2022. It also reduces the need for further investment in the face of a more uncertain future demand backdrop. Further, the current demand uncertainty, which is causing firms to hoard workers in case capacity needs increase, should normalize. Firms will not operate for long in a world where workweeks are falling due to declining new orders and backlogs, but there is no meaningful decrease in headcounts or variable costs. Further, a more balanced labor market means firms don’t have to worry about finding skilled workers as much as they did post-pandemic. As a result, layoffs should rise, and voluntary turnover should decrease, eventually reducing wage pressures. Unfortunately, wage rigidity will be the last domino to fall, keeping pressure on input costs, especially for service sector firms right as pricing power weakens. Said another way, firms may increasingly have too many low-productive workers if growth falls or even just normalizes (remember, H2 ’23 was above trend). As aggregate layoffs increase, consumers will grow more worried about their future income, reversing gains in confidence gained from the robust jobs market last year (and disinflationary progress, which will be weaker moving forward). At the same time, the labor firms continue to hold will have greater productivity and, hence potentially stronger wage negotiation power (even as overall growth slows). Effectively, we envision consumer confidence falling as labor markets loosen, reducing discretionary spending and weakening the pricing power of firms, which then impair the profit margins, given that both fixed and variable input costs will be slower to adjust lower than prices received. This is happening already in pockets of the economy, especially in manufacturing, as reported in PMIs, but not at a systemic level yet. It is our belief this will be one of the main stories in 2024, moving forward.

*Falling inflation has been the primary driver of better consumer confidence, but a strong job market has certainly helped too

*Household net wealth has moderated, but recent gains have supported sentiment and spending. Will it last?
We will spend some further time next week identifying other negative factors we see on the horizon. Unfortunately, a busy week has left us stretched for writing time. As a reminder, we run a full-time investment consulting firm focused on macro analysis, especially central bank policy mainly in developed markets and also several emerging ones. If you’re an institutional investor and like what you see here, please feel free to reach out if you need discretionary macro analysis to support your investment process. Turning to our mock portfolio, we want to make some additions and give an overall update. First, our trailing stop in oil ($USO long) was hit on this week's pullback. We were able to lock in a 9% gain, and we are glad we moved it up, given the violent reversal in prices this week on reduced geopolitical worries in the Middle East. The post-tech earnings rally today is putting us very close to being stopped out of our S&P long. However, we will wait until next week to close that position while maintaining a profit in our Russell short position. As we covered last week, exhausted technicals, stretched positioning/momentum, and the entry of a normally seasonally weak period of the year were the primary reasons we expected a pullback this week to start. We saw a more neutral Fed and stronger-than-expected jobs data as being the catalyst. We got all those things and a regional bank scare, but equities are still rallying due to tech earnings beating expectations. You must respect the price action, but we are willing to be a little more patient, given our conviction level. The pullback in Treauries today, moving yields higher, gives us a better entry point to go long the long-end through the $TLT ETF. Central banks will be cutting rates this year even as disinflationary progress slows in comparison to last year. Powell doesn’t need a materially weaker labor market to start cutting, as declines in Q4 ECI outweigh the stronger-than-expected reading in AHEs for January due to weather effects. Add in lower growth expectations (on our part) and falling rates elsewhere, and, although we have less conviction on where the curve goes, we see overall yields falling throughout the year. Further, if lower yields support equities, we will hedge our shorts there. Finally, we are starting a long Euro position (through the Invesco CurrecnyShares Euro ETF ($FXE)). It is sitting at 200dma support with the dollar, and for reasons we will elaborate on next week, it looks to be in a better place to appreciate against the dollar, given our views on the EZ economy, global growth, and the ECB.
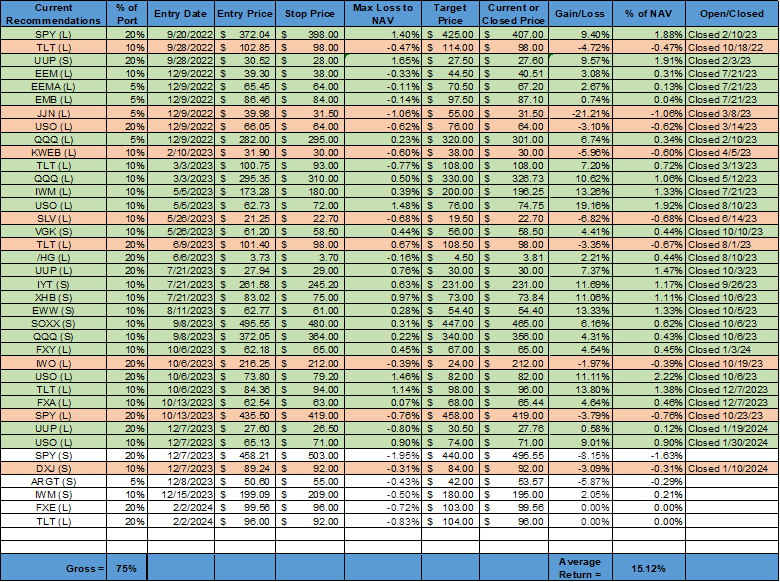
*Increasing our gross exposure with the addition of a long long-end Treasury position and long Euro positions
As always, thank you for reading, and please share our newsletter if you like it and know others who may enjoy it. Please feel free to reach out with any questions or comments. – Michael Ball, CFA, FRM
Policy Talk:
The Federal Reserve left policy unchanged at its January FOMC meeting, maintaining the target range for the Fed funds rate at 5.25% to 5.5%. The inflation language in the official statement was identical to the December statement. However, the FOMC removed language regarding the U.S. banking system being “sound and resilient," which was ironic given renewed regional bank worries on the day. The Fed may have dropped the language because it was tied to "tighter financial and credit conditions for households and businesses are likely to weigh on economic activity.” Nonetheless, there was a more neutral tone in the statement, with the addition of “the Committee judges that the risks to achieving its employment and inflation goals are moving into better balance. The economic outlook is uncertain." There were no descents to the decision.

Powell struck a more neutral tone during the press conference. He noted in his prepared remarks that the Fed’s “strong actions” have policy in a restrictive stance, and the FOMC is seeing the results of that in economic activity and inflation as things move back into “better balance.” He did acknowledge that economic activity expanded at a “solid” pace, but higher rates weighed on business fixed investment and kept housing activity “subdued” over the last year. Powell still sees the labor market as tight but is moving into a better balance. He noted improving wage growth and a higher participation rate but still sees the jobs-to-workers gap as showing demand exceeding supply, keeping the labor market tight. Moving on to inflation, he stressed that although the progress in the second half was welcome, he still needed to see “continuing evidence” to build confidence that inflation is moving sustainably lower towards the Fed target. He concluded his remarks by saying the FOMC believes that the policy rate was likely at its peak for the cycle, and if the economy evolves as expected, it would be appropriate to “begin dialing back policy restraint at some point this year.” However, given the surprises in growth, there was still a high level of uncertainty. Powell stayed on message in the Q&A part of the press conference. He said the FOMC didn’t need to see an improvement in the recent data, just a continuation of the current trends. He didn’t think stronger growth would be a problem, as it has coincided with disinflationary progress. He noted that the six months of disinflationary progress was largely driven by declines in the prices of goods, which he no longer expected to be a driving force. He pushed back against using the Taylor Rule to guide policy at this current juncture, given the committee didn’t have great confidence in where the neutral rate should be. Powell noted that policymakers were still well aligned on where policy should currently be, but there was a “wide disparity of views” on future outlooks, which he said was healthy. He saw the improved supply side as still having some tailwind on disinflationary progress and pushed back on saying the Fed had achieved a soft landing. In a following question, Powell noted that the wage gains were gradually moving back to levels, “given assumptions about productivity,” that were more associated with two percent inflation. He went on to note that he still saw a reacceleration in inflation as a risk and that it may become entrenched at a higher level than the target. In answering a question from Fox Business of all things, Powell dropped a rare presser bomb, saying he didn’t “think it's likely that the Committee will reach a level of confidence by the time of the March meeting” to cut rates. He, of course, said it depends on the data between now and then, and March will provide new SEPs, but it was enough for the odds of a March cut to drop significantly and March sell-side projections to move a meeting out. In the next question, he gave a node to productivity supporting disinflation progress despite higher-than-expected growth. He went on to defend the Fed’s independence, saying the coming election would not affect policy. All in all, the press conference showed an optimistically cautious Powell, willing to be a little more patient despite six months of disinflationary progress due to still stronger growth momentum than expected and greater uncertainty over its own forecasting ability.
“As labor market tightness has eased and progress on inflation has continued, the risks to achieving our employment and inflation goals are moving into better balance.
“What do we want to see? We want to see more good data. It's not that we're looking for better data. We're looking at a continuation of the good data that we've been seeing, and a good example is inflation. So, we have six months of good inflation data. The question really is, that six months of good inflation data, is it sending us a true signal that we are, in fact, on a path, a sustainable path down to 2 percent inflation?”
“We're going to be looking at this meeting by meeting. Based on the meeting today, I would tell you that I don't think it's likely that the Committee will reach a level of confidence by the time of the March meeting to identify March as the time to do that. But that's to be seen.”

*The delay in the start of cuts have markets pricing in a faster pace of cuts once they start

*The real rate of policy continues to rise, indicating a tighter stance of policy all else equal
U.S. Economic Data:
The Nonfarm payrolls increased by 353K jobs in January, compared to an upwardly revised 333K in December, and notably above market forecasts of 180K. Revisions added 359K jobs to 2023’s total gains, with employment in November and December revised 126K higher. Job gains occurred in professional and business services (74K), health care (70K), retail trade (45K), and social assistance (30K). Employment also increased in manufacturing (23K) and government (36K). The unemployment rate held at 3.7%, slightly below the market consensus of 3.8%. The U-6 unemployment rate (total unemployed, underemployed, marginally attached, and discouraged workers) increased to 7.2% in January from 7.1% in the previous month. The Labor Force Participation Rate remained at 62.5%, unchanged from the 10-month low in December. Average hourly earnings increased by 0.6% MoM, above market expectations of 0.3% MoM increase. Over the past 12 months, average hourly earnings have increased by 4.5%, up from 4.4% in December, and forecasts of a 4.1% increase. The average workweek decreased by 0.2 hours to 34.1 hours and is down by 0.5 hours over the last year.
Key Takeaways: A significantly stronger than expected result, showing the labor market remains healthy and tight. With the new revisions, the US economy added an average of 255K jobs per month in 2023, higher than the monthly average of 225K earlier. 2024 is certainly off to a strong start, with broader gains (by industries) seen than in prior months. Momentum is positive with the three-month average for payroll growth climbing even higher to 249K. It was also the biggest monthly rise in wages since March 2022. However, cold weather seemingly reduced the average weekly hours worked, which may have skewed the average hourly earnings results higher. On the negative side, household employment fell by 31k in January (vs. 683k decline in December), the second consecutive monthly decline there. Stepping back, in isolation, the optics of January’s job report for Fed policymakers mean that March should be a pass, given the hiring momentum and stickiness of wage growth. They would also be concerned with the participation rate remaining unchanged and at a 10-month low.

*January’s results and revisions to prior months moved higher three and six-month averages

*Although Healthcare remains a key driver of hiring, there was a broader participation in January than in December

*Average hourly earnings came in double what was expected for the month…

*…moving the annual rate back into its 2022 – H1 2023 range

*Average weekly hours worked declined, one of the few negatives in the report, but bad weather in January likely played a role

*The UER remains below its pre-pandemic level, little changed since last summer

*The participation rate remains below pre-pandemic levels and has recently turned lower
The number of job openings increased by 101K to 9.026 million in December, above the market consensus of 8.75 million, leaving the job opening rate at 5.4%. Job openings increased in professional and business services (+239K) but decreased in wholesale trade (-83K). Regarding regional distribution, job openings rose in the South (+115K) and the Northeast (+12K) but fell in the Midwest (-22K) and the West (-4K). Hires were little changed at 5.6 million, a 3.6% hire rate, decreasing the most in health care (-119K). Total separations also changed little, at 5.4 million or 3.4%. Within separations, quits were 3.4 million (2.2%), and layoffs and discharges were 1.6 million (1%), both little changed.
Key Takeaways: The number of job openings hit its highest level in three months while the level of voluntary quits fell to the lowest level in three years. The advance in openings was mainly concentrated in professional and business services, which registered the biggest increase in four months. Education and health services, as well as manufacturing, also saw a pickup in postings. The increase in openings but the increase in quits implies that workers are still reluctant to leave the ones they currently have. As seen in the Atlanta Fed Wage Tracker, the lower quits rate level has correlated well with wages falling, as job switchers have commanded a higher wage. However, the report delivered a slightly contrasting message, with hirings and layoffs both ticking slightly higher. While the overall level of layoffs is historically low, they’ve been rising in transportation and warehousing, which has been at the highest level since June 2020.

*Although up on the month, job openings have been trending lower since early 2022

*Quits are convincingly falling, moving back to a pre-pandemic level, which indicates reduced wage pressures
Employers announced plans to cut 82,307 jobs in January, compared to 34,817 in December. The financial (23,238) and technology (15,806) sectors announced the most job cuts. “Restructuring” was the most-cited reason for job cuts with 28,329, followed by plant, store, and unit “closing,” which accounted for 14,555 cuts. Employers announced plans to hire 5,376 workers in January, the lowest January total on record. It is up 78% from the 3,022 announced hiring plans in December, which was the lowest monthly total on record.
Key Takeaways: This was the highest level of job cuts in ten months, and with the exception of last January’s total, the highest number of job cuts announced in January since January 2009. “Waves of layoff announcements hit US-based companies in January after a quiet fourth quarter. As we step into 2024, the landscape is shaped by stabilizing prices and the anticipation of falling interest rates. It is also an election year, and companies begin to plan for potential policy changes that may impact their industries. However, these layoffs are also driven by broader economic trends and a strategic shift towards increased automation and AI adoption in various sectors, though in most cases, companies point to cost-cutting as the main driver for layoffs,” said Andrew Challenger, Senior VP of Challenger, Gray & Christmas, Inc. Finally, artificial intelligence was cited for 381 job cuts in January, and since first cited in May 2023, Challenger has tracked 4,628 job cuts announced due to Artificial Intelligence, either because the companies were pivoting to developing it or because it replaced tasks and roles.

*January usually has a higher level of cuts, but the last two Janaury’s have been historically high

*Financial firms led in layoffs, but there were larger January increases in tech, food, energy, and industrial goods
Compensation costs for civilian workers increased by 0.9% in the fourth quarter of 2023, easing from a 1.1% rise in Q3 and falling short of the market consensus of a 1% increase. Over the 12 months ending December, the ECI increased 4.2%, down from 4.3% in the prior quarter. Wages and salaries rose 0.9% during the fourth quarter, which resulted in the year-over-year change in wages easing to 4.3% from 4.6%. Benefit costs increased by 0.7% QoQ, and the year-over-year increase declined to 3.8% from 4.1%.
Key Takeaways: Employment costs continued to slow in the last quarter of 2023, with the overall ECI increasing at its slowest rate in two years on a quarterly basis. However, at still over 4%, the ECI is not yet near what economists would consider an inflation-neutral level, despite what some Fed officials have recently said regarding the overall labor market supply and demand balances. However, the continued progress and the idea that the Fed will start easing policy before the totality of inflation indicators, including wage readings, are at sustainable inflation target levels, which means the report will be viewed positively by the Fed.

*ECI continues to trend the right way but, on an annual basis, remains one percentage point above pre-pandemic levels

*ECI and the quits rate have correlated well
Labor productivity increased by 3.2% in the fourth quarter of 2023, above market expectations of 2.5% and following a downwardly revised 4.9% rise in Q3, preliminary estimates showed. Output increased by 3.7% (vs. 5.8% in Q3), while hours worked increased by 0.4% QoQ (vs. 0.9% QoQ). On an annual basis, labor productivity increased by 2.7% (vs. 2.3%), while the overall annual average productivity increased by 1.2%. Unit labor costs increased at an annualized rate of 0.5% in the fourth quarter, compared to a downwardly revised 1.1% fall in the previous period and falling short of market expectations for a 1.6% increase. This reflects a 3.7% increase in hourly compensation and the previously mentioned 3.2% gain in productivity. Unit labor costs in the total manufacturing sector increased 4.2% in the fourth quarter, with a 6.6% surge in hourly compensation and a 2.3% increase in productivity. The business sector saw a rise of 0.6%. Compared to the fourth quarter of 2022, unit labor costs increased 2.3%, while the annual average unit labor costs increased 2.9% in 2023.
Key Takeaways: Productivity continued to increase at a historically rapid pace in the fourth quarter, helping keep unit labor cost increases more subdued than in Q3, especially outside manufacturing. The rebound in productivity in 2023 more than erased what was the sharpest annual decline on record in 2022. “The revival in productivity is encouraging for the broader inflation and economic outlook,” Gregory Daco, chief economist at EY, said in a note. “If companies can generate strong productivity growth, they will be able to control costs and protect margins without sacrificing talent in an environment of still-elevated wages and fading pricing power.” Fed officials will welcome the continued increase in productivity, especially when it is occurring with still increasing hours worked and output.

*Productivity growth in 2023 has now offset losses that occurred in 2022

*Productivity growth is now above its pre-pandemic trend, likely due to the high level of investment that occurred during and following the pandemic

*Wage gains by manufacturing workers have increased unit labor costs despite increased productivity
Construction spending increased by 0.9% in December, matching November's revised reading and beating market estimates of a 0.5% MoM increase. Private spending grew by 0.7% MoM, driven by a 1.4% MoM increase in residential construction, notably in single-family (1.6% MoM), which offset a -0.2% MoM decline in the non-residential segment. Additionally, public spending saw a 1.3% MoM increase. Yearly, construction spending advanced by 13.9% in December.
Key Takeaways: December was another strong month of construction spending, with the annual rate for 2023 ending at an impressive double-digit level. Manufacturing construction was up 60.5% for the year, largely thanks to reshoring and fiscal stimulus incentives. Residential construction had a more muted year, rising 6.8% YoY, with a slow start to the year, improving by the end.

*2023 saw a strong construction pulse despite higher rates
The ISM Manufacturing PMI increased to 49.1 in January, from 47.1 in December, and well above forecasts of 47. Demand and activity measures were mixed, with New Orders (52.5 vs. 47 in Dec) and Production (50.4 vs. 49.9) moving into contractionary territory. However, the Backlog of Orders (44.7 vs. 45.3) and New Export Orders (45.2 vs. 49.9) contracted at a faster rate. Supplier Deliveries (49.1 vs. 47) moved closer to neutral, while Inventories (46.2 vs. 43.9) contracted at a slower rate. However, Customer Inventories (43.7 vs. 48.1) moved into a “too low” level reading. Imports (50.1 vs. 46.4) moved to a neutral reading. Employment (47.1 vs. 47.5) continued to contract at a similar rate. Finally, Prices (52.9 vs. 45.2) have moved notably higher since last month.
Key Takeaways: The January report showed an uptick in demand and activity readings and ran counter to what was seen in regional Fed manufacturing PMI surveys. Two of the six major manufacturing industries registered expansion in January. The employment reading remained little changed and contractionary despite the respectable level of manufacturing hiring seen in the January Jobs report. January was the fourth month of contraction in hiring (and 7th out of 9), with only Transportation Equipment expanding. The majority of panelists’ comments indicated labor force reduction efforts, with attrition, freezes, and layoffs were all used to reduce headcounts, while the quit rates remained at 12-month lows. Panelists report their companies’ customers have a significant shortage of their products in inventory, which is considered positive for future new orders and production. Finally, imports grew in January after contracting for 14 consecutive months. With the Lunar New Year starting in early February, there should be a continued expansion in the Imports Index, assuming no other external factors. Panelists noted rising ocean freight costs and extended trans-Suez lead times to account for risk in the area,” said ISM Chair TImothy Fiore. Fiore added that “Demand remains soft but shows signs of improvement, and production execution is stable compared to December, as panelists’ companies continue to manage outputs, material inputs, and labor costs. Suppliers continue to have capacity. Sixty-two percent of manufacturing gross domestic product (GDP) contracted in January, down from 84 percent in December.”

*There was a lower drag from inventories, while employment was little changed, and new orders and production expanded in the January report

*New orders and price readings jumped higher on the month

*More sub-index readings expanded (or contracted at a slower rate) than contracted

*Comments were more balanced, with the normal expected variation by industry
The Conference Board Consumer Confidence Index rose to 114.8 in January from a revised 108 in December. The Present Situation Index increased notably to 161.3 from 147.2 in the prior month, while the Expectations Index increased to 83.8 from a revised 81.9 in December. Consumer’s assessments of current business conditions and labor markets were both more positive. Six-months ahead expectations showed consumers were slightly less optimistic about short-term business conditions, while their labor market outlook improved slightly. Future income prospects were “less pessimistic,” although expectations for increases declined. Assessments of current and future financial situations were more positive. The perceived likelihood of a recession continued to trend lower, with 66% thinking it was “somewhat” and “very likely.” The average 12-month ahead inflation expectations fell to 5.2%, the lowest since March 2020.
Key Takeaways: The January headline reading was the highest since December 2021, thanks to a notable jump in the current conditions reading. Changes in future expectations were mixed with more neutral readings versus changes in improvement or worsening responses. “January’s increase in consumer confidence likely reflected slower inflation, anticipation of lower interest rates ahead, and generally favorable employment conditions as companies continue to hoard labor,” said Dana Peterson, Chief Economist at The Conference Board. “The gain was seen across all age groups but was largest for consumers 55 and over. Likewise, confidence improved for all income groups except the very top; only households earning $125,000+ saw a slight dip.” Write-in responses showed inflation still weighed on consumers, although inflation expectations fell to a three-year low. Further, purchasing plans declined in January, but consumers continued to rate their current and future income and personal finances favorably.

*As seen in the Univ. of Michigan Survey, Consumer Confidence jumped higher again in the Conference Board’s reading

*Gains were primarily from current readings, with both labor market and business conditions stronger

*Inflation expectations are near pre-pandemic levels.

*Fewer respondents are reporting their current financial conditions are worsening
The S&P CoreLogic Case-Shiller 20-city Home Price Index declined by -0.2% in November, following a 0.1% increase in October, and moving the annual rate to 5.4%, from 4.9% in the prior month, and below expectations of a 5.8% YoY increase. Detroit reported the highest year-over-year gain among the 20 cities, with an 8.2% increase in November, followed again by San Diego with an 8% increase. For the third month in a row, Portland fell, moving its annual rate to -0.7%, making it the only city reporting lower prices in November versus a year ago.
Key Takeaways: November saw the first monthly decline in the 20-city home index since January 2023, setting the index back to levels last seen over the summer months. However, annual returns remained trending higher. “Six cities registered a new all-time high in November (Miami, Tampa, Atlanta, Charlotte, New York, and Cleveland). Portland remains the lone market in annual decline. The Northeast and Midwest recorded the largest gains, with returns of 6.4% and 6.3%, respectively. Other regions are not far behind with the slowest gains in the West of 3%. This month’s report revealed the narrowest spread of performance across the nation since the first quarter of 2021,” reported Brian Luke, Head of Commodities, Real & Digital Assets at S&P DJI. He went on to say the “tight disparity” between pricing trends across the country indicates less evidence of micro-markets “bucking the trend.”

*On a seasonally adjusted basis, the 20-City Home Price Index was up slightly but down when seasonally adjusted

*Home prices continue to trend higher on an annual basis, but have lost some momentum, while also having less disparity between cities and regions.
The Dallas Fed’s Manufacturing General Business Activity Index declined to -27.4 in January from -10.4 in December. The Company Outlook (-18.2 vs. -9.4 in Dec) moved meaningfully lower, while Outlook Uncertainty (20.9 vs. 18.3) worsened. Demand and activity sub-indexes broadly contracted at a faster pace, outside the Growth Rate of Orders (-14.4 vs. -22.5), whose contraction slowed. Readings for New Orders (-12.5 vs -10.1), Production (-15.4 vs. 1.2), Shipments (-16.6 vs. -5.3), Capacity Utilization (-14.9 vs. 0.6), and Unfilled Orders (-12.9 vs. -9.9) all worsened, somewhat notably for many. Delivery Times (-8.1 vs. -3.2) shortened at a faster rate, while Inventories (-2.2 vs. -5.4) moved closer to neutral. Labor measures all weakened, with Employment (-9.7 vs. -2.8) and Hours Worked (-11.8 vs. -0.2) contracting further, while Wages (20.8 vs 25.1) expanded at a slightly slower rate. Inflation readings were split, With Prices Paid (20.2 vs. 17.8) expanding while Prices Received (0.1 vs. 6.1) moved to neutral. The current Capex (4.7 vs. 2.8) reading remained expansionary. Six-month ahead readings were notably more positive. Demand and activity readings expanded further. Price measures were stable while hiring intention expanded despite hours worked contracting. Finally, capex intentions remained expansionary but decreased slightly, and the future company outlook reading moved from neutral to slightly positive.
Key Takeaways: This was the lowest reading for the current general business conditions in eight months, and declines at the sub-index level were broad. It was a perfect storm, as all the demand and activity sub-index measures are now well in contractionary territory, and profit margins were squeezed as input costs and wage increases remained sticky while prices received fell. However, the positive current capex and a broad improvement in future readings did indicate that the world was not completely ending in the Texas region for manufacturers. Further, although normally skewed negatively, especially when a Democrat is in the White House, the January comments from respondents were more balanced.

*Demand and activity sub-indexes broadly and notably declined in January

*Pricing and wage pressures continued while capex picked up
The Dallas Fed’s Service Sector Outlook Survey’s General Business Condition Index declined to -9.3 in January from -8.8 in December. The reading for Company Outlook (-4.9 vs. -0.2 in Dec) moved into negative territory, while Outlook Uncertainty (14.7 vs. 12.6) worsened. The reading for Revenue (-3.6 vs. 4) contracted notably. Employment (2.5 vs. 3.2) remained expansionary but moved closer to neutral, while Part-Time Employment (-0.6 vs. 0.7) changed little. Hours Worked (-4.5 vs. -0.3) contracted further. Despite this, Wages (17 vs 15.8) expanded further. Inflation pressures eased slightly, with both Input Prices (33.6 vs. 35.9) and Selling Prices (8.7 vs. 12.9) expanding at a slightly reduced rate than in December. Capital Expenditures (6 vs. 9.3) expanded at a reduced rate. Forward-looking sub-index readings were mixed, keeping the general business activity index little changed and still expansionary. Revenue expectations improved, but hiring intentions fell, although they remained well in expansionary territory. Inflationary pressures weren’t expected to change much, nor was capex spending.
Key Takeaways: The service sector in the Texas area remained little changed in January, continuing to contract due to weaker revenues and a worsening company outlook. Positive hiring momentum both at the current and future levels and expanding capex plans means that despite a negative general business activity reading, firms were still expanding capacity. Respondent comments were skewed towards a more uncertain outlook, as indicated by the sub-index reading. Recession worries were mentioned in various industries; however, responses were uneven across sectors.

*Revenue moved back into contractionary territory after rising in December

*There was a broad cooling at the sub-index level other than wage readings
Technicals, Positioning, and Charts:
The S&P and Nasdaq outperformed the Russell on the week. Consumer Discretionary, Communication, and Consumer Staples were the best-performing sectors, while Momentum and Growth were the best-performing factors. Large-cap Growth was the best-performing size/value combo of the week.

@Koyfin
S&P optionality strike levels have the Zero-Gamma Level at 4877 while the Call Wall is 4950 and the Put Wall is 4500. The 5000 level on the SPX will act as resistance, with a strong pull there for anything above 4900. A break below 4870, something we almost had post-FOMC, will flip gamma to a more negative level, and there will be gravity towards 4800. The overall tilt is bullish, especially for the Nasdaq, with an appearance of frothy, aggressive long call positions, which means dealers may have to chase to the upside, which is occurring today. The QQQ Call Wall rolled higher to 440 overnight, too.

@spotgamma
S&P technical levels have support at 4940, then 4905, with resistance at 5010, then 5040.

@AdamMancini4
Treasuries are lower on the day, with the 10yr yield higher by 15 bps to 4.03%, while the 5s30s curve is flatter by 7 bps on the session, moving to 23 bps.

Four Key Macro House Charts:

Growth/Value Ratio: Growth is higher on the week; with Large-Cap Growth the best-performing size/factor on the week.

Chinese Iron Ore Future Price: Iron Ore futures are lower on the week.

5yr-30yr Treasury Spread: The curve is flatter on the week.

EUR/JPY FX Cross: The Euro is stronger on the week.
Other Charts:

"The SSI’s current level indicates an expected price return of +14% over the next 12 months or 5450 for the S&P 500 by year-end 2024." - Savita Subramanian – BofA

The S&P 500 tends to see a seasonal peak in mid-February.

While parallels between the current environment and the speculative frenzy surrounding internet stocks at the turn of the century are frequently dismissed, the strategists’ analysis shows the circumstances “are far more similar than one may think,” JPM Quant Research Team believes.

"We are living in one of the narrowest markets in history, with only 26% of stocks outperforming the index. The last time this happened (1998-2000) it all ended in tears (down 53%), and the previous period (1970-73) led to a regime of valuation destruction (with the P/E ratio declining from 20x to 7x)." - @TimmerFidelity

Inflows into tech ETFs and mutual funds, which were already strong, accelerated to the highest in five months at $2.8 billion. Over the last 12 months, the sector has swamped all others to a remarkable extent:

Tech fund flows continued to rise in recent weeks, while other sectors were flat or negative on an annual basis.

CTAs position in $SPX hasn't moved much as we started losing momentum. This means that they have been less impactful on the index performance.

The US is currently seeing the widest gap between S&P 500 current earnings yield and MSCI Europe Index ever. Put simply, Europe has never been this cheap versus the US. The earnings yield investors get from European assets looks far more attractive than the American benchmark. - @johnauthers

consumer confidence survey cited above also has a series showing the percentage of respondents who believe that stock prices will be lower in 12 months (chart). It fell sharply in January to only 24.9%. The bull market may be running out of bears!
")
“Eighty-nine percent of US household debt is fixed rate (mortgage, student, and auto loans) and 11% is floating rate (credit cards, HELOC, and other types of debt). As a result, the transmission mechanism of monetary policy has been weak. Combined with significant excess savings during the pandemic, Fed hikes have had a limited impact on the consumer.” – Torsten Slok

Economic sentiment was roughly flat this month. - @SoberLook
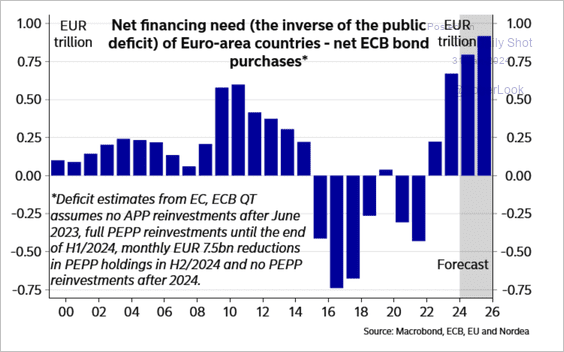
Similar to the US, heavy bond issuance in the euro-area could put upward pressure on yields. - @SoberLook

China NBS composite PMI at 50.9 in January, while the manufacturing PMI was at 49.2. The NBS PMIs are a little more downbeat than the Caixin/S&P Global measures for December, shown below for reference.

Chinese households continue to save a large share of their income due to the increased level of uncertainty.
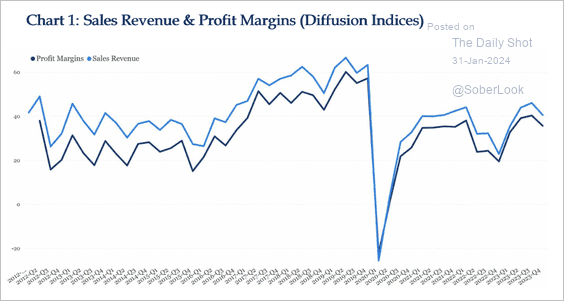
The recovery in sales revenue and profit margins in China has been weak, keeping business confidence low and reducing investment.

Significant mortgage rate cuts have been made, but this has yet to stimulate a rebound in property sales.
Articles by Macro Themes:
Medium-term Themes:
Half the World (2024 Election News):
Fighting Disinformation: Taiwan beat back a Chinese disinformation campaign targeting its Jan. 13 election with a rapid response mobilizing all levels of society. According to the Associated Press, Atlantic Council researcher Kenton Thibaut calls it a “whole of society response,” which relies on government, media, and civil society working together. And it offers lessons for democracies facing information warfare in 2024 when more than 50 countries will hold elections. How they crushed it: When baseless claims of voter fraud went viral, the Taiwanese election commission held press conferences rebutting accusations at the moment. Influencers debunked rumors on social media, and media literacy efforts raised public awareness, while independent fact-checkers proved deepfakes were edited. - How Taiwan beat back disinformation and preserved the integrity of its election – AP News
")
China’s Rebalancing Act:
Rural Cooperatives: After engineering mergers of rural cooperatives and rural commercial banks in at least seven provinces since 2022, policymakers have pinpointed tackling risks in the $6.7 trillion sector as one of their top priorities for this year. That means another wave of consolidation is on the way across the nation. The 2,100 banks in the rural cooperative system saw their bad-loan ratio stand at 3.48% at the end of 2022, more than twice as high as that for the whole sector. “It’s where risks are the most concentrated among smaller financial institutions, so China is pushing the reform at a faster pace,” said Liu Xiaochun, deputy director of think-tank Shanghai Finance Institute. “And one key solution to resolving the risks is through mergers and reorganizations.” - China Merges Hundreds of Rural Banks as Financial Risks Mount - Bloomberg

First to Fall: The poster child of China’s property crisis is no more. A Hong Kong court ordered Evergrande’s liquidation after creditors once again failed to reach a deal on restructuring its debts. The blow fell more than two years after Evergrande’s default on its dollar bonds ushered in a dangerous new phase in China’s efforts to rein in one of the largest real-estate booms in history. If anything, the pain from the sector’s slow-motion collapse is likely to be felt just as acutely this year as last year. “To predict China’s economic performance pretty much equates to predicting when the housing market will bottom out,” said Larry Hu, chief China economist at Macquarie. Evergrande’s default in 2021 made it one of the first dominoes to fall in a real-estate crunch that has ground on ever since. - Evergrande Is Finished. China’s Property Woes Aren’t. – WSJ

41 Metrics: The risk of a Japan-style deflationary malaise has led to an exodus of foreign capital, but President Xi Jinping has been unwilling to pull out the big stimulus guns. Some of that reluctance stems from a desire to promote the high-tech and green industries of the future, and avoid another bout of unsustainable, debt-fueled growth. A phrase that’s cropped up in many of Xi’s recent speeches seems to sum up his approach: “high-quality development.” - Why China’s Xi is Pushing ‘High-Quality Development’ - Bloomberg

Longer-term Themes:
The Singularity is Near (AI Developments) and Cyber Life (More Generally):
Not Our Servers: The Commerce Department will soon require cloud computing providers to inform the government when a foreign company uses their resources to train a large language model. The October order directed the Commerce Department to require such disclosures in an effort to detect foreign actors that might use AI to launch “malicious cyber-enabled activity.” The proposal would require U.S. cloud computing companies to verify the identity of foreign persons who sign up for or maintain accounts that utilize U.S. cloud computing through a “know-your-customer program or Customer Identification Program.” It would also set minimum standards for identifying foreign users and would require cloud computing firms to certify compliance annually. - OpenAI and Other Tech Giants Will Have to Warn the US Government When They Start New AI Projects - Wired

Adapting to Realities: Microsoft has introduced more protections to Designer, an AI text-to-image generation tool that people use to make non-consensual sexual images of celebrities. Microsoft made the changes after 404 Media reported that the AI-generated nude images of Taylor Swift that went viral on Twitter last week came from 4chan and a Telegram channel where people were using Designer to make AI-generated images of celebrities. "We are investigating these reports and are taking appropriate action to address them," a Microsoft spokesperson told us in an email on Friday. "We have large teams working on the development of guardrails and other safety systems in line with our responsible AI principles, including content filtering, operational monitoring and abuse detection to mitigate misuse of the system and help create a safer environment for users.” - Microsoft Closes Loophole That Created AI Porn of Taylor Swift – 404Media
The Demise of Unipolarity: A World of Rising Regional Sphere:
United in Cause: A Mercosur summit planned to conclude a landmark trade agreement with the European Union closed Thursday in Rio de Janeiro with no deal in sight and its leaders focused instead on preventing a burgeoning territorial dispute between Venezuela and Guyana. The customs union, made up of Brazil, Argentina, Uruguay, and Paraguay, succeeded in formally adding Bolivia to its ranks and inked a smaller trade pact with Singapore, far from enough to cement it as a force for South American economic integration. - Mercosur Summit Ends Without EU Deal, Eclipsed by Venezuela Fear – Bloomberg

Food: Security, Innovations, and Climate Change Implications:
Cyber Food Security: The Farm and Food Cybersecurity Act aims to identify vulnerabilities in the sector through an annual exercise and regular threat assessments. The bill also would task the secretaries of agriculture, homeland security, and health and human services to team with the director of national intelligence in holding a yearly cross-sector exercise on how to handle food-related cyber disruptions and emergencies. “Food and farm security is national security,” Finstad said in a statement. “With growing threats at home and abroad, it is increasingly important that we ensure our nation’s agriculture sector and food supply chain remain secure.” - Bill seeks cyber protections for food and agriculture - CyberScoop

Automated Warfare:
Crowded Skies: The US military has gotten used to owning the skies. American air superiority in recent conflicts has been so complete that no US ground troops have been killed by an enemy aircraft since the Korean War, which ended more than 70 years ago. Depending on your definition of “aircraft,” however, that may have changed on Sunday, when three US troops were killed in a drone strike on a US base in Jordan near the Syrian border. More than 40 service members were injured in the strike, according to the Pentagon. The Islamic Resistance in Iraq, an umbrella group of militias backed by the government of Iran that opposes both the US’s presence in the region and its support for Israel, took responsibility for the attack. - America no longer has a monopoly on deadly drones - Vox

Hobbyist Soldiers: When the United States first fired a missile from an armed Predator drone at suspected Al Qaeda leaders in Afghanistan on November 14, 2001, it was clear that warfare had permanently changed. During the two decades that followed, drones became the most iconic instrument of the war on terror. Highly sophisticated, multimillion-dollar US drones were repeatedly deployed in targeted killing campaigns. But their use worldwide was limited to powerful nations. The Bayraktar TB2 drone, a Turkish-made aircraft from the Baykar corporation, marks a new chapter in the still-new era of drone warfare. Cheap, widely available drones have changed how smaller nations fight modern wars. - Mass-market military drones have changed the way wars are fought – MIT Tech Review

Other Articles of Interest:
Slow Start: The Biden administration, eager to highlight a signature economic initiative as elections approach, is expected to award billions of dollars in subsidies to Intel, TSMC, and other top semiconductor companies in the coming weeks to help build new factories. The slow pace of implementation of the 2022 bipartisan law has frustrated some. More than 170 firms have applied but, to date, just two tiny grants have been made, to makers of less advanced chips. The Chips Act includes $39 billion in manufacturing grants to cover as much as 15% of the total cost of each project up to $3 billion per fab, as well as loans, loan guarantees and tax credits. Some lawmakers and industry officials worry that, because of permitting and other delays, it could be years before the taxpayer-subsidized factories are churning out made-in-America chips. - Eager for Economic Wins, Biden to Announce Billions for Advanced Chips – WSJ

Running Out: European Union leaders agreed to a $54 billion budget aid package for Ukraine on Thursday, locking in their financing for Kyiv for the next four years and overcoming weeks of opposition from Hungarian Prime Minister Viktor Orban. The decision is a major boost for Ukraine, which could have started to run short of funds in coming weeks to pay for salaries, pensions and other basic services. However, Ukraine is relying on still-blocked U.S. assistance to cover its full budget gap for 2024 and maintain military supplies. For now, Russia’s gains in Ukraine have been minimal, despite the lack of fresh Western assistance. But with Russia expanding its defense industry and increasing spending on the war, Ukraine faces a widening gap in critical weaponry such as ammunition, leading to warnings that Kyiv’s war-weary forces could be forced to retreat in coming months. - EU Leaders Agree to $54 Billion Ukraine Aid Package as Hungary’s Orban Backs Down - WSJ

Still Tight: Japan’s labor market showed further signs of tightness in December, driven by a manpower shortage across a swath of sectors in a closely-watched development as companies engage in annual wage negotiations with unions. The unemployment rate fell to 2.4%, the ministry of internal affairs reported Tuesday, its lowest reading since January. The number of people with jobs rose by 380,000 from a year earlier, a 17th consecutive increase. Industries that led the increase in employment included manufacturing, lodging and food services. The job-to-applicants ratio edged lower to 1.27 from 1.28, missing economists’ expectations for the gauge to be unchanged, the labor ministry reported. - Japan Job Market Remains Tight, Keeping Hopes for Wage Hikes - Bloomberg

Podcasts and Videos:
For Fun:
VIEWS EXPRESSED IN “CONTENT” ON THIS WEBSITE OR POSTED IN SOCIAL MEDIA AND OTHER PLATFORMS (COLLECTIVELY, “CONTENT DISTRIBUTION OUTLETS”) ARE MY OWN. THE POSTS ARE NOT DIRECTED TO ANY INVESTORS OR POTENTIAL INVESTORS AND DO NOT CONSTITUTE AN OFFER TO SELL -- OR A SOLICITATION OF AN OFFER TO BUY -- ANY SECURITIES AND MAY NOT BE USED OR RELIED UPON IN EVALUATING THE MERITS OF ANY INVESTMENT.THE CONTENT SHOULD NOT BE CONSTRUED AS OR RELIED UPON IN ANY MANNER AS INVESTMENT, LEGAL, TAX, OR OTHER ADVICE. YOU SHOULD CONSULT YOUR OWN ADVISERS AS TO LEGAL, BUSINESS, TAX, AND OTHER RELATED MATTERS CONCERNING ANY INVESTMENT. ANY PROJECTIONS, ESTIMATES, FORECASTS, TARGETS, PROSPECTS AND/OR OPINIONS EXPRESSED IN THESE MATERIALS ARE SUBJECT TO CHANGE WITHOUT NOTICE AND MAY DIFFER OR BE CONTRARY TO OPINIONS EXPRESSED BY OTHERS. ANY CHARTS PROVIDED HERE ARE FOR INFORMATIONAL PURPOSES ONLY, AND SHOULD NOT BE RELIED UPON WHEN MAKING ANY INVESTMENT DECISION. CERTAIN INFORMATION CONTAINED IN HERE HAS BEEN OBTAINED FROM THIRD-PARTY SOURCES. WHILE TAKEN FROM SOURCES BELIEVED TO BE RELIABLE, I HAVE NOT INDEPENDENTLY VERIFIED SUCH INFORMATION AND MAKE NO REPRESENTATIONS ABOUT THE ENDURING ACCURACY OF THE INFORMATION. I MAY OR MAY NOT HAVE POSITIONS IN ANY STOCKS OR ASSET CLASSES MENTIONED. I HAVE NO AFFILIATION WITH ANY OF THE COMPANIES OTHER THAN EXPLICITLY MENTIONED.