


"No Landing” Fears Overdone as Strong Start to 2023 Will Fade - MIDDAY MACRO WEEKEND READ– 2/17/2023
Color on Markets, Economy, Policy, and Geopolitics

“No Landing” Fears Overdone as Strong Start to 2023 Will Fade - MIDDAY MACRO WEEKEND READ– 2/17/2023
Overnight and Morning Recap / Market Wrap:
Price Action and Headlines:
Equities are lower, with a mixed bag of sector/factor performance on the week, generally indicating a still cyclical but more cautious tilt as a barrage of new data and Fed speakers reinforced the higher for longer narrative and moved the S&P below its two-week range
Treasuries are higher, moving yields off the highs of the week seen yesterday following the stronger-than-expected PPI report; however, 2yr Treasury yields are still higher by around 50bp on the month, with rising real rates tightening financial conditions and jostling the MOVE index higher
WTI is lower, down for a second day, as inventory data earlier in the week showed a strong build. However, the EIA showed reduced OPEC+ supply and higher demand on an improving global growth story, projecting a tighter market in ’23, although markets mainly shrugged this off

Narrative Analysis:
There has been a relatively muted pullback in equities on the week given the string of stronger economic and inflationary data as well as more hawkish Fed rhetoric. Markets have increasingly priced in a “higher for longer” scenario, which has moved yields, and real rates notably higher, weighing on earning multiples. So why hasn’t there been more carnage? Reduced recessionary fears have allowed for negative earning revision worries to subside, and positioning has generally continued to become more neutral (from underweight) as contained volatility in both equities and rate markets, as well as the resumption of a more historical correlation between the two, have allowed better participation and kept the breadth of the rally still positive, even after this weeks pullback. The consolidation of the January rally basically continues, with today’s OPEX looking to leave the S&P towards the bottom of its two-week trading range. Elsewhere, global data continues to come in stronger than expected, with other central banks also noting the potential for a tighter-than-expected policy stance. Sentiment about China’s economy and its real estate sector, in particular, continues to improve, supporting industrial metals with copper and iron ore up on the week. Oil, however, is not benefiting from this more optimistic outlook on growth, with traders more focused on current inventory gluts than expected supply deficits moving forward. The agg complex is more mixed, but the DB Agg Index ended the week slightly higher, helped by droughts in Western Europe and South America. Finally, the dollar is slightly higher on the week, with the $DXY reaching over 104.5 yesterday and continuing to base technically.
The Russell is outperforming the S&P and Nasdaq with Low Volatility, High Dividend Yield, and Small-Cap factors, as well as Utilities, Consumer Staples, and Health Care sectors all outperforming on the day. The week had a more defensive tilt from sector performance (Utilities and Staples), although still cyclical tilted due to industrials and discretionary outperforming. Better economic growth data supported small-caps, helped by higher yields, while the low volatility factor also outperformed.

@KoyfinCharts
S&P optionality strike levels have the Zero-Gamma Level at 4107 while the Call Wall is 4200 and Put Wall is 4050. Today’s OPEX will see many of the positions which were boxing markets into the 4100-4200 area expire. Moving forward, this gives an edge to the downside because the loss of call positions across index/stocks has historically led to some mean reversion/consolidation of gains. While today's expiration is material in size, it's only about half that of January. Looking ahead, March OPEX is very large and likely a key market turning point. Further, the spread between realized vol and implied vol has collapsed, and markets would need a dovish change in rate expectations to allow RV to decline further. If RV does not shift lower, IV is too cheap and needs to be bought, and this could lead to market weakness moving forward.

@spotgamma
S&P technical levels have support at 4065 (major), then 4025 (major), with resistance at 4090, then 4130(major). Yesterday’s drop puts the S&P below the consolidation range it had been in for two weeks, with a bull flag formation building since the start of February. 4075 is now a critical level, and a close below indicates the bears are back in charge, while a recapture of 4105 would indicate a bear trap and resumption of the bull flag formation.

@AdamMancini4
Treasuries are higher, with the 10yr yield at 3.82%, lower by 4 bps on the session, while the 5s30s curve is unchanged on the session, moving to -16 bps.

Deeper Dive:
We will deliver a shorter “Deeper Dive” today because not much has changed since last week. “Good continues to be Bad,” and worries of no landing (stickier inflation and no recession) have grown, given continued strong-than-expected economic and inflationary data. With Fed officials increasingly talking about raising rates at the next meeting by 50bps and markets pricing out any cuts in ’23 while predicting for the first time that the Fed funds rate will be above 5% at the end of the year, real rates continue to rise, weighing on risk sentiment. In many ways, it says a lot that the S&P is only -3% off its recent highs, and risk assets, more generally, have performed as well, given the backup in yields. Investor surveys seem to indicate a more neutral level of positioning as fund managers have reduced recessionary worries but still see the current rally as questionable, positioning more “to not miss out” in case it continues verse any deeper bullish view. With cross-asset correlations normalizing and volatility relatively rangebound, increased participation and higher gross levels from traditional vol-orientated investors, such as risk parity, as well as more neutral views on equities from CTAs, are helping what has primarily been a retail-lead multiples-expansion driven rally so far this year from completely breaking down. How long this can last is the real question. We continue to see the Fed moving cautiously. February should not show such robust activity and high inflationary pressures, leading FOMC members to reduce their hawkish tilt going into the March meeting. The full cumulative effects of the tighter policy will increasingly hit growth moving into the summer just as the consumer runs down their excess savings and the job market increasingly cools. At the same time, we know shelter price increases are near their peak given what more timely data is showing (verse the highly lagged OER component of CPI). As a result, it is still our belief that inflation continues to trend lower at a pace that allows rate cuts around year-end, helped by continued supply-side normalization, reduced wage pressures, and a period of below-trend growth in the second half of the year, aka, we remain in the soft-landing camp.
Real rates came into this week already rising on the month after January’s strong jobs report. They only rose further after global inflation data remained “sticky,” boosting expectations that central bank policy is going tighter for longer in the U.S., Eurozone, and Australia. The global tightening wave that was supposed to have peaked is instead now gathering new strength as policymakers increase their hawkish mantra that there is more to do. At this point, data around the globe offers them plenty of reasons to be vigilant, and markets are not pushing back. Specific to the U.S., we now have enough data to know that the economy started 2023 on solid footing, whether it be January’s jobs report, retail sales, industrial production, or CPI/PPI inflation readings. Survey-based data has also been more stable, with ISM services bouncing higher in January, while manufacturing surveys, albeit more mixed, generally aren’t seeing activity contract as fast. In the end, with the Fed telling us they are more data dependent and March’s FOMC allowing for a forecasting reset (through new SEPs), the risk is skewed that even with only a 25 bp hike, the overall message will be much more hawkish. However, as we alluded to, a lot can happen in a month, and we remain doubtful that the current strong start in both activity and inflation is sustainable. With real final sales to private domestic purchasers effectively flat in Q4 ’22, there is clearly a loss of momentum due to slowing fixed investments. At the same time, despite increases in consumer confidence, growing household leverage and rising uncertainty over future incomes should weigh on discretionary spending. In summary, given the economy's headwinds, we aren’t buying that the solid start for the year is maintainable.

*The resilience in consumer activity and labor markets has again caught economic forecasters off guard

*The implied path for Fed funds is now at its highest level of the cycle

*Rising real yields have not weighed on earnings multiples

*Higher frequency data is showing a slowing in foot traffic at restaurants in February

*Lower levels of temporary workers and rising layoffs mean there should be some cooling in labor markets coming
Econ Data:
Headline consumer prices increased by 0.5% in January, the most in three months, and in line with the market forecast. This monthly gain moved the annual inflation rate to 6.4% from 6.5% in December. Core consumer prices increased by 0.4% MoM, the same pace as in the prior month and in line with market estimates, moving the annual rate to 5.6%, the lowest since December 2021. Energy prices were higher due to a 2.4% MoM increase in gas prices and a 6.7% MoM increase in natural gas costs from utilities. Food was a little more bifurcated, with food at home rising 0.4% MoM due to increases in grains and protein-orientated foods, as well as other foods at home, but saw decreases in fruits and vegetables, while food away from home rose by 0.6% MoM. The price of core goods rose 0.1% MoM, with apparel and medical care rising, while autos (new and used) fell on aggregate. Core services rose 0.5% MoM, again driven higher by increases in the shelter component, which slowed slightly to 0.7% MoM from 08% MoM in December. Core services CPI ex-shelter eased to 0.3% MoM from 0.4% MoM, mainly due to increases in transportation costs while medical care services fell.
Why it Matters: Overall inflation picked up in January despite a slowing in core services X-shelter, giving the Fed a mixed message from January’s CPI report. Over the last three months, the core CPI has risen at a 4.6% annualized rate, which compares to the 4.3% YoY for December. Over six months, the core rate is now 5.3%. The shelter index remains the largest contributor (0.7% at 34.4% weight), accounting for nearly half of the monthly headline increase. Given the known lag in the shelter component, now well-known decreases in home prices and new rental leases should increasingly weigh on further increases on this now heavier-weighted component. On the other hand, core goods continue to trend lower and are now below the Fed target of 2%. Used car prices fell again in January by -1.9%, which shaved 0.1% point off the core inflation rate despite increases in the Manheim Used Car Index over the period, likely meaning they will increase in February’s report. Health insurance prices continue to decline rapidly on the arcane methodology used in the CPI, falling by -3.6%. The Cleveland Fed’s trimmed mean CPI measure has dipped below its peak, but remains above 6%. Meanwhile, the median has risen to a fresh high above 7%. This shows that half of the constituents of the index have inflated by more than this over the past year, which looks like decisive evidence that inflationary pressure is not meaningfully decelerating yet. Further, excluding food and fuel, flexible consumer price inflation, as measured by the Atlanta Fed, is now negative after a massive spike, while sticky CPI remains above 6%. This could be interpreted as a sign that inflation is becoming more embedded, leading the Federal Reserve to keep rates higher for longer.

*Rises in the cost of gasoline and natural gas lead to an increase in the headline reading, with other components remaining more stable in their monthly gains

*Shelter continues to be the overwhelmingly most significant contributor to increases in the service CPI but will also increasingly show declines moving forward

*Transportation was the largest contributor to core services ex-shelter CPI, followed by education and communication

*Trimmed Mean and Median inflation measures by the Clevland Fed show inflation has not yet meaningfully peaked

*Core sticky CPI ticked back up while core flexible CPI fell further and is now negative

*Beginning with January's release, housing–already the single biggest component of CPI–will account for even more of the index. Transportation, another big expense, will account for less in part because of a de-emphasis on used car and truck prices
The Producer Price Index increased 0.7% in January, the most in seven months and higher than market forecasts of 0.4%, moving the annual rate to 6.0%. Core producer prices increased 0.5% month-over-month, higher than an upwardly revised 0.3% in December and forecasts of 0.3%, moving the annual rate to 4.5%. Final goods prices rose by 1.2% MoM, led by a 6.2% surge in gasoline cost. As a result, core goods increased by a lower 0.6% MoM. Final service prices rose by a more modest 0.4% MoM. Trade & Transportation, and Warehousing services rose by a more modest 0.2% MoM. Within intermediate demand in January, the index for processed goods advanced by 1.0% MoM, and prices for unprocessed goods fell by -5.0% MoM. The index for services for intermediate demand moved up 0.5% in January after no change in December, mainly due to increases in the price of loan services.
Why it Matters: The majority of the monthly increase was due to a 5% increase in final demand for energy, mainly from gas (6.2%), diesel (10.9%), and natural gas (12.2%). Prices for final demand for foods fell by -1% MoM due to moves lower in vegetable prices (-33.5%), which was also seen in the CPI report, and to a lesser extent, the price of eggs (-12.5%), a hot topic these days. Intermediate unprocessed energy products were also notably lower, falling -8.5% MoM. As a result, processed energy goods had significantly higher inflation than unprocessed ones in the January report, giving a more mixed picture of coming inflationary pressures since energy tends to be a leading indicator. Further, intermediate inputs tend to lead inflation trends, and both intermediate processed (3.8% YoY) and unprocessed (2.3% YoY) goods continue to trend lower on an annualized basis even as final demand fell by much less over the month on an annualized basis. Finally, prices for intermediate services did pick up to 0.5% MoM after being Flat in December, driven by increases in transportation & warehousing and other costs.

* A major factor in the January rise in prices for final demand services was the index for hospital outpatient care, which jumped by 1.4%
Retail sales rose 3% in January, above market forecasts of a 1.8% rise and following a -1.1% drop in December. Excluding autos, sales increased by 2.3%, and excluding gas and autos, rose by 2.6%. Core retail sales (excluding auto, gas, food services, and building materials), contributing to the GDP calculation, rose by 1.7%. The most significant rises came from department stores (17.5%), food services and drinking places (7.2%), and motor vehicles and parts (5.9%), with almost all categories rising other than sales at gasoline stations, which were flat.
Why it Matters: The January retail sales report was significantly stronger than expected and will lead to an upward revision to first-quarter GDP estimates. However, this follows two months of weakness in sales, making this report look more like a statistical offset to the recorded declines in spending in November and December. In aggregate, headline retail sales over the last three months are only up 3.0%, and the control group has only advanced at a 1.8% annual rate since October. As a result, a lot of the outsized beat was helped by seasonality, better weather in January, shoppers buying due to sales events, and even marginally by increased social security payments due to cost of living adjustments, all of which are one-time factors. However, to be clear, the resiliency of the consumer shown in this report will likely add to the Fed’s desire to keep rates “higher for longer” to help rebalance demand and supply in the economy.

*Notable that every category was positive on the month, with motor vehicle sales and Food and Services & Drinks being the largest contributors

*Shown another way, gasoline stations and food & beverage stores recorded the weakest growth in the month
Industrial production was unchanged in January after falling by a revised -1.0% in December, missing market expectations of a 0.5% increase. On an annual basis, industrial output rose 0.8%, the least since March 2021. Manufactured output rose by 1.0% MoM. Durable, nondurable, and other manufacturing recorded advances of 0.8%, 1.1%, and 2.2%, respectively. Mining output increased by 2.0%. The output of utilities fell by -9.9% MoM, as a swing from unseasonably cool weather in December to unseasonably warm weather in January depressed the demand for heating. Motor vehicle production rose by 0.5% MoM, consumer goods output fell by -0.7% MoM, the output of construction supplies increased by 0.8%, and business equipment output rebounded to 1.2% MoM. The capacity utilization rate fell slightly to 78.3% in January from 78.4% in December (this utilization rate was 77.3% pre-Covid in February 2020).
Why it Matters: The softer-than-expected headline industrial production reading was entirely a result of the large drop in utilities output on "unseasonably warm weather" in January following "unseasonably cool weather" in December. Manufacturing output gained 1.0% in January, but December's output was revised lower to -1.8% MoM (initially reported down 1.3% MoM), although there was an upward revision to November, which is now a decline of -0.8% MoM (initially -1.1% MoM). As with retail sales, there was a strong rebound in January manufacturing output following weakness in November and December. However, the rebound in manufactured output in January still falls short of offsetting the declines in output in November and December, and manufactured output over the last three months has declined by -6.4% on an annualized basis. Further, business equipment spending showed the strongest gains in January but is still down by -7.9% at an annual rate over the last three months. Nonetheless, January’s economic data for employment, consumer spending, and manufacturing suggest that 2023 is off to a strong start.

*Manufacturing took a notable turn higher, helped by machinery (1.7% MoM), food & beverage (1.7%), and chemicals (1.6%)

*Utilities production had a significant drop in January due to warmer weather reducing heating needs
Housing starts fell by 4.5% to a seasonally adjusted annualized rate of 1.309 million in January, the lowest since June 2020 and well below market expectations of 1.36 million. Single-family housing starts were down by -4.3% MoM, while multi-units decreased by -5.4% MoM. Starts declined in the Northeast (-42.2% to 119K) and in the Midwest (-25.9% to 123K) but rose in the South (7.3% to 760K) and in the West (5.5% to 307K). Building permits rose 0.1% MoM to a seasonally adjusted annual rate of 1.3 million in January. Figures came below market expectations of 1.35 million. Single-family authorizations fell by -1.8%, while multi-unit rose by 2.5%. Permits increased in the South (+3% to 762K) and Midwest (+1.7% to 178K) but decreased in the Northeast (-7.8% to 106K) and the West (-4.6% to 293K).
Why it Matters: It was the biggest monthly drop in housing starts since July and the lowest level of new building permits since May 2020, driven primarily by single-unit projects. After some signs that the housing market was stabilizing, weakness seen in this report continues to show affordability (through higher prices or financing costs) for single-family homes continues to weigh on construction activity, although there is still a historically high number of starts/permits in the pipeline and multi-unit remains strong.

*At the absolute level, starts and permits are still within recent norms

*The weakness in new starts and permits has been primarily in the single-family housing area

*The backlog of multi-unit housing projects continues to grow
The NAHB/Wells Fargo Housing Market index increased to 42 in February, the highest since September and beating market forecasts of 37. The gauge for current sales conditions rose to 46 from 40, sales expectations in the next six months went up to 48 from 37, and traffic of prospective buyers edged 6 points higher to 29. 31% of builders reduced home prices in February, down from 35% in December
Why it Matters: It was the biggest monthly gain in nearly a decade, excluding the rebound after the 2020 COVID-19 lockdowns. “Even as the Federal Reserve continues to tighten monetary policy conditions, forecasts indicate that the housing market has passed peak mortgage rates for this cycle. And while we expect ongoing volatility for mortgage rates and housing costs, the building market should be able to achieve stability in the coming months, followed by a rebound back to trend home construction levels later in 2023 and the beginning of 2024”, said NAHB chief economist Robert Dietz. “The nation continues to face a sizeable housing shortage that can only be closed by building more affordable, attainable housing. However, the two monthly gains for the HMI at the start of 2023 match the cautious optimism noted by a large number of builders at the recent International Builders’ Show in Las Vegas, who reported a better start to the year than expected last fall,” said NAHB Chairman Alicia Huey.

*NAHB optimism is up for another month, as the extreme plunge last year looks to be ending
The NFIB Small Business Optimism Index rose to 90.3 in January from a six-month low of 89.9 in December. The proportion of owners expecting better business conditions over the next six months increased by six percentage points to -45%. Firms report inflation as their single most important problem (26%), but this has fallen six percentage points since December.
-4% of owners reported higher nominal sales (up four points from December). However, expectations for higher sales moved lower to -14% (down four points). 42% of owners raised average selling prices (down one point). The frequency of reports of positive profit trends was -26% (up four points). Among owners reporting lower profits, 27% blamed weaker sales, 26% blamed the rise in the cost of materials, and 15% cited the usual seasonal change. For owners reporting higher profits, 53% credited sales volumes.
46% of owners reported raising compensation, while 22% plan to raise compensation in the next three months (down five points). 45% of owners reported job openings that were hard to fill (up four points). 10% of owners cited labor costs as their top business problem, and 24% said that labor quality was their top business problem.
59% of owners expect capital outlays (up four points), with new equipment being the primary driver. 21% of owners are planning capital outlays in the next few months.
6% of owners expect inventory increases (up six points). A net negative 1% of owners viewed current inventory stocks as “too low.” 25% of owners (continued) to report supply chain disruptions having a significant impact on their business.
Why it Matters: Small business optimism improved modestly in January; however, there was a more positive broader tone. Employment-related components continued to show intentions to hire and elevated job openings. At the same time, current plans to raise compensation rose further, though the share planning to raise compensation in the future declined. The share of firms currently raising prices fell slightly; however, the share planning to raise prices rose, and both shares remain elevated. Finally, the percentage of firms reporting “inflation” as their single most important problem remained the most commonly cited most important problem. So in combination, close to half of small business plan to raise prices, increase compensation, and the majority cite inflation as their number one problem. All in all, still a long way back to inflation normality. Separately, as seen elsewhere, firms consider inventory levels at more neutral levels.

*The majority of sub-categories improved on the month, although the overall gain in the headline index was small

*The survey came in lower than expected and has become more disconnected from improvements in consumer confidence, while future plans to increase prices picked up

*Small businesses increased their plans to hire and continue to cite a lack of available skilled labor as a significant problem

*Current and Future compensation plans diverged, showing a need for labor now but possibly not as much in the future
The NY Empire State Manufacturing Index increased to -5.8 in February, climbing 27.1 points and beating market expectations of -18.0. New Orders (-7.8 vs. -31.1 in January) and Unfilled Orders (-9.2 vs. -14.3) contracted at a slower pace, while Shipments (0.1 vs. -22.4) moved to a neutral reading. Delivery Times (-9.2 vs. 0.9) shortened, and Inventories (6.4 vs. 4.5) grew slightly. Employment (-6.6 vs. 2.8) declined for the first time since early in the pandemic, and the Average Workweek (-12.1 vs. -10.4) shortened further for a third consecutive month. Both Prices Paid (45 vs. 33) and Prices Received (28.4 vs. 18.8) picked up somewhat notably. Looking ahead, firms expect general business conditions (14.7 vs. 8) to improve over the next six months, although most future sub-indexes were weaker. Capex spending and employment intentions fell more notably while price expectations rose for both paid and received.
Why it Matters: The report was less negative than feared, mainly due to sizeable improvements in new orders and shipments, although they both remained in contractionary territory. However, the increased inflationary readings seen in the prices paid and received sub-indexes do not bode well that the higher inflation seen in various January readings was temporary. Also, despite the improved future general activity outlook, the underlying six-month-ahead sub-indexes broadly weakened. Finally, it is notable that the current employment sub-index moved into contractionary territory while the future employment outlook is only slightly above neutral. In combination, these are the lowest hiring activity/intention readings for those sub-indexes since the pandemic began.

*A notable rebound in both the current and future general business conditions readings in February

*Current employment measures, both number of employees and workweek, moved into contractionary territory
The Philadelphia Fed Manufacturing Index fell to -24.3 in February, from -8.9 in January, compared to market expectations of -7.4. New Orders (-24.3 vs. -8.9) fell notably further into contractionary territory, while Unfilled Orders (-17 vs. -19.2) stabilized slightly but also remained well in negative territory. Shipments (8.7 vs. 11.1) fell but continued to be expansionary. Delivery Times (-13.6 vs. -5.6) shortened further while Inventories (15.3 vs. 0.9) expanded notably. The pricing indexes were split with Prices Paid (26.5 vs. 24.5) expanding and Prices Received (29.9 vs. 14.9) falling significantly. Measures of employment contracted, with the Number of Employees (5.1 vs. 10.9) moving closer to neutral while Average Workweek (-3.2 vs. 4) moved into contraction. Most of the survey's forward-looking indicators contracted, although future new orders improved. Future capacity-focused measures fell with unfilled orders, delivery times, and average workweek, all moving further into contractionary territory. Finally, Capex intentions moved lower but remained positive.
Why it Matters: The large headline drop was worse than the underlying sub-indexes indicated. Demand measures continued to contract while activity remained expansionary. Price readings were mixed, and employment was overly negative. Future outlook moved to a more neutral level, with the majority of sub-indexes moving lower, although employment intentions improved. Capex intentions also fell but still remained positive. The month’s special questions asked firms to forecast the changes in prices of their own products and for U.S. consumers over the next year. Regarding their own prices over the next year, firms’ expected an increase of 4.5%, down slightly from 4.8% when this question was last asked in November. Firms reported a median increase of 7% over the past year, down from 7.5%. The firms’ median forecast for the rate of inflation for U.S. consumers over the next year was 4%, down from 5% in November. Longer-term firms lowered inflation expectations to 3% from 4% in November.

*Both current and future outlooks weakened, with the current moving notably lower into contractionary territory.

*The majority of sub-indexes weakened in February, although future expectations of new orders and employment improved
NY Fed’s Survey of Consumer Confidence showed consumer inflation expectations for the year ahead were unchanged at 5% in January, the same as in December, and holding at low levels not seen since the end of 2021. Inflation expectations decreased to 2.7% at the 3-year-ahead horizon and increased to 2.5% at the 5-year-ahead. Home price growth expectations declined to 1.1%, the second lowest since May 2020, but expected price changes increased for gas by one percentage point to 5.1% and food by 1.4 percentage points to 9%. The median expected change in the cost of rent and medical care remained unchanged at 9.6% and 9.7%, respectively. Earnings growth remained steady at 3%, while unemployment expectations increased to 41.2%. The expectations for household income dropped by 1.3 percentage points to 3.3%, the largest drop in the nearly ten-year history of the series. Median household spending growth expectations decreased to 5.7%.
Why it Matters: Inflation expectations remained stable in January, still generally trending lower, according to the NY Fed’s consumer survey. More interestingly, views on the labor market and future income weakened. January's sizeable decrease in household income expectations was more pronounced among respondents with no more than a high school education, respondents older than 60, and those with annual household incomes below $50k. It was also the third subsequential month of declining spending intentions. Interestingly, and counter to the recent SLOOS report, the perceptions of credit access improved in January compared to a year ago. In summary, the consumer sees current inflation as more stable due to rising gas and food costs. They are more worried about their future income and job opportunities, which is causing them to plan to spend less despite better access to credit.

*Inflation expectations continue to trend lower despite a more sticky result in January’s survey

*Income expectations took a notable turn lower after picking up in the second half of last year
The NY Fed’s Quarterly Report on Household Debt and Credit showed total household debt rose by $394 billion, or 2.4%, to $16.90 trillion in the fourth quarter of 2022. Credit card balances increased by $61 billion to reach $986 billion, surpassing the pre-pandemic high of $927 billion; mortgage balances rose to $11.92 trillion, auto loan balances to $1.55 trillion, and student loan balances to $1.60 trillion. The share of current debt transitioning into delinquency increased for nearly all debt types.
Why it Matters: "Credit card balances grew robustly in the 4th quarter, while mortgage and auto loan balances grew at a more moderate pace, reflecting activity consistent with pre-pandemic levels," said Wilbert van der Klaauw, economic research advisor at the New York Fed. "Although historically low unemployment has kept consumer's financial footing generally strong, stubbornly high prices and climbing interest rates may be testing some borrowers' ability to repay their debts." The New York Fed also issued an accompanying Liberty Street Economics blog post examining credit card and auto loan delinquency, with a focus on borrowers by age. While delinquency transition rates appear relatively small, a closer look at the uptick reveals some signs of stress amongst younger borrowers who are beginning to miss some credit card and auto loan payments.

*The increase in credit card balances in 2022 was $130 billion, the largest annual growth in balances ever

*The delinquency transition rate for credit cards and auto loans increased by 0.6 and 0.4 percentage points, respectively
Policy Talk:
Another busy week of Fed officials becoming more hawkish. Yesterday, Cleveland Fed President Mester said she saw a "compelling economic case" for a half-point rise last FOMC meeting, while St. Louis Fed President Bullard said, “continued policy rate increases can help lock in a disinflationary trend during 2023." Both indicated they were open to resuming 50 bps hikes at the next meeting, but neither Mester nor Bullard are voters this year. These comments, along with the message conveyed by previous Fed speakers on the week and the generally stronger economic and inflation data, show that the market has now priced out any rate cuts on the year and moved higher the expected terminal rate the Fed would reach before stopping. Separately the White House is considering nominating Austan Goolsbee, who became president of the Federal Reserve Bank of Chicago last month, to serve as vice chair of the Federal Reserve’s board of governors, and voted in favor of a 25 basis point hike. The loss of Governor Brainard in isolation was a rather hawkish development, but replacing her with Goolsbee would likely be more neutral given his dovish tilt. However, it remains unclear who would make a more convincing argument as we advance, given Brainards longer tenure and stronger track record in public discourse over the current inflation debate.
Dallas Fed President Lorie Logan delivered a speech titled “Restoring Price Stability” at Prairie View A&M University. She reviewed the current state of inflation and labor markets, not delving too deep into either, mainly restating the baseline interpretation that more work was needed to get labor supply and demand back into a balance that would move inflation back to target. She did note that financial conditions had tightened significantly. Interestingly, she also commented that falling profit margins might help lower inflation. Logan believes the Fed can’t yet determine the peak interest rate level or how long to stay there, given a poor ability to forecast what is coming. But, in general, her view is that there is still not enough evidence that inflation will return to target given the current policy stance. Logan is a current voter, and her views of a more gradual approach are worth highlighting.
“Now, there has been some progress on inflation in recent months. But the question for monetary policy is not whether there has been some progress, but rather whether the progress will continue.”
“Housing inflation was still around 9% annualized for the last three months of 2022. But our research at the Dallas Fed suggests that housing inflation should peak later this year.”
“Core services inflation excluding housing has been running in a range of 4 to 5 percent for close to two years, with little sign of improvement. You could say this is the core of the inflation problem.”
“Wage pressures have moderated somewhat in the latest national reports on average hourly earnings and employment costs. I’d need to see a lot more data, though, to be convinced the labor market is no longer overheated.”

Technicals and Charts:
Four Key Macro House Charts:
Growth/Value Ratio: Value was little changed on the day but higher on the week, and Small-Cap Value is the best-performing size/factor on the day.

Chinese Iron Ore Future Price: Iron Ore futures are higher on the day and the week.

5yr-30yr Treasury Spread: The curve is little changed on the day but flatter on the week.

EUR/JPY FX Cross: The Euro was stronger on the day and the week.

Other Charts:

Earnings misses relative to the five-year average for the U.S. and EM were particularly bad in Q4 ‘22, with the Eurozone fairing better.

Cyclicals continue to outperform defensives, with fund managers increasing allocation to more neutral levels, according to a recent BoA survey

SentimenTrader’s Jason Goepfert shows that in the past four months, there have been 20 days when more than 80% of stocks within the S&P 500 advanced. This has been one of the largest-ever clusters of days with so many rising stocks during the four months following a 52-week low going back to 1950, he said. This suggests a broad, confident, and durable rally.

"Many clients are generally bearish on stocks at current prices given the earnings risk, but they are unwilling to sell into the strength for fear of missing out on a further rally," according to MS, with the NAAIM exposure index moving higher…

…Deutsche Bank is also showing positioning has become more neutral.
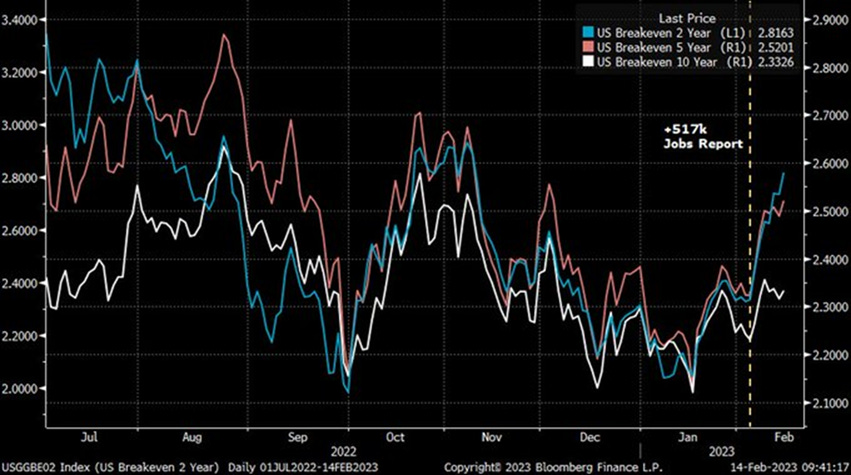
Breakeven inflation expectations have surged since we got the +517k jobs report on Feb 3, and today's CPI print didn't bring them down. Powell has mentioned needing this to stay contained, 10-yr is ok, but 2- and 5-yr readings have spiked. - @LizYoungStrat

The years-long relationship between the S&P 500's P/E (blue) & the real 10-Yr Treasury yield (plum, inverted) has broken down in the last few months--real yields imply a P/E of ~14x vs the current 18.5x. - @LizYoungStrat

Rising real wages may not hurt profit margins as much as in the past. - @PeterBerezinBCA

In January, the number of homes newly listed for sale declined by 5.4% compared to the same time last year. This is a much lower rate of decline than last month’s 21.0% decrease and November’s 17.2% decrease. However, new listings remain 25.0% below pre-pandemic 2017 to 2019 levels. - @calculatedrisk

The PBoC has vowed to implement a “targeted and forceful” monetary policy this year, with a focus on boosting domestic demand. This means the broad money supply will continue to increase
Articles by Macro Themes:
Medium-term Themes:
China’s Pandemic:
Make it Rain: The PBoC offered a short-term cash boost to lenders after a gauge of interbank funding costs soared to the highest in two years last week and stayed elevated since. Liquidity conditions have tightened of late amid a recovery in loan demand and economic activity. Chinese banks made 4.9 trillion yuan of new loans in January, the highest on record. Making the situation more complicated, there is a record maturity wall of interbank debt looming, which needs to be refinanced. “The move is a reflection of the PBOC’s unswerving stance to keep liquidity ample,” said Chen Kang, an analyst at Northeast Securities. “Funding in the money market turned tighter yesterday, and we see the net injection as an immediate and efficient response.” - China Ramps Up Economic Support With Biggest Ever Cash Injection - Bloomberg

Longer-term Themes:
Energy’s Midlife Crisis:
Not Enough: Retooling power systems built around fossil fuels to run on renewable energy will require far more copper than the miners can produce currently. For example, electric vehicles use more than twice as much copper as gasoline-powered cars, according to the Copper Alliance. As a result, annual demand is set to double to 50 million metric tons by 2035, according to an industry-funded study by S&P Global. Recycling more copper won’t bring enough new supply into the system, so the only alternative is to dig more out of the ground. But supply growth is forecast to peak as soon as 2024 as fewer new mining projects come online and existing sources dry up. It’s unclear whether a traditionally cautious mining industry will embrace the scale of investment needed to rewire the world. - How Lack of Copper Could Slow the Energy Transition - Bloomberg

Raising Capital: Energy companies are making plans to go public in the U.S. at the fastest rate in six years, as a sector that has long been out of favor benefits from renewed investor appetite for businesses that generate steady cashflows rather than prioritizing long-term growth. This year is already the most active year for energy IPOs since 2017, and bankers anticipate a further flurry of deals in the coming months. The deal boom is also set to hit Canada’s markets. Meanwhile, renewable energy producers are attracting growth-focused investors who had previously focused on areas such as technology that have suffered in the recent downturn. - US energy groups queue to go public as sector returns to favor - FT

Record High: Global fossil fuel consumption subsidies reached $1.097 trillion in 2022, the IEA estimated, double from 2021 and a 46% increase on the amount in 2012, the previous highest on record. The majority of the subsidies went to electricity ($399 bn) and natural gas ($399 bn), while oil subsidies accounted for $343bn, which remained lower than in 2012 and 2013. But coal subsidies totaled $9bn, the highest since IEA records began in 2010. Finally, many interventions to limit the effects of energy price volatility in advanced economies did not meet the IEA's definition of fossil fuel consumption subsidies but were still implemented. - IEA estimates record high fossil fuel subsidies in 2022 - Argus

Food: Security, Innovations, and Climate Change Implications:
Bumper Crop: The U.S. agriculture industry is projecting another strong year. Over the past year, global grain supplies have been reduced by poor weather and by Russia’s war. The tightening supplies sent corn and wheat prices soaring and helped drive U.S. net farm income to its highest mark in decades. Demand for livestock feed and soybean oil for biofuels has also increased in recent months and is expected to grow. China will also likely increase imports as the country reopens parts of its economy. Seed and pesticide sellers said those forces should support crop prices and keep farmers flush with cash, enabling them to shell out for higher-priced supplies. - High Food Prices, Chinese Demand Boost Prospects of U.S. Agriculture Companies – WSJ

Authoritarianism in Trouble?:
Silentium: India’s tax officials searched BBC offices in New Delhi and Mumbai, weeks after it aired a documentary critical of Prime Minister Narendra Modi in the U.K. Rights groups and opposition politicians denounced the move by India’s Income Tax Department as an attempt to intimidate the media. Britain’s publicly funded national broadcaster said it was cooperating fully with authorities and hoped “to have this situation resolved as soon as possible.” The reaction from the Modi camp to the documentary clearly shows a deep insecurity over past events. India has a tough religious juggling act to contend with, and the success of the BJP is indicative of an underly culture. Hence, any aggression against a free press/media is a lurch away from a free democracy. - Indian officials search BBC offices after Modi documentary - BBC

ESG versus the World:
Climate Focused: The U.S. Treasury is racing to assemble a list of contenders with strong credentials in climate finance to lead the overhaul of the World Bank following the early exit of Trump appointee David Malpass. The U.S., which traditionally chooses the World Bank president, is expected to select a candidate who could attract the backing of other leading shareholders and accelerate its reform to put climate change at the heart of its work. Some developing countries fear that the reforms may distract from the bank’s core mission of ending poverty. Development finance experts said the next president would need to assuage their concerns while still driving through significant changes. - U.S. leads search for new World Bank chief with climate at heart - FT

Cold Places (Deep Sea, Artic, and Space Colonization):
Upping the Ante: Mike Tierney, the National Security Space Association's head of legislative affairs, said Thursday he expects "another substantial increase" in the service's budget when the Biden administration releases its proposed budget next month. In the fiscal year 2023, the Pentagon requested $26.9 billion, and Congress provided $28.5 billion. He said Congress would continue to support larger space budgets due to concerns about Russian and Chinese anti-satellite weapons and a realization that U.S. space systems are vulnerable. - U.S. military space budget likely to get another boost in 2024 - SpaceNews

VIEWS EXPRESSED IN "CONTENT" ON THIS WEBSITE OR POSTED IN SOCIAL MEDIA AND OTHER PLATFORMS (COLLECTIVELY, "CONTENT DISTRIBUTION OUTLETS") ARE MY OWN. THE POSTS ARE NOT DIRECTED TO ANY INVESTORS OR POTENTIAL INVESTORS, AND DO NOT CONSTITUTE AN OFFER TO SELL -- OR A SOLICITATION OF AN OFFER TO BUY -- ANY SECURITIES, AND MAY NOT BE USED OR RELIED UPON IN EVALUATING THE MERITS OF ANY INVESTMENT.
THE CONTENT SHOULD NOT BE CONSTRUED AS OR RELIED UPON IN ANY MANNER AS INVESTMENT, LEGAL, TAX, OR OTHER ADVICE. YOU SHOULD CONSULT YOUR OWN ADVISERS AS TO LEGAL, BUSINESS, TAX, AND OTHER RELATED MATTERS CONCERNING ANY INVESTMENT. ANY PROJECTIONS, ESTIMATES, FORECASTS, TARGETS, PROSPECTS AND/OR OPINIONS EXPRESSED IN THESE MATERIALS ARE SUBJECT TO CHANGE WITHOUT NOTICE AND MAY DIFFER OR BE CONTRARY TO OPINIONS EXPRESSED BY OTHERS. ANY CHARTS PROVIDED HERE ARE FOR INFORMATIONAL PURPOSES ONLY, AND SHOULD NOT BE RELIED UPON WHEN MAKING ANY INVESTMENT DECISION. CERTAIN INFORMATION CONTAINED IN HERE HAS BEEN OBTAINED FROM THIRD-PARTY SOURCES. WHILE TAKEN FROM SOURCES BELIEVED TO BE RELIABLE, I HAVE NOT INDEPENDENTLY VERIFIED SUCH INFORMATION AND MAKES NO REPRESENTATIONS ABOUT THE ENDURING ACCURACY OF THE INFORMATION