Midday Macro – 9/28/2022
Market Recap:
Price Action and Headlines:
Equities are higher, with a relief rally underway, started due to a policy capitulation by the BoE and extreme oversold conditions
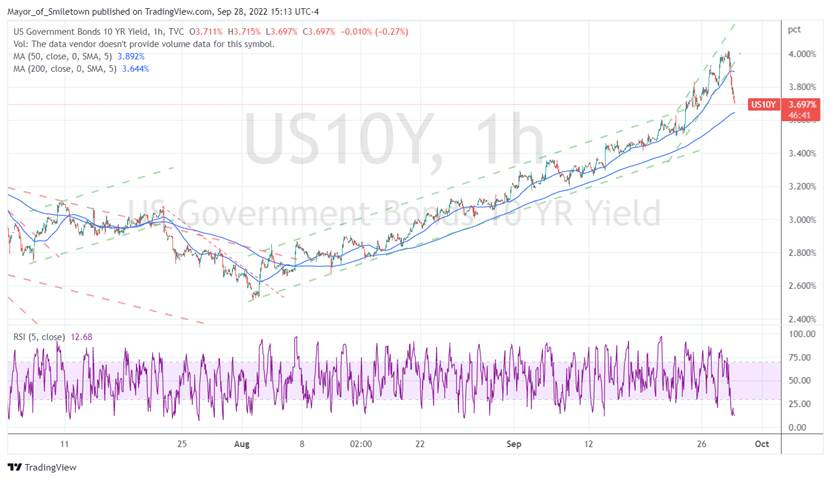
Treasuries are higher, with the curve steepening but large moves lower in yields across the curve after the 10yr touched on 4% overnight
WTI is higher, supported by bullish inventory data, expectations OPEC+ may cut production, renewed geopolitical concerns, a hurricane, and a generally more risk on tone today
Narrative Analysis:
Grey hairs are everywhere these days! This week is proving to be as eventful and stressful as any so far this year with massive moves in markets, especially in rates, domestically and abroad. The main story driving the narrative today is the implementation of yield curve control by the BoE as price action began to become (to put it nicely) “disorderly.” In reality, things are starting to break as the system cannot take the degree of tightening occurring globally at this pace. With real rates hitting recent highs, financial conditions at their tightest levels since the beginning of the pandemic, and the dollar going parabolic financial markets are starting to cry wolf. The question is, will policymakers take their foot off the hiking pedal? So far this week, the plethora of Fed speakers have kept the hawkish message going and likely will do so for a while longer. The domestic data this week continues to point to some resiliency in the economy. The underneath details for durable goods were stable when adjusting for inflation and new housing data showed new home sales picked up while prices fell. Regional business/manufacturing surveys also recovered slightly from summer lows. Of course, economic fundamentals have ceased to matter for some time; instead, the path of policy trumps all other variables. With that said, today, equities are seeing a broad relief bounce, breaking out of a post-FOMC meeting range, while Treasuries are ripping higher due to reduced policy tightening fears (or is it increased recession fears?). The energy sector is also rallying higher as supply/demand dynamics look more favorable. The agg market also continues to trend higher, given U.S. crop conditions and uncertainty over Ukrainian exports. Finally, the dollar is down, with most crosses outside the Yen up by over 1% today. Again things looked to be oversold, and all signs point to today being a broad relief rally/bounce likely driven by short covering.
The Russell is outperforming the S&P and Nasdaq with Small-Cap, Value, and Momentum factors, and Energy, Communications, and Consumer Discretionary sectors are outperforming on the day. There is a mix of sectors and factors (Healthcare & Communication and Low Volatility & Momentum) outperforming over the last week with a more defensive, less rate-sensitive tilt to leadership.
@KoyfinCharts
S&P optionality strike levels have the Zero-Gamma Level at 3986 while the Call Wall is 4200. Support is around 3600 (Put Wall). The options market pendulum has swung to maximum put (bearish) positioning. This has been associated with market bottoms. Some of these large put positions will clear out on 9/30, providing some “relief” to that max put position but markets could bounce into next week strictly based on an options view.
@spotgamma
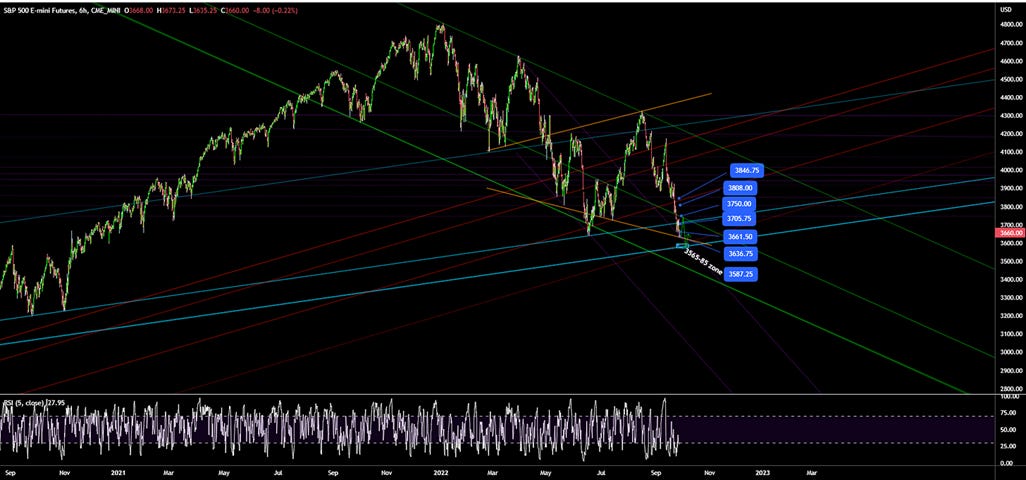
S&P technical levels have support at 3720, then 3700, and resistance at 3760, then 3820. Exactly a week ago was the FOMC meeting, and since the high set that day, the S&P has remained in one directional “sell the bounce” mode to a rare degree even by standards of this bear market, putting in 6 red days with every single bounce attempt for the last week being slammed back down within the same session. In the last 11 trading days, only two have been green, and relatively small ones at that. While certainly extreme, it's not overly unusual for this time of year, being the most bearish time of the year. The S&P is now breaking out of this multi-day range and needs to maintain a close above ideally 3730 but certainly 3700 if bulls have any hope for a multi-day rally to form.
@AdamMancini4
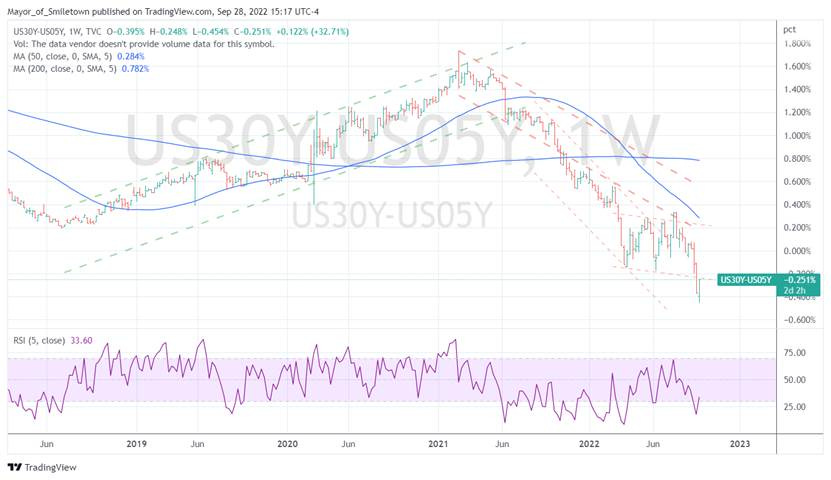
Treasuries are higher, with the 10yr yield at 3.70%, lower by 25 bps on the session, while the 5s30s curve is steeper by 11.5 bps, moving to -24.5 bps.
Deeper Dive:
Things are breaking, and policymakers' resolve to “fight inflation” will be further tested in the coming weeks/months. There is also further evidence that inflation has peaked with higher frequency/alternative data and business surveys continue to show pricing pressures are falling. Fed speakers have mainly stayed on message this week, reiterating Powell’s talking points that policy has entered restrictive territory but more tightening is needed because there is still not enough evidence that inflation is trending towards target. However, with real rates at highs for the year across the curve and financial conditions tighter than June, it is hard for the Fed to say the market is not where they want it to be. Despite the increased headwinds from the Fed since J-Hole and increased uncertainty from the global geopolitical landscape, we find market technicals and optionality, as well as the coming end of a weaker seasonal period of the year, compelling enough to increase longs in the S&P and start a long in long-end Treasuries as well as start a dollar short position. The generally stable hard data (outside of housing) and improving soft data (consumer and business sentiment) lead us to believe any earnings recession is still several quarters away as the impact of tighter Fed policy takes time to hit the real economy due to the still historically strong shape consumers and businesses are in. We acknowledge that the knife has not stopped falling and will keep risk capped through tighter stops, but as in June, we see the selloff as currently overdone and are looking for a tactical bounce as inflation continues to fall domestically while developments abroad reduce Fed tightening expectations in 2023.
Across the pond, the BoE has implemented yield curve control as the moves in both the Pound and rate markets there had become disorderly. With the winter coming, the economies of the U.K. and Europe will be further tested, although, despite yesterday’s Nord Stream sabotage, energy markets are still trending lower off summer highs, giving some relief to consumers and businesses as fiscal authorities increase subsidization. To be clear, we have a very high level of uncertainty on where things may go for the U.K. and Europe, both in real economic terms and regarding further escalation with Russia, with neither looking good. It is still a very uncertain global macro backdrop due to rising rates, tighter financial conditions, and continued geopolitical uncertainties. However, how much of that is priced in?
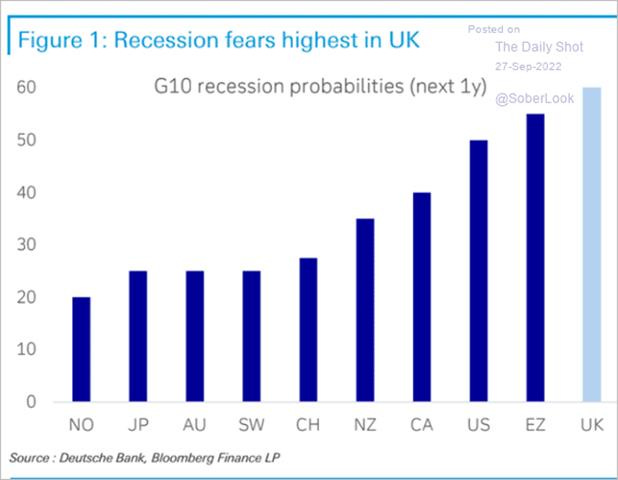
*The probability of a recession is now highest for the U.K. according to Deutsche Bank
*EZ and U.K. fiscal authorities have varied in their consumer energy support, but more is likely to come during the winter period
We have greater certainty over the health of the U.S. economy, at least until year-end, and believe that Q3 earnings should beat low expectations. Hence equities, whose earning multiples have been pressured by rising real rates and tighter financial conditions since J-Hole, should be able to get a bear market rally during a Q3 earnings season. This is in conjunction with our belief that the level of Fed tightening expectations will come off the current highly elevated levels as September’s inflation indicators weaken (as will be seen in October). With seasonals improving, maximum Fed hawkishness likely priced in, and sentiment at highly negative levels due to recession fears, we see the skew now favoring a partial retracement of recent price action. As always, our mantra is that markets are designed to inflict maximum pain, and the market is positioned very negatively/defensively, meaning a short-covering bounce is likely.
*Both the MOVE and VIX are to June highs, an area for both that has had resistance
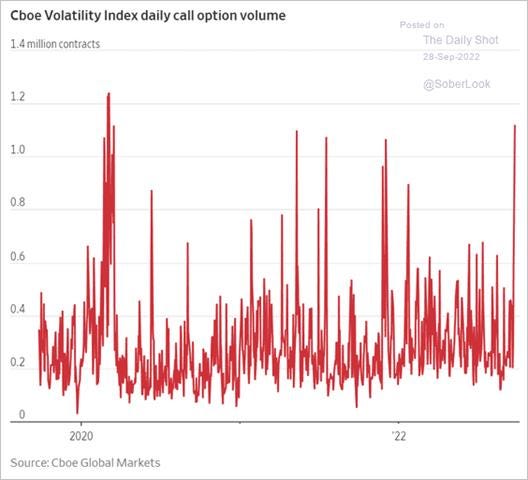
*Call buying volume for the VIX is also near recent highs, signaling an extreme level of bearishness
*The drawdown in Treasuries is extreme and unmatched in history. If a recession is coming and inflation has peaked, aren’t nominal yields increasingly reflecting a good value?
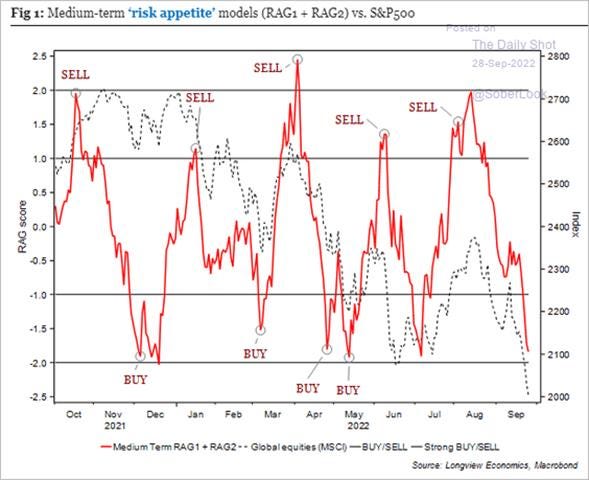
*A medium-term “risk-appetite” model by Longview Economics is at Buy levels last seen before the July rally, and although we are cautious about relying on any one model, its echoes our sentiment that things are likely oversold
*The history of Fed funds shows an inability to keep rates at a set “terminal” level for long periods. What are the odds the September SEPs change to a much shorter period as inflation falls further?
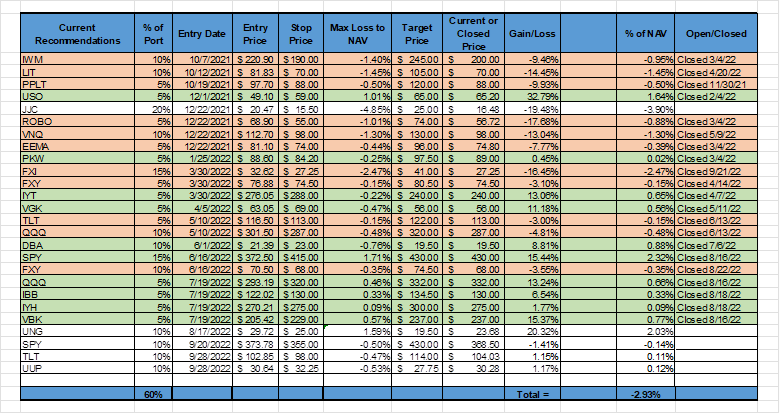
Due to the beliefs above, we are trying to replicate the tactical long equity trade we had success with in the June to August period. We are increasing our long S&P position through the $SPY ETF to 10%. We also see the selloff across the Treasury curve as overdone, especially in the long-end, and are starting a 10% long long-end Treasury position through the $TLT ETF. Finally, we also see the dollar as overbought and suspect the rate differential story and flight to safety that has driven its gains year to date to take a pause. It also seems likely there will be further fiscal authority intervention to stem losses in other currencies. As a result, we are entering a 10% short dollar position through the $UUP ETF. We continue to hold our long copper position and have been stopped out of our long Chinese equities position. We can no longer count on Beijing to act rationally and support economic growth and financial markets (yes, it took us too long to figure this out). Much more to say, and unfortunately, child-care responsibilities for a sick toddler are again limiting our writing time.
*The mock portfolio is now 60% invested and down nearly -3% since inception
AGAIN, PLEASE FORGIVE OUR REDUCED LEVEL AND LENGTH OF WRITING WHILE WE HAVE CHILDCARE RESPONSIBILITIES. WE PROMISE MORE ANALYSIS IS COMING DURING THESE HISTORICAL TIMES!! - MIKE
Econ Data:
New orders for durable goods declined by -0.2% in August, following a revised -0.1% drop in July and compared to market forecasts of -0.4%. A -1.1% decline in transportation equipment drove the decrease, driven primarily by nondefense aircraft and parts, which fell by -18.5%. Other declines were also seen for fabricated metal products (-0.7%) and nondefense capital goods (-2.7%). In contrast, increases were seen in orders for electrical equipment and appliances (1%), computers and electronics (0.8%), and primary metals (0.4%). Orders for non-defense capital goods excluding aircraft, a proxy for investment in equipment, jumped 1.3%, much more than 0.7% in July, and beating forecasts of a 0.2% rise. Total Shipments increased by 0.7% MoM while Unfilled Orders increased by 0.5% MoM. Finally, Inventories of manufactured durable goods increased by 0.2% in August, up for nineteen consecutive months.
Why it Matters: Despite the headline decrease, the underlying data was “good enough,” meaning adjusting for inflation and removing transportation equipment or focusing only on non-defense capital goods excluding aircraft; new orders, shipments, unfilled orders, and inventories continue to show a stable demand picture for durables. The stable monthly growth in inventories and slowly decreasing unfilled orders picture show some normalization in capacity constraints and future demand (in theory). Any signs that tighter financial conditions and higher real rates are meaningfully slowing demand for overall durable goods, specifically capital goods investment, did not materialize in this report.
*Non-inflation-adjusted total new orders for durable goods fell for a second month, but underlying components of new orders, as well as shipments, unfilled orders, and inventory data, show demand is relatively stable
New home sales rose by 28.8% in August to a 5-month high of 685K, above market expectations of 500K. It was the biggest increase since June 2020 as sales rose in the Northeast (66.7%), the Midwest (16.7%), the South (29.4%), and the West (27.5%). The median sales price of new houses sold was $436,800, up 8% from a year ago, but the smallest increase since November 2020, and the average sales price was $521,800. There were 461,000 houses to sell in August, corresponding to 8.1 months of supply in inventory.
Why it Matters: Of course, just when everyone is expecting the bottom to fall out for housing, new home sales hit a five-month high with an outsized monthly gain bringing it back to more historical levels for the time of year. Inventory levels look to be starting a move back to a more normal level after hitting a high of almost 11 months in July. If the trend continues, inventory levels should be back to a more historical level by the beginning of next year. Unfortunately, the composition of this supply is increasingly higher priced, worsening affordability and keeping first-time and lower-income home buyers sidelined. It is likely that price drops will increasingly change this composition in 2023, but for now, as seen and discussed in the below Case-Shiller write-up, the housing deflation cycle is only starting. Further, less supply of lower-priced homes should continue to put pressure on rents.
*Not seasonally adjusted houses sold-total and sold-not-started moved back to more normal levels for the end of the summer period
*Supply-side impairments continue to cap home builders' construction capacity, furthering delays as reduced demand has increased cost sensitivity. With that said, there are a lot of homes in the pipeline
*With mortgage rates still rising and new supply being increasingly at higher prices, don’t expect housing affordability to improve anytime soon
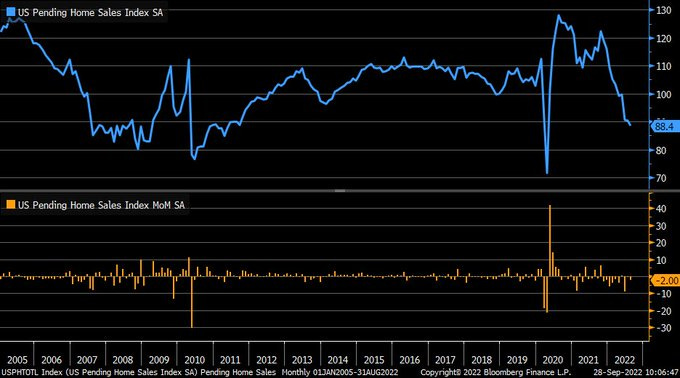
Pending home sales fell by -2% in August, a third consecutive monthly decline and worse than market forecasts of a -1.4% fall. For the second month in a row, pending sales retreated in the Northeast (-3.4%), Midwest (-5.2%), and South (-0.9%), while the West, again, registered an increase (1.4%).
Why it Matters: "The direction of mortgage rates - upward or downward - is the prime mover for home buying, and decade-high rates have deeply cut into contract signings," said NAR Chief Economist Lawrence Yun. As a result of the current interest rate environment and weaker economic activity, NAR expects existing-home sales to decline by -15.2% in 2022 to 5.19 million units, while new home sales are projected to fall by -20.9%. Yun notes that limited housing inventory and almost non-existent distressed property sales have supported home prices. Overall, he forecasts prices will rise by 9.6% in 2022.
*Pending home sales continue to decline and are now below the pre-pandemic average level following the GFC
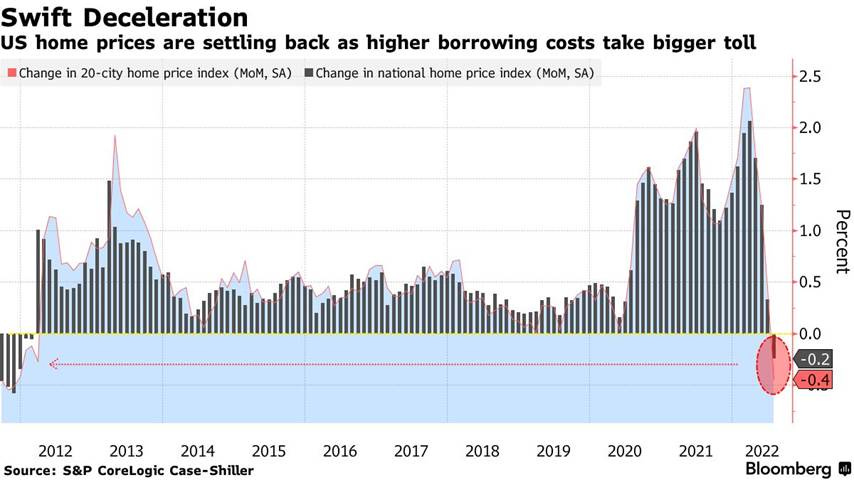
The S&P CoreLogic Case-Shiller 20-city home price index fell by -0.8% in July, the first monthly decrease since 2019, moving the annual increase down to 16.1% from 18.7%. All 20 cities reported a deceleration in prices. The National Composite Index rose by 15.8% in July, falling from 18.1% in June. The -2.3% difference between those two monthly rates of gain is the largest deceleration in the history of the index.
Why it Matters: There has now been a deceleration in annual price increases for a third consecutive month, with the drop between July and June being the largest in the history of the data series. “Although U.S. housing prices remain substantially above their year-ago levels, July’s report reflects a forceful deceleration,” says Craig J. Lazzara, Managing Director at S&P DJI. He went on to say that “as the Federal Reserve continues to move interest rates upward, mortgage financing has become more expensive, a process that continues to this day. Given the prospects for a more challenging macroeconomic environment, home prices may well continue to decelerate.” We agree; a multi-month housing price deflation is just starting.
*Before seasonal adjustment, the U.S. National Index posted a -0.3% month-over-month decrease in July, while the 10-City and 20-City Composites both posted decreases of -0.8%.
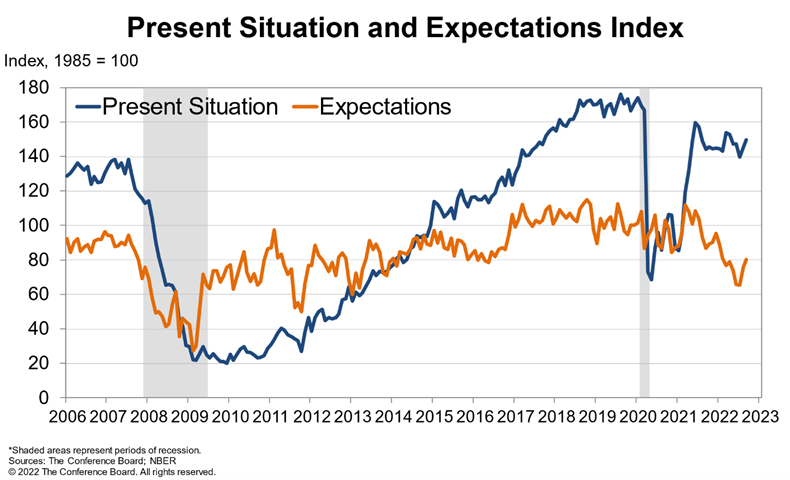
The Conference Board Consumer Confidence Index increased to 108.0 in September, up from 103.6 in August. The Present Situation Index—based on consumers’ assessment of current business and labor market conditions—rose to 149.6 from 145.3 last month. The Expectations Index—based on consumers’ short-term outlook for income, business, and labor market conditions—increased to 80.3 from 75.8. Consumers were more optimistic about current and future labor and business conditions, while future short-term financial prospects were more mixed.
Why it Matters: August’s report was very predictable given what is occurring on the ground with falling prices at the pump and a continuing strong labor market looking to have consumer confidence bottoming. “Consumer confidence improved in September for the second consecutive month, supported in particular by jobs, wages, and declining gas prices,” said Lynn Franco, Senior Director of Economic Indicators at The Conference Board. “Concerns about inflation dissipated further in September prompted largely by declining prices at the gas pump and are now at their lowest level since the start of the year… Meanwhile, purchasing intentions were mixed, with intentions to buy automobiles and big-ticket appliances up, while home purchasing intentions fell.”
*“Looking ahead, the improvement in confidence may bode well for consumer spending in the final months of 2022, but inflation and interest-rate hikes remain strong headwinds to growth in the short term.” - Lynn Franco
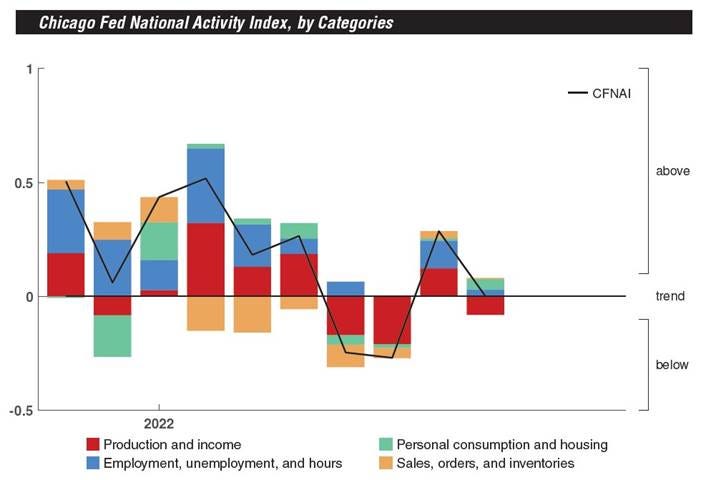
The Chicago Fed National Activity Index fell to 0 in August from a five-month high of 0.29 in July. The contribution to the overall index from production-related indicators declined to -0.08 from +0.12 in July. While the sales, orders, and inventories indicators stayed positive but ticked down to +0.01 from +0.03. Employment-related indicators contributed +0.03, down from +0.12. On the other hand, the contribution of the personal consumption and housing category moved up to +0.05 from +0.01.
Why it Matters: The index’s three-month moving average, CFNAI-MA3, which provides a more consistent picture of national economic growth, edged higher to +0.01 from -0.08. The CFNAI Diffusion Index, which is also a three-month moving average, increased to +0.11 from +0.01 in July. Both indicators signal that the US economy continued to expand in the three months to August. Forty-six of the 85 individual indicators made positive contributions to the CFNAI in August, while 39 made negative contributions. Twenty-nine indicators improved from July to August, while 55 indicators deteriorated, and one was unchanged. Of the indicators that improved, eight made negative contributions. At that time, August data for 51 of the 85 indicators had been published. For all missing data, estimates were used in constructing the index.
*With only 2/3 of the data collected, there may still be a revision, but production and income readings were the biggest drag in August’s economic data
The Richmond Fed composite manufacturing index was at 0 in September from -8 in the previous month. Improvement took place in Shipments (14 vs. -8 in August), New Orders (-11 vs. -20), Local Business Conditions (-11 vs. -14), as well as capital, equipment & software, and service expenditures. Measures of employment were more mixed with increases in Wages (40 vs. 27) while the Number of Employees (0 vs. 11) and Availability of Skills Needed (-6 vs. -3) worsened. On the price front, both Prices Paid (10.34 vs. 12.47) and Prices Received (7.66 vs. 9.31) fell. Looking forward, expectations of conditions over the next six months improved for shipments and volumes of new orders, but employment gauges fell.
Why it Matters: Although flat at the headline reading, there were broad improvements in many of the current sub-indexes, and the state of shock (from high levels of inflation and general uncertainty) displayed in August’s and July’s declines has stabilized and improved. The future outlook also indicates a greater supply/demand balance with fewer expectations for backlogs and slightly cooler employment readings. However, inflation expectations, as seen through prices paid/received, did slightly increase in the six-month forward outlook even as the current readings fell further. To us, this reads as continued improvements in supply-side impairments, helping expand production capacity, but expectations of shortages/problems to linger on at least another half year.
*Current and future expectations for activity and demand as well as overall business conditions improved, but off of low levels
The Dallas Fed’s Manufacturing Survey's general business activity index for manufacturing in Texas fell to -17.2 in September from -12.9 in August. Increases occurred in Production (9.3 vs. 1.2 in August), Capacity Utilization (13.4 vs. –0.6), Shipments (7.1 vs. 3.4), and Growth Rate of Orders (-1.7 vs. -14.7). There were some indications that supply side impairments worsened with Delivery Times (0.9 vs. -3.5) rising and Prices Paid for Raw Materials (37.1 vs. 34.4) edging higher. At the same time, Prices Received ( 18.1 vs. 26.8) fell notably. Employment measures worsened with Hours Worked (8 vs. 14) and Wages and Benefits (36.6 vs. 45.8) falling significantly. The future outlook was more mixed, with Company Outlook (-6.9 vs. -3) and Business Activity (-22.4 vs. -8.8) falling further into negative territory. At the same time, demand and employment sub-indexes increased while inflation measures picked up.
Why it Matters: Similar to Richmond, the Dallas manufacturing headline survey reading showed a further move into negative territory while the underlying sub-indexes outside of employment measures generally improved. When combined with future outlook readings, the report itself was an improvement from last month at the sub-index level, even if the general business conditions worsened. However, reading the comments and supply side shortages and logistical impairments are still heavily referenced, and the overall picture painted is negative and worsening.
*The general business activity in the Dallas district’s surveyed manufacturing sector decreased by more than expected in September
*General Business Conditions worsened while many of the demand/activity orientated sub-indexes improved outside of employment measures
Policy Talk:
There is a tremendous amount of Fed speakers this week following the September FOMC meeting’s blackout period. To keep things concise, we highlighted a few quotes that caught our eye from several speakers below. In summary, after reading/listening to the majority of speakers on our own, it is clear that recent market turbulence and global developments have not led to any significant changes in the hawkish message made clear at Jackson Hole and reiterated through September’s FOMC meeting by Chairman Powell and the SEPs. However, it is worth noting that a few speakers did highlight growing concerns about the pace of tightening, satisfaction over where markets, real rates, and financial conditions are, and a continued belief that supply-side inflationary pressures were continuing to improve.
Boston Fed’s President Susan Collins, in her first public remarks, gave prepared remarks Monday in a speech titled Perspectives on the Economy and on the Opportunities Ahead.
“…demand for goods and services clearly exceeds the economy’s productive capacity right now, which is being manifested in a very hot labor market.”
“Labor market conditions also differ from past cycles. Firms seem to have too few workers, not an excess, suggesting that this time a slowdown in activity may have a smaller impact on employment.”
“I anticipate that accomplishing price stability will require slower employment growth and a somewhat higher unemployment rate, and I take very seriously that unemployment is painful and its costs have been disproportionately concentrated among groups that have traditionally been marginalized.”
Atlanta Fed President Raphael Bostic appeared on CBS’ “Face The Nation” Sunday morning to give his views on policy and the economy.
“I actually think that there is some ability for the economy to absorb our actions and slow in a relatively orderly way. But we need to have a slowdown. There's no question about that. But I do think that we're going to do all that we can at the Federal Reserve to avoid deep, deep pain. And I think there are some scenarios where that's likely to happen.”
“I understand we've got a lot of uncertainty now. The situation in Russia that you spent the first part of this show on has got everyone on edge. But we do know that some bottlenecks are starting to ease. And I'm hopeful that over the next several months, we'll start to see that gap between the high demand and that lower supply narrow significantly, which will then translate into inflation moving closer to our target.”
Clevland Fed President Loretta Mester gave prepared remarks at MIT’s Golub Center for Finance and Policy on Monday regarding the current state of inflation and monetary policy.
“The Federal Reserve has not always been successful at achieving price stability, and there have been misses on both sides…The Fed has learned from these historical episodes. One lesson is the importance of a central bank remaining focused on its price stability goal.”
“Our business contacts tell us that supply chain disruptions remain a challenge, although they have learned how to better navigate them over time; they tell us that they have seen less improvement in the imbalance between the demand and supply of labor.”
“So despite the moderation in activity, housing prices and rents remain quite high. It typically takes some time for higher rents to flow through to the inflation measures, so growth in housing rent and shelter costs will likely keep inflation elevated for some time.”
“The rise in inflation expectations since last year has been concentrated in short-term expectations, which rose with the rise in gasoline and food prices. More recently, these short-term expectations have moved down with gasoline prices. Still, they indicate that consumers expect high inflation to prevail over the next year.”
Minneapolis Fed President Neel Kashkari did a WSJ Q&A session hosted by Nick Timiraos with Larry Summers to discuss the FOMC’s September policy meeting and future policy.
“We need to see some progress, and we are not seeing it yet… we’re also seeing wages continue to climb, we’re seeing that rents have been climbing, there’s a lot of increased inflation still in the pipeline, and this is stickier inflation, not just volatile inflation that we’ve been seeing with commodity prices and energy prices…”
“I think the overall stance of policy right now is tight in the sense that we are putting some downward pressure on inflation… Is it tight enough? I don’t know. But certainly, we are beginning to tap the brakes, and we’ve got more work to do, but we need to start to see inflation heading down before we can be convinced we’re headed in the right direction.”
“We’re going to try and achieve a soft landing, but we are going to get inflation back down to 2%.”
Chicago Fed President Charles Evans gave prepared remarks at the Official Monetary and Financial Institutions Forum in London on Tuesday.
“Recent indicators point to softness in consumption and business investment, as well as a large decline in activity in the housing sector. Lower real disposable income and tighter financial conditions are clearly in play…”
“…over the past couple of months, we’ve heard more reports of reduced job turnover and that some firms are finding it easier to attract qualified workers. These are signs that some of the unusual strength in labor demand may be waning.”
“Though the recent inflation data have been disappointing, most forecasters, myself included, anticipate that inflation in the U.S. will cool down substantially over the next couple of years.”
“…tighter monetary policy plays a very important role in my forecast of lower inflation. It is needed to pull back on aggregate demand and keep it from pushing too hard on today’s still-challenged supply conditions.”
Technicals and Charts:
Four Key Macro House Charts:
Growth/Value Ratio: Growth is higher on the day and the week. Large-Cap Growth is the best performing size/factor on the day.
Chinese Iron Ore Future Price: Iron Ore futures are lower on the day and on the week but generally flat.
5yr-30yr Treasury Spread: The curve is steeper on the day and the week.
EUR/JPY FX Cross: The Euro is stronger on the day and the week.
Other Charts:
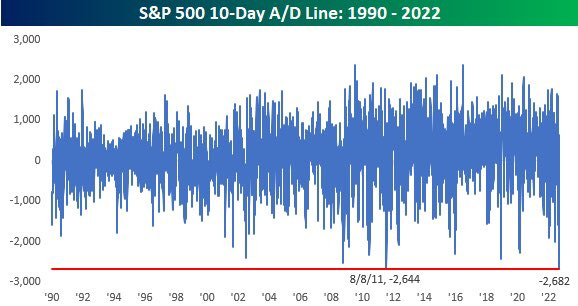
“.. after today’s session (9/26/2022), the S&P 500’s 10-day advance/decline (A/D) line dropped to .. a record low, meaning underlying breadth over the last 10 trading days has been the weakest it has ever been in the last 32 years.”- @bespokeinvest
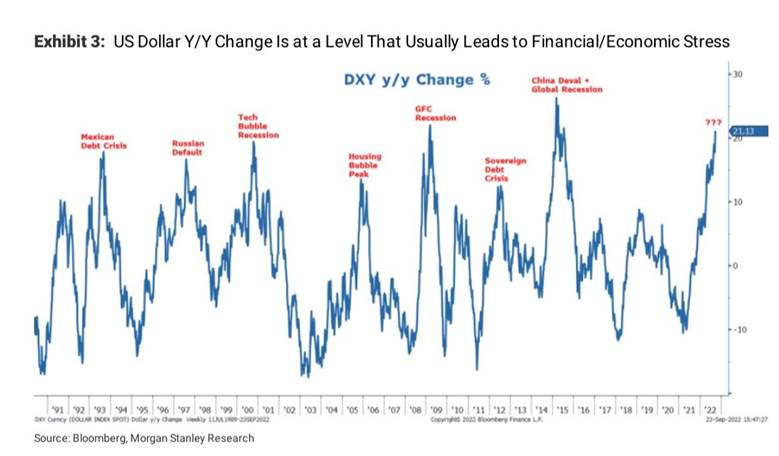
The strength in the dollar is heavily influencing the weakness in equities
The current drawdown, as measured by Gavekal, is unprecedented, with their measurement being close to -$60 trillion.
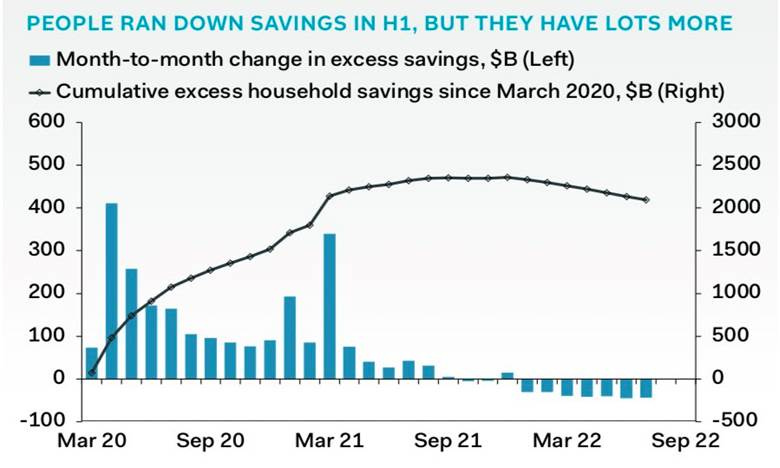
“Excess cash and other liquid assets now stand at some $3.3T in the household sector and about $300B in the corporate sector; that’s just over 14% of GDP, more than enough to swamp the impact of tighter financial conditions if it is spent.” - @pantheonmacro
“On a year-over-year basis, the DXY is now up 21% and still rising. Based on our analysis that every 1% change in the DXY has around a -0.5% impact on S&P 500 earnings, 4Q S&P 500 earnings will face an approximate 10% headwind to growth all else equal” - Morgan Stanley’s Wilson
The Zillow Observed Rent Index fell further in August, which means shelter inflation should be peaking, given what is happening in housing prices elsewhere, according to Morgan Stanley.
Goldman’s research team also highlighted that the owner’s equivalent Rent in the CPI measure is skewed towards urban apartments, and the rent catch-up in high-density zip codes appears to have peaked.
Paul Ashworth, the chief economist of Capital Economics, recently forecasted big falls in core goods price inflation is coming
Article by Macro Themes:
Medium-term Themes:
Real Supply-Side Situation:
Less Stuff Needed: Weaker Demand for Chinese Goods Spells End of Shipping Boom - Bloomberg
The cost of shipping goods from China has slumped to the lowest level in more than two years as the world economy stumbles, dimming prospects for container carriers that turned in record profits during the pandemic. A 40-foot shipping box from the world’s largest port of Shanghai to Los Angeles fetched $3,779 last week, the first time the spot price was below $4,000 since September 2020 and half the level of three months ago, according to Drewry. More declines are expected in the next few weeks.
Why it Matters:
In what’s typically the peak season for seaborne trade, global demand for Chinese goods is waning instead as consumers cut back spending because of inflation and the shift away from goods toward services. U.S. container imports aren’t falling off a cliff, but they’re slowing down to more normal levels seen before Covid-19. “It’s fair to say that the demand outlook for the trans-Pacific and container shipping generally is receding quickly,” said Simon Heaney, a senior manager of container research at Drewry.
Longer-term Themes:
National Security Assets in a Multipolar World:
Not Working: China Reins In Its Belt and Road Program, $1 Trillion Later – WSJ
China has spent a trillion dollars to expand its influence across Asia, Africa, and Latin America through its Belt and Road infrastructure program. After nearly a decade of pressing Chinese banks to be generous with loans, Chinese policymakers are discussing a more conservative program, dubbed Belt and Road 2.0 in internal discussions, that would more rigorously evaluate new projects for financing, the people involved said. They have also become open to accepting some losses on loans and renegotiating debt, something they had been previously unwilling to do.
Why it Matters:
Chinese President Xi Jinping once called the initiative “a project of the century,” but the overhaul exposes limits to his vision to reshape the global order. At a November meeting with senior officials, Xi noted that the international environment for Belt and Road was becoming “increasingly complex” and stressed the need to strengthen risk controls and expand cooperation, according to state media reports of the meeting. The ability to build soft power through generous lending is a powerful national security asset in the long run, and it looks like China is seeing new limits to this.
Electrification and Digitalization Policy:
Both Ways: US Agency Broke Into China’s Telecom Networks, State Media Says -Bloomberg
The National Security Agency’s cyber-warfare unit “penetrated and controlled” unnamed telecom operators, the Global Times reported on Thursday, citing information provided by officials. It gained remote access to its core networks through an email phishing attack on a leading university, which opened a route into the carriers. The attackers made off with network equipment and administrative passwords, file-transfer protocols, and other sensitive data, the newspaper said.
Why it Matters:
Beijing and Washington have increasingly sparred over claims of cyber-snooping, with China becoming more direct in naming American agencies as perpetrators. The US has in the past blamed China for widespread industrial espionage to “ransack” American companies, in addition to national security-related operations. But Beijing has taken a more aggressive approach in recent months, pushing back against US accusations. The Global Times has published multiple articles on reports from Chinese cyber companies, including the discovery by Qi An Xin Technology Group Inc.’s Pangu Lab of US-sponsored malware in domestic IT systems it claimed was linked to the NSA.
Behind the Firewall: Iran’s Internet Shutdown Hides a Deadly Crackdown - Wired
Iran’s current shutdown is the biggest since its November 2019 protests, when people took to the streets over drastic fuel price rises. Iran started shutting the internet down on September 19 as protests around Amini’s death gained momentum. The clampdown against Instagram and WhatsApp started on September 21. While shutting down mobile connections is hugely disruptive, blocking access to WhatsApp and Instagram cuts off some of the only remaining social media services in Iran.
Why it Matter:
In recent years, governments wanting to silence their citizens or control their behavior have increasingly turned to draconian internet shutdowns as tools of suppression. In 2021, 23 countries, from Cuba to Bangladesh, shut the internet down a collective 182 times. Iranian officials are no strangers to the practice. Iran’s latest internet shutdown is the third time the country has disrupted the internet in the past 12 months. Internet shutdowns can have a “huge” impact on protests because when people around Iran can’t see that others are protesting, they may be likely to stop themselves.
Rules Free: California 'BitLicense' Bill Vetoed by Gov. Gavin Newsom - CoinDesk
Democratic California Gov. Gavin Newsom vetoed a crypto licensing and regulation bill seen as a possible West Coast version of New York's "BitLicense" on Friday. BitLicense is a business license for digital currency activities in New York that's issued by the state's Department of Financial Services. In California, Assembly Bill 2269, would have created a licensing regime for anyone seeking to facilitate crypto transactions, similar to how money transmissions are overseen by the state's Money Transmission Act.
Why it Matters:
"Over the last several months, my administration has conducted extensive research and outreach to gather input on approaches that balance the benefits and risk to consumers, harmonize with federal rules, and incorporate California values such as equity, inclusivity, and environmental protection." As a result of our findings, it would be "premature" to create a licensing regime without considering feedback from this executive order, Newsom wrote. He also pointed to the possibility of future federal legislation or regulations. Newsome thinks his actions will help California keep an innovation edge in crypto over other states/places.
Commodity Super Cycle Green.0:
Network Effect: Hertz, BP Partner to Bring EV Charging Stations Across North America – WSJ
BP Pulse, which is BP’s EV charging business, would power and manage Hertz’s charging infrastructure under the newly released memorandum of understanding, the companies said. The charging infrastructure will be open to taxi and ride-sharing drivers, as well as the general public, the companies said. Hertz, which has signed deals to buy cars from Tesla, Polestar, and General Motors, said it has tens of thousands of EVs available at 500 locations across 38 states. Its goal is for one-quarter of its fleet to be electric by the end of 2024, Hertz said.
Why it Matters:
Demand for electric cars has surged in recent years, but charging infrastructure across the U.S. has failed to keep pace, prompting some complaints of challenges in using electric cars, particularly on long, interstate trips.Hertz said it already has invested in thousands of EV charging stations across its locations. The deal with BP will help expand its charging footprint. Car-rental companies have been adding electric cars to their fleets to bulk up their premium offers and help burnish their environmental credentials with investors.
Appendix:
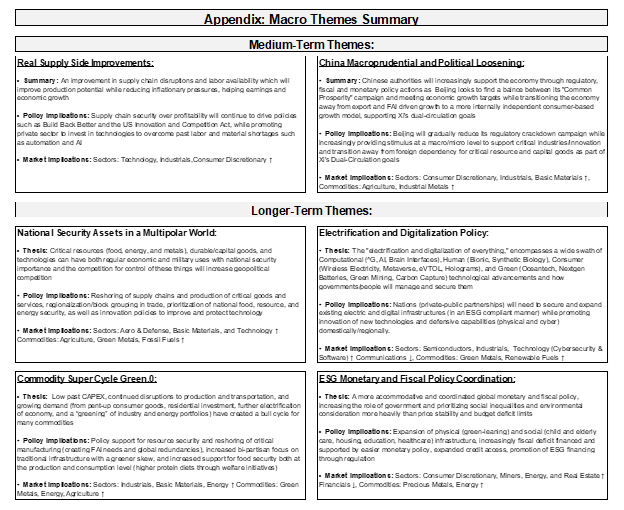
Current Macro Theme Summaries:
VIEWS EXPRESSED IN "CONTENT" ON THIS WEBSITE OR POSTED IN SOCIAL MEDIA AND OTHER PLATFORMS (COLLECTIVELY, "CONTENT DISTRIBUTION OUTLETS") ARE MY OWN. THE POSTS ARE NOT DIRECTED TO ANY INVESTORS OR POTENTIAL INVESTORS, AND DO NOT CONSTITUTE AN OFFER TO SELL -- OR A SOLICITATION OF AN OFFER TO BUY -- ANY SECURITIES, AND MAY NOT BE USED OR RELIED UPON IN EVALUATING THE MERITS OF ANY INVESTMENT.
THE CONTENT SHOULD NOT BE CONSTRUED AS OR RELIED UPON IN ANY MANNER AS INVESTMENT, LEGAL, TAX, OR OTHER ADVICE. YOU SHOULD CONSULT YOUR OWN ADVISERS AS TO LEGAL, BUSINESS, TAX, AND OTHER RELATED MATTERS CONCERNING ANY INVESTMENT. ANY PROJECTIONS, ESTIMATES, FORECASTS, TARGETS, PROSPECTS AND/OR OPINIONS EXPRESSED IN THESE MATERIALS ARE SUBJECT TO CHANGE WITHOUT NOTICE AND MAY DIFFER OR BE CONTRARY TO OPINIONS EXPRESSED BY OTHERS. ANY CHARTS PROVIDED HERE ARE FOR INFORMATIONAL PURPOSES ONLY, AND SHOULD NOT BE RELIED UPON WHEN MAKING ANY INVESTMENT DECISION. CERTAIN INFORMATION CONTAINED IN HERE HAS BEEN OBTAINED FROM THIRD-PARTY SOURCES. WHILE TAKEN FROM SOURCES BELIEVED TO BE RELIABLE, I HAVE NOT INDEPENDENTLY VERIFIED SUCH INFORMATION AND MAKES NO REPRESENTATIONS ABOUT THE ENDURING ACCURACY OF THE INFORMATION


