


Midday Macro – 8/5/2022
Market Recap:
Price Action and Headlines:
Equities are lower, with small-caps outperforming as today’s jobs report was too good, increasing Fed tightening expectations while reducing recessionary fears, which is bad, right?
Treasuries are lower, with the front-end heaviest hit after the report, driving two-year yields 20 bp higher to 3.25% and inverting parts of the yield curve further
WTI is flat, falling off session highs following a bounce off the better-than-expected jobs report, with OPEC+ staying the course as Saudi Arabia lowers some lighter oil prices while raising heavy ones in Asia, with Iran negotiation talks (to talk?) potentially resuming

Narrative Analysis:
Today’s significantly better than expected jobs data was too good, causing Treasury yields to spike higher after an already tough week. Equities have surprisingly shrugged off the rise in rate vol and are only marginally lower on the session with more duration-sensitive sectors/factors underperforming as expected. Technicals and optionality continue to be more positive with a consolidation/range-bound trading week looking to finish little changed after two significant positive weeks (+9%) to end July. Clearly, the story is different for Treasuries, and the recessionary fear trade that had driven the 10yr yield close to 2.5% has meaningfully reversed, with 2yr yields near highs last seen following the hot May CPI print (in June). WTI and Brent continue to channel lower as demand worries trump supply concerns, with OPEC sticking to its plan this week. Copper ended the week better bid, back near recent highs as more renewable infrastructure investment and hopes for a Chinese residential bailout grew. The ag market was better supported on the week but is still very much range-bound since July lows. Finally, the dollar rallied on the better economic data this week after trending lower into August, with the $DXY at 106.5. The Yen gave up much of its recent gains despite lower energy costs, while the Euro has been consolidating between 1.015 and 1.03 for two weeks now.
The Russell is outperforming the S&P and Nasdaq with Momentum, Small-Caps, and High Dividend Yield factors, and Energy, Financials, and Materials sectors are outperforming on the day. More cyclical sectors and factors (Technology/Communication and Growth) have outperformed over the last week.

@KoyfinCharts
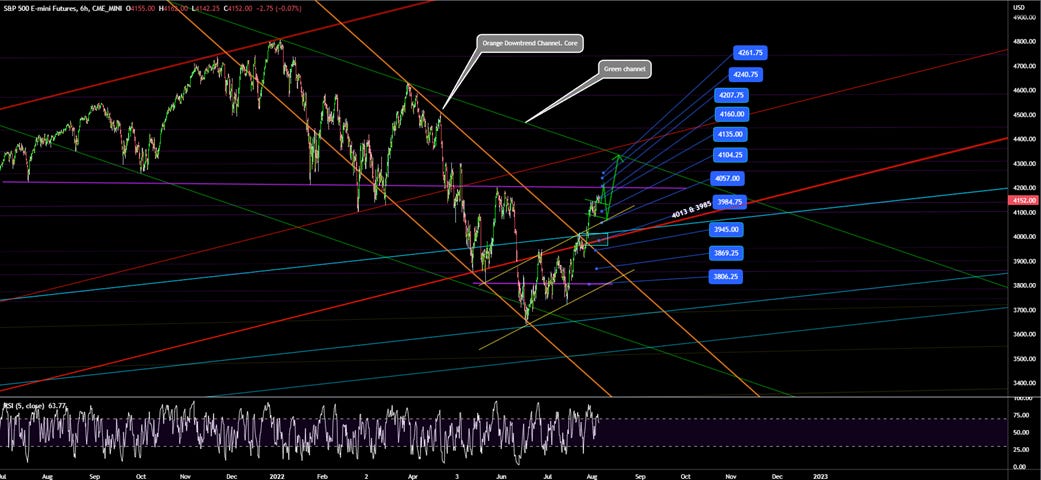
S&P optionality strike levels have the Zero-Gamma Level at 4101 while the Call Wall is 4200. Support is around 4075 (Vol Trigger), with resistance at 4200. Much is still the same since last writing; positive gamma is building, pressuring implied volatility, and this should remain into August OPEX. Break below 4000 invokes negative gamma, higher implied volatility, and potential for accelerated sell-off. Unlikely the call wall moves higher, so 4200 is the top of the trading range with strong resistance.

@spotgamma
S&P technical levels have support at 4100-05, then 4080, and resistance at 4160, then 4205. Consolidation continues with the sell-off in rates and increases in the MOVE index (rate vol), unable to knock equities out of their current range. Bulls remain in control above 4010, with a close above 4130 today being a positive sign given price action. Stepping back, the S&P looks tired, as yesterday's new high did not last, and 4200 has significant optionality and historical technical resistance. With RSIs reset, a new catalyst is needed to move out of consolidation mode above 4200 or back down to 4000.
@AdamMancini4
Treasuries are lower, with the 10yr yield at 2.84%, higher by around 15.5 bps on the session, while the 5s30s curve is flatter by 7.5 bps, moving to 9.7 bps.

Deeper Dive:
IT IS ALL ABOUT INFLATION. Please stand up and shout it out loud every morning when you wake up and before you go to bed. Don’t worry, your family and neighbors need to hear it too. Everything that improves the inflationary picture is positive for risk assets (period). Since the majority of inflation is from supply-side shortages, higher levels of employment mean a greater capacity to produce goods and services. Greater capacity means reduced shortages, reversing supply-side inflationary pressures, allowing monetary policy to normalize sooner, and stabilizing financial conditions. Hence positive economic data like today’s job report that increases aggregate demand while also increasing total production capacity is not negative. It also doesn’t necessarily mean the Fed needs to tighten faster. Let’s be clear, Fed officials still need to walk the line, raising rates further into “restrictive” territory and hawkishly jawboning markets and the U.S. consumer while they do that. This will keep financial conditions from overly loosening and reduce end demand due to “recessionary” fears. But the current inflationary pulse has always been about supply shortages, and higher levels of workers do not make that worse even with wages rising. Further, the actual effects of rate hikes will take some time to hit the economy materially, warranting the Fed to be patient given how much work forward guidance has already done to lower demand and tighten financial conditions and how uncertain the effects of QT will be moving forward. The Fed is also raising rates very fast, complicating the debate around the FOMC table (and reminding us of the flow vs. stock QE2 days). When the debate becomes more complicated, the doves tend to win the day as the institution is one of academics and bureaucrats, more risk-averse orientated people. The bottom line is that it looks plausible that the next two months of inflationary data will decelerate, reducing the need to hike 75 basis points in September and keeping the SEPs Fed funds terminal rate where it is. Of course, this also depends on inflation expectations materially weakening, but given the drops in prices at the pump, this is also very plausible.

*“Ya'll can't walk no line.” – June Carter - We will find out if the Fed can walk the line, tightening policy enough to re-trend inflation back to target while not causing a recession that hurts the labor market
It is becoming gospel that the economy has to enter a recession so demand falls enough for inflation to return to the Fed’s target range. This view was emboldened thanks to June’s higher-than-expected inflation data and is best seen in weaker commodity markets and inverted yield curves, while pundits refuse to give the current rally in equities any credit. This doesn't seem right to us, given the reason for inflation was not mainly demand-driven. With the NFP data showing overall labor now back at pre-pandemic levels, although leisure and hospitality are still -7% below, there is still a scenario where labor markets continue to improve and inflation falls. This is even with wage gains, given that real disposable income growth is currently negative, so workers continue to have reduced purchasing power. In our opinion real demand is already falling enough to reduce inflation, something that started in earnest in July, as higher prices and greater uncertainty have changed behavior right at the same time shortages of materials and workers are meaningfully improving.

*Alpine Macro expanded on work done by the SF Fed to bifurcate PCE inflation into supply and demand-driven, with the supply-side overwhelmingly being the driver

*Sorry, it is still transitory, just not one year, more like three, as the pandemic-induced supply-side shock, made worse by with zero-Covid and the war in Ukraine, that have kept shortages and logistical problems going longer than the Fed expected
Inflation has peaked for now. Sure another shock to the global system could come along, but there is simply too much evidence that prices businesses and consumers pay are starting to stabilize, if not outright fall. There are still certain pockets of goods and services (rents, autos, healthcare...) that may continue to see price increases, but momentum shifted to the downside in July. However, prices can be sticky, and there's a lot to say about the structure of certain industries regarding monopolistic behavior as well as consumer informational asymmetries. However, on aggregate, cost pressures are increasingly falling for materials and energy, given what we have seen in commodity markets and heard in business surveys. We also know the price at the pump is down, which highly affects inflation expectations and hence the elasticity of demand for products given the consumer’s mindset. Labor turnover should normalize as job openings fall, reducing wage pressures. All of this should weaken shelter cost increases as more supply becomes available, worker mobility falls, landlords recoup moratorium losses, and general affordability continues to impair demand and cap price increases. All these things are increasingly happening right now.

*The majority of July’s regional Fed business surveys, as well as the nationwide ISM PMIs for both services and manufacturing, showed significant lower price pressures

*There has been a strong correlation between what business report in PMIs and headline CPI, increasing our conviction that inflation will fall faster than many think
In summary, despite what some are saying, the Fed does not want to create a recession to bring demand down and lower inflation. They certainly want to bring inflation back to target and are quickly moving policy to where they believe they can achieve their goals of price stability and maximum employment. As a result, they are walking a line that they believe will achieve their goal but will be eager to normalize policy back to a neutral level as soon as they see inflation meaningfully trending back to target. This is because they continue to believe it is a cost-push inflationary pulse, not a structural change in demand-pull supported by a new wage-spiral regime. As a result of this longer “transitory” inflation pulse, the increase in the aggregate number of jobs back to pre-pandemic levels (and likely further increases) does not mean the neutral policy level must be higher, or even the terminal level for this cycle, despite the current high inflation levels we are at. Given recent debates by team Waller & Bullard and echoed by other Fed officials, the committee still believes they can orchestrate a soft-landing, which coupled with the SEPs tells us there is not a belief that things have structurally changed and hence r* is higher.

*The Fed is well aware of the lag effects of its policy and will increasingly be focused on how lower liquidity and money growth will weigh on financial conditions and real growth in 2023
So, where does this leave us with risk assets and rates? If the economy is still increasing aggregate demand and production capacity, as seen in today's jobs report, then the slack needed to lower demand is certainly not growing, and we are not meaningfully slowing despite what GDP data shows. However, given what's already occurred to demand and improvements in supply, it is unclear how much additional slack is truly needed. That debate becomes more about how fast you want inflation to fall and at what cost to labor. Instead, it is our opinion that by acting quickly and aggressively (after waiting too long), assuming they reach a 3.5% Fed funds level by year-end, coupled with the effects of significant hawkish forward guidance, the Fed has already done enough, and the worst of inflation is over. Further, there will be no lingering higher level of inflation. The relationship between capital and labor has not structurally changed, nor has the deflationary pressures globalization and technology created. We will address these longer-term concepts in future writings but given next week's important inflation data, we wanted to continue to pound the table that IT’S ALL ABOUT INFLATION, and we believe it has peaked and will increasingly fall faster than expected into year-end. This means equities and Treasuries can both trend higher. It will take time for the lower inflation narrative to truly take root, as seen this week in rate markets, and what's likely coming for equities as seasonals become more challenged, expect bouts of volatility, and be mindful of the range/channel.

*Drops in energy costs, especially gasoline, should weigh heavily on headline and cap inflation expectation rises in sentiment surveys
Econ Data:
The U.S. economy added 528K jobs in July, much better than market forecasts of 250K and above an upwardly revised 398K in June. The most significant gains occurred in leisure and hospitality (96K), particularly in food services and drinking places (74K), professional and business services (89K), and health care (70K). Total nonfarm payrolls have increased by 22 million since hitting a trough in April 2020, finally returning to the pre-pandemic level. Private-sector employment is 629K higher, although several sectors have yet to recover. On the other hand, government employment is still -597K lower than its pre-pandemic level. The unemployment rate decreased to 3.5% in July, from 3.6% in the previous period, while analysts expected it to be unchanged. The number of unemployed persons edged down to 5.7 million. Meanwhile, the labor force participation rate, at 62.1%, and the employment-population ratio, at 60%, were little changed over the month. Average hourly earnings rose by 0.5% MoM, following an upwardly revised 0.4% gain in the prior month and above market estimates of a 0.3% increase. Over the past 12 months, average hourly earnings have increased by 5.2%. The average workweek was 34.6 hours for the fifth month in a row, above market forecasts of 34.5 hours.
Why it Matters: Clearly, a much stronger than expected jobs report with not only the headline NFP increasing by 528 thousand jobs, significantly beating expectations, as well as past month revisions higher, but also a more significant increase in wages and a lower unemployment rate, all be it helped by a lower participation rate. Wage growth and increased hours worked mean that disposable income rose in July, given what we expect headline inflation to be. The slight increase in overtime for manufacturing workers supported what was seen in recent business surveys, that capacity constraints still exist as qualified labor shortages persist. If firms are still paying overtime and looking to hire, we are clearly not in any notable downturn yet or anywhere close to a recession despite what official data says. As discussed in the deeper dive, the increased supply of labor and now slowly falling amount of job openings are positive for inflationary pressures despite the tightness of the market, keeping pressure on wages.

*July nonfarm payrolls of 528K vs. expectations for 250K and 398K in the prior month, revised higher from 372K, now has total jobs above pre-pandemic levels

*Gains were largest in Education & Health, Leisure & Hospitality, and Professional & Business Services, but every category had a positive contribution. Leisure & Hospitality still remains close to -7% below its pre-pandemic level

*The Atlanta Fed’s Labor Market Spider Chart shows how strong labor markets are, with only hiring plans, EPOP, and initial claims weaker than February 2020.
The ISM Services PMI increased to 56.7 in July, the highest in 3-months, from 55.3 in June and beating market forecasts of 53.5. Faster rates of expansion were seen for Production (59.9 vs. 56.1 in June) and New Orders (59.9 vs. 55.6). Backlog of Orders (58.3 vs. 60.5) showed a deceleration but still remained historically high. Regarding further measures of demand, New Export Orders and Imports both expanded. Employment (49.1 vs. 47.4) intentions contracted by less, and Price (72.3 vs. 80.1) pressures eased further. On the other hand, Inventories (45 vs. 47.5) fell at a faster pace while Supplier Deliveries (57.8 vs. 61.9) also fell.
Why it Matters: A much stronger than expected result showing that activity and demand improved in July while pricing pressures fell. Firms indicated that they had better inventory sentiment, which led to reduced inventory building. Further, respondent comments noted a greater uncertainty regarding appropriate inventory levels due to increased worries about the potential for a future recession. Still, "availability issues with overland trucking, a restricted labor pool, various material shortages, and inflation continue to be impediments for the services sector,” according to Anthony Nieves, Chair of the Institute for Supply Management. However, 6.3% of respondents saw decreases, and 39.7% saw no change in price pressures, indicating some real improvement in the supply-side driven current inflationary pulse.

*The headline index was pushed higher mainly by improvements in activity and demand-orientated sub-indexes

*The underlying sub-index story was different for services than manufacturing, as seen by the side-by-side above, with better activity and demand recovery for services, while prices notably fell for both

*Selected comments were still overly negative with increased levels of uncertainty and continued supply-side challenges; however, we don’t see all comments
New orders for manufactured goods (factory orders) increased by 2% in June, with May’s reading upwardly revised to 1.8%, well above market forecasts of a 1.1% increase. The increase was mainly due to non-durable goods, with petroleum and coal products (6%) and chemical products (1.1%) contributing the most. Durable goods industries rose at a slower 0.3%, with strong contributions from computers and electronic products (1.4%) and electronic equipment and appliances (1.3%), while transportation equipment stagnated when excluding defensive. Shipments increased by 1.1%, following a 2.1% May increase. Unfilled orders increased by 0.7%, following a 0.3% May increase. The unfilled orders-to-shipments ratio was 6.03, up from 5.98 in May. Inventories rose by 0.4%, following a 1.3% increase. The inventories-to-shipments ratio was 1.45, down from 1.46.
Why it Matters: New Orders, Shipments, Unfilled Orders, and Inventories all rose, with revisions higher for the May prints. However, when adjusted for inflation, total manufacturing new orders have decreased by -5.33% versus one year ago, with durable goods orders driving the majority of this decline (-4%). New Orders for Machinery were flat while Computers & Electronics and Electrical Equipment, Appliances, and Components all rose, with Household Appliances interestingly up 10% on the month. Overall the report was broadly positive with a few pockets of weakness (autos flat and metal production lower).

*Factory orders beat expectations with both durable and non-durables higher, but the data is not inflation adjusted, and there was weakness in several sub-categories
Technicals and Charts:
Four Key Macro House Charts:
Growth/Value Ratio: Growth is lower on the day but higher on the week. Small-Cap Growth is the best performing size/factor on the day.

Chinese Iron Ore Future Price: Iron Ore futures are higher on the day but lower on the week. Steel prices have shown some stabilization on hopes of rising demand as Beijing increasingly focuses on home deliveries of unfinished projects

5yr-30yr Treasury Spread: The curve is flatter on the day and the week as the jobs report increased Fed tightening expectations hurting the front-end the most as expected

EUR/JPY FX Cross: The Euro is higher on the day and on the week. The recent strength in the Yen due to better balance of payment hopes and fewer speculative shorts has taken a breather

Other Charts:

Although sell-side estimates are very dispersed, worth highlighting that Goldman still forecasts the S&P to be at 4300 by year-end, with EPS at $226.

The Q2 earnings season has been remarkably positive towards companies missing their earnings forecasts, with the focus more on forward guidance.

The VVIX, an index measuring the volatility of the VIX itself, has fallen relatively steadily since January and recently hit a three-year low of 80. The last time the VVIX was this low, the VIX was at 12, a level of extreme calm. That hardly matches the mood now. - @jimwillhite

The market continues to exhibit a high level of stock correlation as macro issues dominate investor minds

All though now off highs due to the post-mid-June rally, the number of “cheap” stocks is still historically high based on a forward P/E basis, with that E now being marked lower

The mass exodus and then return coupled with the rent moratorium has made predicting shelter costs very tricky, with Goldman noting that the official CPI OER measure is above where other indicators suggest it should be.

Given the pullback in Bloomberg’s Agriculture and Livestock Index, the CPI Food Consumed at Home should begin to fall meaningfully into year-end.

Despite the strong dollar, U.S. exports have been very strong this year, helped by shortages of food and energy products brought on by the Ukraine invasion. However, expectations are for this to begin to slow as higher prices and the forex bill weigh on demand.
Article by Macro Themes:
Medium-term Themes:
Real Supply-Side Situation:
Slowly: Bottlenecks are declining but still keeping spot rates high – ShippingWatch
The massive bottlenecks on the container market have decreased, but almost a tenth of the global container capacity is still queued up around the world’s ports, keeping spot rates up, according to Sea-Intelligence. Much of this improvement has come from China, as waiting and dwell times are shrinking at China’s major container hubs. Volumes have bounced back after the easing of pandemic controls there. However, things remain challenged, and it is still unclear how long it takes to return to normal.
Why it Matters:
One of the world's biggest shipping and logistics companies, AP Moller-Maersk, said it still doesn't know when the supply chain bottlenecks that are disrupting global freight trade will end. In its second quarter earnings report, the Danish freight giant said continued congestion had increased the uncertainty surrounding the cost of shipping goods. "On the supply side, supplier delivery times remain lengthy, and it is still uncertain when capacity constraints including landside bottlenecks in trucking and warehousing will abate," the report said.

Now This: Taiwan Turmoil Prompts Detours, Delays for Global Shipping – Bloomberg
China’s announcement of military drills around Taiwan as Speaker Nancy Pelosi visits the island is creating ripple effects across global supply chains, prompting detours and delaying energy shipments. Gas suppliers are rerouting or reducing speed on some liquefied natural gas vessels currently en route to North Asia, according to people familiar with the matter. Shipments to Taiwan and Japan this weekend will be affected.
Why it Matters:
Local branches of China’s maritime safety administration have issued multiple warnings for ships to avoid certain territories, citing the military exercises. A notice from the regulator in Fujian, the province along the Taiwan Strait, said ships were banned from sailing into the areas where exercises will be conducted from Thursday to Sunday. Taiwan’s Maritime and Port Bureau warned ships to find alternative routes to access and depart from seven major ports on the island during China’s drills, according to the Apple Daily.

Longer-term Themes:
National Security Assets in a Multipolar World:
Last Resort: China’s $26 Billion Pivot From Infrastructure to Emergency Loans - Bloomberg
China has made nearly $26 billion in short and medium-term loans to Pakistan and Sri Lanka over the past five years as its overseas lending shifts from funding infrastructure toward providing emergency relief.The loans show China is now playing a similar role to the International Monetary Fund, providing financing during balance of payments crises, rather than World Bank-style concessionary project financing to which BRI lending has generally been compared. About 60% of China’s overseas lending is to countries that are now in debt distress, according to researchers at the World Bank.
Why it Matters:
Data showing the shift in China’s $900 billion Belt and Road Initiative to loans aimed at easing foreign currency shortages since 2018 was compiled by AidData, a research lab at William and Mary, a university in the U.S. China has “pivoted in a significant way away from project lending and toward balance of payment lending, doing emergency rescue lending,” said Brad Parks, AidData’s executive director.

Electrification and Digitalization Policy:
Incidents?: Reports of government ransomware attacks are down, but looks are deceiving - StateScoop
A report earlier this month from the Ransomware Task Force, a group of roughly 60 tech-industry and public-sector cybersecurity experts, found that while organizations worldwide continue to suffer attacks, the clip of incidents affecting local government and health organizations in the United States looks to have slowed. The task force, citing data compiled by Recorded Future intelligence analyst Allan Liska, said there had been 64 documented attacks on local governments, schools, and hospitals so far in 2022, compared with about 150 over the same period a year prior. Yet incidents continue to be financially costly and operationally devastating.
Why it Matters:
But why the overall ransomware tally has fallen off remains an open question. “There may be fewer attacks,” Liska told StateScoop. “I have trouble believing that because every incident response person I know is still booked fully, mostly with ransomware.”Cataloging ransomware incidents continue to be meticulous work, depending on a combination of professional contacts, monitoring ransomware gangs’ extortion sites, and scanning headlines from local news sources, which are often the first to report if a school, hospital, or government office is experiencing a cyberattack. The bottom line, it is unclear just how much ransomware attacks have fallen and how correlated it is to Russian hackers occupied elsewhere.

Mishandle: Privacy bill strips FCC oversight of telecom data abuse, worrying consumer advocates - CyberScoop
Under the American Data Privacy Protection Act, the Federal Communications Commission would no longer have the authority to enforce its privacy regulations for common carriers such as AT&T and Verizon that handle the vast majority of Americans’ phone calls and text conversations. Stripping these authorities from an agency with years of experience overseeing the massive telecom industry, which has a long history of privacy lapses, could pose an immediate threat to consumer data protection, experts warn.
Why it Matters:
For decades, the FCC has overseen what personal information telecoms can collect and share with third parties. That includes what information common carriers can share with law enforcement without a warrant. The ADDPA does not offer consumers any protections from voluntary information sharing with law enforcement, a problem that has become ubiquitous in the tech industry. Under the ADPPA, privacy enforcement for common carriers would go to the Federal Trade Commission. However, critics argue that the bill does little to set up the FTC to match the FCC’s enforcement powers and agency expertise.

Commodity Super Cycle Green.0:
Sustainable: Singapore and Rotterdam move to establish world’s longest green corridor – Splash247
The Maritime & Port Authority of Singapore and the Port of Rotterdam inked a memorandum of understanding to establish the green and digital corridor on the sidelines of the biennial World Cities Summit in Singapore. Being two of the world’s largest bunkering hubs, the two ports agreed to bring together a broad coalition of shippers, fuel suppliers, and other companies to collectively work on potential solutions for alternative fuels such as synthetic methane, hydrogen, and hydrogen-based fuels, including ammonia and methanol. In addition, the aim is to also optimize maritime efficiency, safety, and the transparent flow of goods by creating a digital trade lane where relevant data, electronic documentation, and standards are shared, the partners said.
Why it Matters:
Under the deal, the two partners will look to bring together stakeholders across the supply chain to realize the first sustainable vessels sailing on the route by 2027. “This will enable the green and digital corridor project to raise investor confidence, attract green financing, and kickstart joint bunkering pilots and trials for digitalization and the use of low- and zero carbon fuels along the route,” a joint statement by MPA and Port of Rotterdam said.

ESG Monetary and Fiscal Policy Expansion:
Network: Biden Has a $5 Billion Plan to Eliminate America's EV Charging Deserts - Bloomberg
Eager to lure Americans from their gas-burning cars, Biden’s administration is planning a nationwide network of 500,000 charging stations linking urban and rural areas coast to coast. Last year’s infrastructure law set aside $5 billion to build it. Along interstate highways and other major roads, the feds want a station every 50 miles, with at least four charging ports apiece. States, which will play a major role in deciding where those chargers go, face an Aug. 1 deadline to tell the federal government how they would like to spend the money. Each state’s share of the funding, slated for distribution starting this fall, will be equal to their portion of annual federal highway spending.
Why it Matters:
It’s hard to overstate how much Biden’s climate fight relies on EVs. The Supreme Court has limited the federal government’s ability to regulate greenhouse gases, and tax breaks to spur low-carbon technologies have been stalled in the Senate. Key senators said this week that they might finally reach a deal on them, but passage by a deeply divided Congress is not guaranteed. The shift from internal combustion engines to electric cars is one of the biggest carbon-cutting options open to the president. But it requires convincing millions of drivers to take the plunge, something they won’t do if they’re worried about running out of power on the road. It’s a chicken-and-egg conundrum that has largely left rural America out of the electric-vehicle revolution.

Appendix:
Current Macro Theme Summaries:

VIEWS EXPRESSED IN "CONTENT" ON THIS WEBSITE OR POSTED IN SOCIAL MEDIA AND OTHER PLATFORMS (COLLECTIVELY, "CONTENT DISTRIBUTION OUTLETS") ARE MY OWN. THE POSTS ARE NOT DIRECTED TO ANY INVESTORS OR POTENTIAL INVESTORS, AND DO NOT CONSTITUTE AN OFFER TO SELL -- OR A SOLICITATION OF AN OFFER TO BUY -- ANY SECURITIES, AND MAY NOT BE USED OR RELIED UPON IN EVALUATING THE MERITS OF ANY INVESTMENT.
THE CONTENT SHOULD NOT BE CONSTRUED AS OR RELIED UPON IN ANY MANNER AS INVESTMENT, LEGAL, TAX, OR OTHER ADVICE. YOU SHOULD CONSULT YOUR OWN ADVISERS AS TO LEGAL, BUSINESS, TAX, AND OTHER RELATED MATTERS CONCERNING ANY INVESTMENT. ANY PROJECTIONS, ESTIMATES, FORECASTS, TARGETS, PROSPECTS AND/OR OPINIONS EXPRESSED IN THESE MATERIALS ARE SUBJECT TO CHANGE WITHOUT NOTICE AND MAY DIFFER OR BE CONTRARY TO OPINIONS EXPRESSED BY OTHERS. ANY CHARTS PROVIDED HERE ARE FOR INFORMATIONAL PURPOSES ONLY, AND SHOULD NOT BE RELIED UPON WHEN MAKING ANY INVESTMENT DECISION. CERTAIN INFORMATION CONTAINED IN HERE HAS BEEN OBTAINED FROM THIRD-PARTY SOURCES. WHILE TAKEN FROM SOURCES BELIEVED TO BE RELIABLE, I HAVE NOT INDEPENDENTLY VERIFIED SUCH INFORMATION AND MAKES NO REPRESENTATIONS ABOUT THE ENDURING ACCURACY OF THE INFORMATION