


MIDDAY MACRO - 8/23/2021
Daily Color on Markets, Policy, and Geo-Politics

MIDDAY MACRO - DAILY COLOR – 8/23/2021
OVERNIGHT/MORNING RECAP & MARKET ANALYSIS
Narratives/Price Action:
Equities are higher, as the reflationary rally/bounce, which started at the end of last week, continuing today, although tech/growth caught up post-NY-open
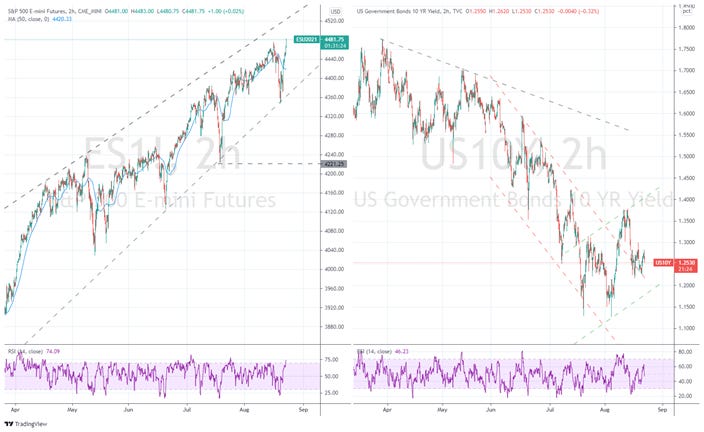
Treasuries are flat, with the reflationary tone not being confirmed by any curve steepening as Treasuries await Jackson Hole later this week
WTI is notably higher, with an overnight rally starting immediately at the Asian open and continuing currently, increasing +5% on the session
Analysis:
Equities are reflecting a more “reflationary” themed rally today (which continued from Friday), but the more defensive sectors have caught up post-NY-open, while Treasuries have been notably quiet, drifting higher overnight as weaker European PMIs came out.
The Russell is outperforming the Nasdaq and S&P with Momentum, Growth, and Small-Cap factors, and Energy, Communications, and Industrials sectors are all outperforming.
S&P optionality strike levels have zero gamma level is at 4414 while the call wall is 4500; technical levels have support at 4432 and resistance is 4493.
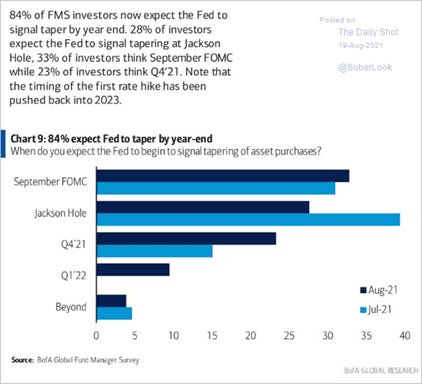
Treasuries are slightly higher thanks to weaker PMI data globally and domestically, but price action is likely to stay muted until Powell delivers further clarity on tapering intentions at Jackson Hole later this week.
Today’s continuation of last week's rally has yet to confirm if it’s the beginning of a longer-lasting reflationary trade into year-end (something we believe will occur), or we are simply seeing a short-term tactical bounce after hitting oversold conditions in small-caps, energy, and materials sectors last week.
On the positive side, demand in the economy is holding up, as seen in today’s housing and PMI data releases; however, supply is still a problem, and price increases due to shortages of materials and labor have yet to subside meaningfully. Will the mismatch between demand and supply be rectified before the holiday season, or will growth continue to be capped?

Delta’s spread looks to be slowing; however, the negative psychological and activity impacts are still increasing while school openings (and the potential for increases in MIS-C cases) could create conditions for new lockdowns/closures. Further, initial vaccination efficiencies are weakening, and boosters are still months away. Will we ever be able to sit on the case curve meaningfully?

Uncertainty is increasing regarding the passage of the Senate-approved hard-infrastructure bill as House progressives continue to insist its passage be tied to their more social/green orientated $3.5 trillion continuing resolution bill, resulting in a lack of clarity on not only further fiscal stimulus but also future tax policy.
Not to be outdone, uncertainty regarding monetary policy is still weighing on sentiment, although at this point, the exact timing/duration of tapering is really secondary to other risks. However, the continuation of LSAPs methodically supports excess liquidity and financial conditions, emboldening risk-taking behavior.
Finally, what is going on in China? We need further “data” to confirm the severity of the slow-down that seems to be occurring and clarity from Beijing on their intentions regarding micro and macro policy (which we will likely never get). It is hard to imagine a sustained global recovery (specifically in Europe and Asia) without a more positive growth pulse out of China.

Putting it all together, we are becoming more optimistic that we will see a push higher in reflationary-themed trades (value, small-caps, energy, materials, and consumer discretionary) into year-end but remain cautious given the uncertainties we identified above. Bottom-line, be tactical and nimble (BTD but don’t chase rallies) as the tide slowly rises with continued periods of choppiness (volatility).
Econ Data:
The IHS Markit Flash PMIs for both services and manufacturing showed a private sector slowing from continued supply-side and Delta-related disruptions. The U.S. Composite PMI Output Index posted 55.4 in August, down sharply from 59.9 in July. The pace of expansion in business activity was the slowest seen in 2021 so far. Growth in new demand for services cooled while manufacturers reported a further increase in new order inflows. However, the rise in outstanding business was only slightly below July’s record high but coincided with only a marginal upturn in employment. Staffing numbers rose at the slowest rate since July 2020, often linked to difficulties finding staff. The rate of input price inflation accelerated to the second-fastest on record (since October 2009), with both manufacturing and service sectors registering a quicker rise in costs. At the same time, the rate of selling price inflation ticked higher as firms sought to pass higher input prices on to clients.
Why it Matters: Despite concerns regarding the spread of the virus and the longevity of supply chain disruptions, U.S. companies remained upbeat regarding the outlook for output over the coming year. The degree of confidence ticked up from that seen in July. Service firms reported one of the fastest paces of increasing input costs but raised their selling prices at a sharper rate, defending profit margins. Further, even with increases in outstanding business, service firms only expanded their business marginally, with the slowest rate of job creation since February and a high level of turnover. This opens the potential for more robust job gains later in the year. Turning to manufacturing, although there was a slowing in operating conditions, new orders were still historically high. As expected, material and labor shortages continued to weigh on output, driving backlogs of work to the highest level in the 14-year history of the data series. These disruptions continued to increase delivery times to a new high while workforce expansion slowed. Stepping back, not a real surprise that Markit PMIs missed expectations. There is still no improvement in supply-side disruptions and labor shortages, and as a result, production is capped even as demand continues to be robust.


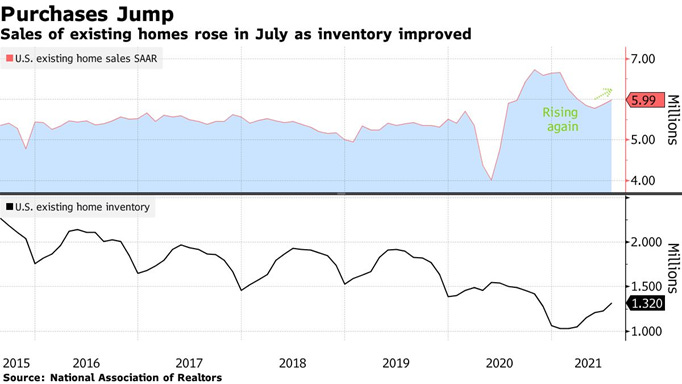
Existing-Home sales rose 2% in July, with three of the four major U.S. regions recorded modest month-over-month gains, and the fourth remained level. The inventory of unsold homes increased 7.3% to 1.32 million, equivalent to 2.6 months of the monthly sales pace. The median existing-home sales price rose at a year-over-year pace of 17.8%. Properties typically remained on the market for 17 days in July, unchanged from June and down from 22 days in July 2020. Eighty-nine percent of homes sold in July 2021 were on the market for less than a month. First-time buyers accounted for 30% of sales in July, down from 31% in June and down from 34% in July 2020. All-cash sales accounted for 23% of transactions in July, even with June, and up from 16% in July 2020.
Why it Matters: This was a more positive Existing-Home sales report. Activity continues to be strong even though Delta worries are increasing while inventories are slowly rising. "We see inventory beginning to tick up, which will lessen the intensity of multiple offers," said Lawrence Yun, NAR's chief economist. "Much of the home sales growth is still occurring in the upper-end markets, while the mid- to lower-tier areas aren't seeing as much growth because there are still too few starter homes available."
TECHNICALS / CHARTS
FOUR KEY MACRO HOUSE CHARTS:
Growth/Value Ratio: Growth is outperforming even as the reflationary tone continues to grow thanks to a post-NY-open rally in the Nasdaq

Chinese Iron Ore Future Price: Iron Ore futures are lower despite the more risk-on tone and price appreciation in other basic materials as Beijing’s erk continues to weigh on demand outlook

5yr-30yr Treasury Spread: The curve is little changed as the spread sits at the bottom of its summer range

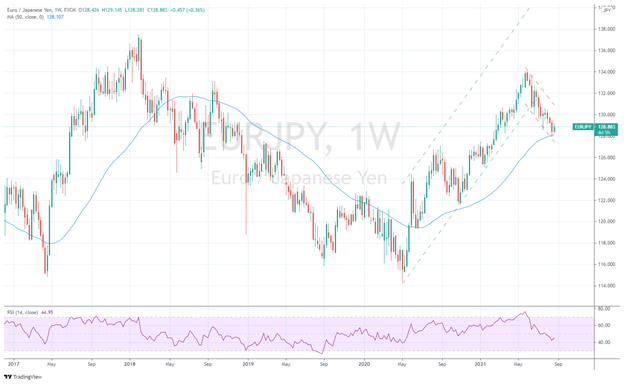
EUR/JPY FX Cross: Euro has outperformed over the last few days as a more risk-on tone has taken root
HOUSE THEMES / ARTICLES
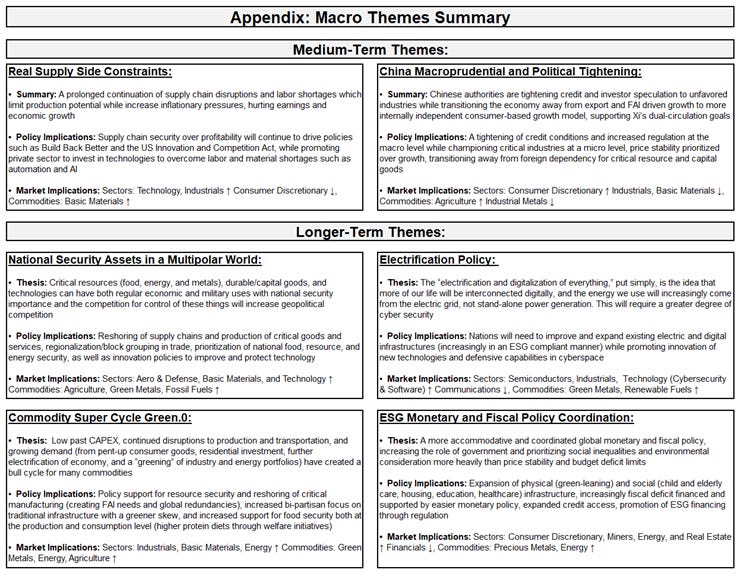
MEDIUM-TERM THEMES:
Real Supply Side Constraints:
Reduction Crisis: Chip Crisis Threatens to Cut Auto Output by 7.1 Million Cars - Bloomberg
The lack of chips won’t stabilize until the second quarter of next year, with recovery coming in the second half, IHS said in a report Thursday. Low vaccination rates and rising infection rates in Southeast Asia are prompting shutdowns of plants assembling all types of semiconductors. Toyota, which had stockpiled chips and previously had experienced less disruption, cited the Asian outbreak of the delta variant of the virus for its September production cuts.
Why it Matters:
New variant creates old problems. How long will this cycle play out as the elusive herd immunity is slow to be reached while the virus mutates every year, increasing its ability to spread? Bottom line, this will continue to force firms to prioritize supply chain security or face lost sales, an unacceptable outcome in our capitalistic world. We have hope that the disruption to chip production in Asia will recover faster as manufacturers adapt and “secure” key personnel moving forward.

Or Inventory Build?: Global chipmakers build record inventories in push to end shortage – NikkeiAsia
Total inventory at the world's nine leading chipmakers hit a record high of $64.7 billion as of the end of June, as companies quickly move to ramp up production to alleviate a protracted shortage that has disrupted supply chains in the auto industry and beyond.
Which is it? Is there a shortage or glut? It depends on what type of chips you need and how strong your relationship with the producer is. As the “shortage” continues for certain sectors, it is important to be aware that it is improving elsewhere.

China Macroprudential and Political Tightening:
Less Special: China’s Slow Bond Sales Will Delay Expected Infrastructure Boost – Caixin
Cities and provinces will sell about 1.8 trillion yuan ($277 billion) in local government special bonds by the end of August, data compiled by Bloomberg show, amounting to 48% of their quota for the year. On top of slower bond sales, local government revenues are taking a hit from restrictions on land sales. They are also being pressured to cut debt. That means there’s less money to spend on infrastructure in what is usually the peak season before it becomes too cold for outdoor construction.
Why it Matters:
While “special” bond issuance is weaker than previous years, regular local government bond issuance has accelerated recently, rising by 30% from total issuance in July by mid-August. This is adding confusion to just how quickly and strong any rebound in the ever-important credit impulse will be. We continue to be patient here, waiting for further clarity given the general overload of micro and macro policy releases.

LONGER-TERM THEMES:
Electrification Policy:
Crypto Adoption: This map shows where cryptocurrency is taking off around the world – CNBC
Global crypto adoption has taken off in the last year, up 881%, with Vietnam, India, and Pakistan firmly in the lead, according to new data from Chainalysis. Most of the top 20 countries are emerging economies, including Togo, Colombia, and Afghanistan. Meanwhile, the United States slipped from sixth to eighth place, and China, which cracked down on crypto this spring, dropped from fourth to 13th.
Why it Matters:
Chainalysis said the purpose of the index is to capture crypto adoption by “ordinary people” and to “focus on use cases related to transactions and individual saving, rather than trading and speculation.” The report also says many residents of these countries turn to cryptocurrency to preserve their savings in the face of currency devaluation, as well as to send and receive remittances and carry out business transactions.

Commodity Super Cycle Green.0:
More Tree Stuff: China to step up tree-planting campaign to help reach net-zero - Reuters
China will plant 36,000 square kilometers of new forest a year (more than the total area of Belgium) from this year to 2025 as it bids to combat climate change and better protect natural habitats, a senior forestry official said on Friday. "By 2035, the quality and stability of national forest, grassland, wetland, and desert ecosystems will have been comprehensively upgraded," Li Chunliang, vice-chairman of the State Forestry and Grasslands Commission, told a press briefing.
Why it Matters:
China aims to raise its overall forest coverage rate to 24.1% by the end of 2025 from 23.04% at the end of last year, according to its forest and grassland five-year plan published this week. This goal will not only improve air quality and offset carbon emissions but also help stop farmland degradation and promote aquifer reclamation. We expect to see more national “forest” plans elsewhere as living trees become increasingly seen as a national asset.

ESG Monetary and Fiscal Policy Expansion:
Changing the Pipes: Fed to Create Payments System to Speed Money Transfers - WSJ
The Federal Reserve plans to develop a faster payments system for banks to exchange money, providing a public option to another real-time network built by big banks. The new system would allow bill payments, paychecks, and other common consumer or business transfers to be available instantly and round-the-clock, a change from the government’s current system that is closed on weekends and can at times take days to settle a transaction.
Why it Matters:
The Fed said it in part decided to move ahead with the project because it predicted the Clearing House system would remain the only faster-payments provider if it didn’t enter the fray. Thousands of community banks still don’t have access to a real-time settlement system for small consumer and business transfers. The worry is big banks (that effectively own the Clearing House system) and tech firms leading innovation here will be able to stifle competition/availability, hurting Main Street. It also lays the foundation for welfare payments to circumvent the traditional banking system in the future as individuals/firms can hold accounts directly with the Fed or government-sponsored bank.

VIEWS EXPRESSED IN "CONTENT" ON THIS WEBSITE OR POSTED IN SOCIAL MEDIA AND OTHER PLATFORMS (COLLECTIVELY, "CONTENT DISTRIBUTION OUTLETS") ARE MY OWN. THE POSTS ARE NOT DIRECTED TO ANY INVESTORS OR POTENTIAL INVESTORS, AND DO NOT CONSTITUTE AN OFFER TO SELL -- OR A SOLICITATION OF AN OFFER TO BUY -- ANY SECURITIES, AND MAY NOT BE USED OR RELIED UPON IN EVALUATING THE MERITS OF ANY INVESTMENT.
THE CONTENT SHOULD NOT BE CONSTRUED AS OR RELIED UPON IN ANY MANNER AS INVESTMENT, LEGAL, TAX, OR OTHER ADVICE. YOU SHOULD CONSULT YOUR OWN ADVISERS AS TO LEGAL, BUSINESS, TAX, AND OTHER RELATED MATTERS CONCERNING ANY INVESTMENT. ANY PROJECTIONS, ESTIMATES, FORECASTS, TARGETS, PROSPECTS AND/OR OPINIONS EXPRESSED IN THESE MATERIALS ARE SUBJECT TO CHANGE WITHOUT NOTICE AND MAY DIFFER OR BE CONTRARY TO OPINIONS EXPRESSED BY OTHERS. ANY CHARTS PROVIDED HERE ARE FOR INFORMATIONAL PURPOSES ONLY, AND SHOULD NOT BE RELIED UPON WHEN MAKING ANY INVESTMENT DECISION. CERTAIN INFORMATION CONTAINED IN HERE HAS BEEN OBTAINED FROM THIRD-PARTY SOURCES. WHILE TAKEN FROM SOURCES BELIEVED TO BE RELIABLE, I HAVE NOT INDEPENDENTLY VERIFIED SUCH INFORMATION AND MAKES NO REPRESENTATIONS ABOUT THE ENDURING ACCURACY OF THE INFORMATION OR ITS APPROPRIATENESS FOR A GIVEN SITUATION.