Midday Macro – 8/2/2022
Market Recap:
Price Action and Headlines:
Equities are mixed, with small-caps outperforming as today’s JOLTs data showed a slight loosening in labor markets while the “good-enough” rally continues to consolidate despite large jumps in Treasury yields today
Treasuries are lower, with large moves higher in yields leading to a flatter curve as numerous Fed officials came out and hawkishly pushed back on any dovish interpretations of the July FOMC meeting/presser
WTI is higher, but falling off session highs, crossing below its 200 DMA yesterday as SPR releases continue to support inventories, with traders now awaiting OPEC+ meeting results but not expecting much to change there
Narrative Analysis:
Today’s hawkish Fed commentary has failed to material shake equity markets despite higher Treasury yields. This makes us believe the “Good-Enough” rally remains intact after strong gains last week due to inline earning results from bellwethers. Thanks to last week’s performance, July’s overall positive results reversed June's losses despite significant downgrades in the earnings growth outlook. Recent economic data continued to paint a picture of falling demand but still some economic momentum, with yesterday’s ISM manufacturing PMI remaining in expansionary territory. Today’s JOLTs data saw openings over the last three months fall by one million, reducing the tightness of labor markets. However, when combined with other data, Friday’s jobs report should still paint a positive picture. Commodity markets continue to be somewhat rangebound, with supplies not materially worsening while demand from China is still tepid. WTI looks to be establishing a range between $90 and $100 despite growing exports, with the price at the pump continuing to fall as refineries are increasingly improving inventory levels. The agriculture complex has also been somewhat rangebound after falling in June as some wheat exports are starting to leave Ukraine while weather/growing conditions haven’t overly deteriorated. Industrial metals are mixed, with copper rebounding, but given uncertainty regarding China’s property sector, the outlook is still highly questionable. Finally, the dollar is higher today, helped by hawkish Fed speakers and higher yields. However, the $DXY is off recent highs (of +109) and now slightly above 106.
The Russell is outperforming the S&P and Nasdaq with Growth, Value, and Momentum factors, and Utilities, Health Care, and Communication sectors are outperforming on the day. More cyclical sectors and factors (Consumer Discretionary/Technology and Growth) have outperformed over the last week.
@KoyfinCharts
S&P optionality strike levels have the Zero-Gamma Level at 4098 while the Call Wall is 4200. Positive gamma is building as long as the S&P is above 4,000, driving down implied volatility. This trend should continue into August’s monthly options expiration with the move higher in the Call Wall, confirming some call buying was occurring. However, the S&P has held the 4100 level on multiple tests. During that time, we saw the ZeroGamma level shift up to 4100, while the Vol Trigger held down near 4000. This suggests that the gamma position from 4100-4000 is pretty light, and it would not take much selling to spark a retest of 4000.
@spotgamma
S&P technical levels have support at 4100-05, then 4080, and resistance at 4135, then 4155. The S&P had three very clean, easy-to-trade, >1% upside trend days last week, and periods of trend typically do follow periods of complexity and consolidation. Currently, we are building a 3-day base/consolidation between 4080-4135 and cooling from an overbought condition, indicating an eventual breakout will be significant. Things remain bullish above 4105 tactically, and as long as the S&P is above the broad 4010-3985 support area leaves the current rally intact.
@AdamMancini4
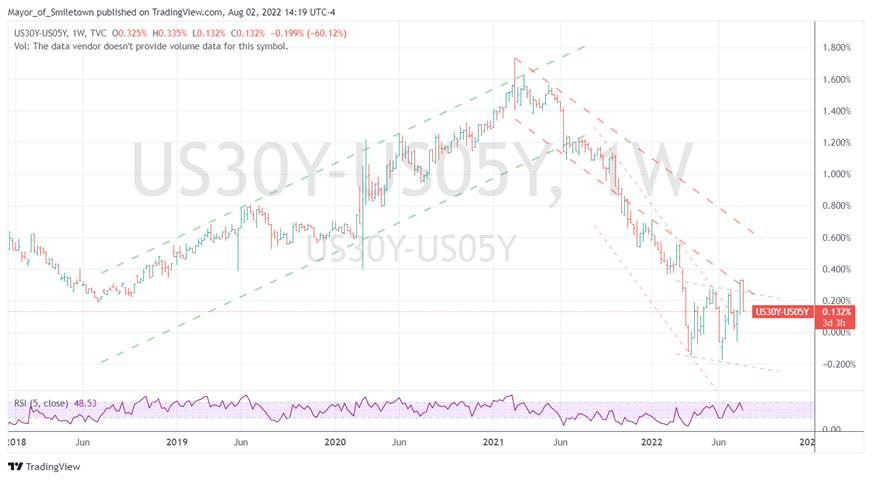
Treasuries are lower, with the 10yr yield at 2.74%, higher by around 16.4 bps on the session, while the 5s30s curve is flatter by 14.5 bps, moving to 13.5 bps
Deeper Dive:
Markets continue to climb the wall of worries, currently taking some comfort in the fact that Speaker Pelosi's safely arrived in Taipei and allowing what most still consider a bear-market rally to continue. Recent economic data also marginally showed a further moderation in inflationary pressures and a reduction in labor market tightness. As a result, hopes for the Fed to pivot policy to a more neutral level sooner than later live on, with Powell and company indicating they were stepping back from “forward guidance” and becoming more reactive to a broader set of data. When coupled with the current earnings season results being inline and forward guidance being (potentially) overly pessimistic, investors are slowly becoming more neutral on risk assets despite valuations and risk premium still not reaching compelling levels.
Our house view remains that the economy is slowing quickly, further reducing demand-pull inflation pressures. At the same time, supply-side impairments continue to improve, slowing the pandemic-driven cost-push inflationary pressures primarily responsible for our current situation. When coupled with expectations for weaker labor demand into year-end, reducing wage-spiral fears, it is possible the Fed’s current hiking cycle can end by the December meeting, especially with QT still going strong.
Although markets seem ahead of the Fed's intentions/timing to ease back to neutral after going “moderately restrictive” with rate cuts starting next summer, traders will inevitably continue to focus on this going into 2023 if inflation and growth increasingly trend lower. Of course, Fed officials will not be able to acknowledge this anytime soon and continue to hawkishly jawbone markets as seen today, attempting to keep financial conditions tight.
The bottom line is this current rally does not need to reverse meaningfully, given the degree of negativeness still priced in and the lack of exposure investors have. Instead, equities could be rangebound with a more positive tilt into year-end as inflation falls fast enough to allow Fed policy to turn more neutral in the second half of 2023 before any hard landing occurs. At the same time, business and consumer sentiment should improve (given the negative effects inflation caused should reverse), helping maintain some momentum in the hard data and eventually a return to a more structurally appropriate level of growth into 2024.
The July rebound in equities was historic. Bloomberg reported that when the S&P dropped by -7.5% in one calendar month and regained at least that much in the following month, something that has happened only six times in history (October 1974, October 2002, March 2009, January 2019, and April 2020) the S&P 500’s average return 12 months after was 30%. With markets more positively toned, reduced levels of volatility, and a slightly weaker dollar, financial conditions are easing, something the Fed does not yet want to see. However, and interestingly, Powell acknowledged this in the July press conference, attributing the loosening in the FCI to declining inflation expectations, something he saw as a positive. Unfortunately, market-derived inflation expectations, as seen in the Fed’s favorite 5yr5yr forward breakeven rates, have risen in recent days, potentially pricing in a more dovish Fed moving forward.
*The June-drop/July-recovery was notable, and despite no capitulation to kick it off, the strong recovery in July has historically signaled more gains are coming
The S&P (excluding the energy sector) and Nasdaq profit forecasts for every quarter out to the second quarter of 2023 have been cut, with particularly sharp cuts occurring after last week's major market cap bellwethers reported. This has the S&P 2023 earnings growth forecast close to zero. FactSet points out in their most recent Earnings Insight that “…the decline in the bottom-up EPS estimate recorded during the first month of the third quarter was larger than the 5- year average, 10-year average, 15-year average, and 20-year average. The third quarter also marked the largest decrease in the bottom-up EPS estimate during the first month of a quarter since Q2 2020 (-29.0%). The bottom line is future earning expectations are becoming more realistic and now potentially too pessimistic, allowing investors to have a better risk/reward assessment despite valuations and equity risk premium still not being compelling. Further, it allows more significant levels of capital allocation back into beat-down sectors, which is why the communication, technology, and consumer discretionaries sectors have outperformed. In our opinion, it also reduces the odds that a significant/violent capitulation (new lows and a spike in VIX) will occur.
*We are encouraged to see earnings expectations dropping while stock prices rise as the realities of what's coming become more clear to investors
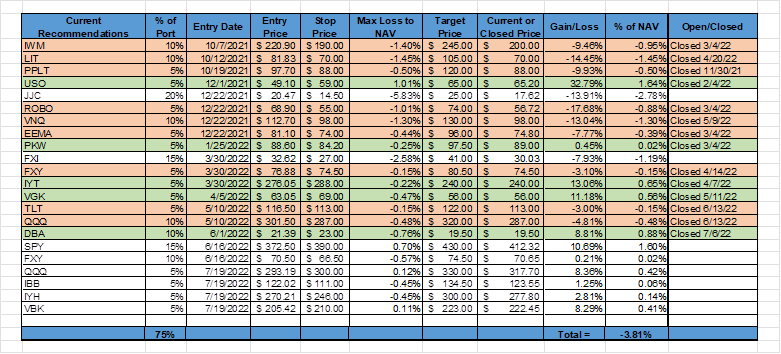
Finally, worth highlighting our mock portfolio’s performance which has benefited from the longs we added in mid-July and some recovery in the price of copper, leaving returns at -3.8% since inception. However, the deteriorating economic activity in China in July and renewed saber-rattling have hurt our Chinese equity long. Further, we are now flat on our Yen long as momentum has become more positive there. We are moving our stops higher for our $SPY, $QQQ, and $VBK longs, locking in a profit there.
*So far, our call to increase long exposure in July is paying off, but the market has come a long way in a short period, with a retracement likely warranted given the risks that remain
In summary, we continue to want to be long equities. Still, we are increasingly wary there will be a pullback into fall. Fed officials will remain hawkish, jawboning tighter financial conditions. Earning expectations could undoubtedly fall further if the hard economic data decelerates in Q3 while margin pressures don’t materially improve, something we expect given what the soft data is forecasting. However, our expectations are that July’s inflation data will show a significant drop (in the headline reading and further stabilization in core) while Friday’s job report remains positive, although weaker than first-half monthly averages. This leads us to believe that the economy will retain a low level of momentum over Q3, and business and consumer sentiment will begin to improve as inflation falls, improving the outlook for Q4 and H1 2023. As a result, allocation into equities will increase (given the level of capital on the sideline) as the overly bearish sentiment by investors improves despite the continual negative macro backdrop—something we continue to call the “Good-Enough” market rally.
Econ Data:
The number of job openings fell by 605K from a month earlier to 10.7 million in June, the lowest in nine months and below market expectations of 11 million. The largest decreases in job openings were in retail trade (-343K), wholesale trade (-82K), and state and local government education (-62K). Around 4.2 million Americans quit their jobs in May, little changed from the prior month, with the so-called quits rate unchanged at 2.8%. Layoffs and discharges actually fell in June to 1.33 million from 1.42 million, and the layoff rate has held steady at the very low level of 0.9% since January.
Why it Matters: The decline in job openings still left 1.8 available job openings per unemployed job seeker, indicating that labor markets remain very tight. However, as we have previously pointed out, the elasticity of demand from firms for these openings will likely weaken if demand continues to slow, which seems to be the modal outcome. We expect the quits rate to fall and layoffs to increase. This will reduce pressure on wages and allow the Fed to have greater confidence that a wage-spiral inflationary regime is not building and there is greater slack in the economy, cooling demand-pull inflationary pressures.
*The decline in job openings still left 1.8 available job openings per unemployed job seeker, and the quits rate remains historically high, indicating labor markets remain very tight
The ISM Manufacturing PMI edged lower to 52.8 in July from 53 in June, beating market forecasts of 52. New Orders (48 vs. 49.2 in June) and Employment (49.9 vs. 47.3) declined further into contractionary territory. Production (53.5 vs. 54.9) and Supplier Deliveries (55.2 vs. 57.3) slowed. Inventories (57.3 vs. 56) increased, and price pressures (60 vs. 78.5) softened. Meanwhile, sentiment remained generally optimistic despite growing concerns, with six positive growth comments for every cautious comment.
Why it Matters: With new orders and employment becoming more contractionary, this report is not as positive as the headline number suggests. However, “according to Business Survey Committee respondents’ comments, companies continue to hire at strong rates, with few indications of layoffs, hiring freezes, or headcount reduction through attrition. Panelists reported higher rates of quits, reversing June’s positive trend.” The drop in prices was notable but mainly reflected the drop in energy costs. As seen in other business surveys, weaker delivery times also indicate some improvement in logistical constraints. Interestingly the import/export channel and inventory builds all strengthened while the backlog of orders still remained positive, indicating that despite a contraction in new orders, demand is not falling off a cliff. This was also seen in respondent comments that showed increasing concerns about excess inventory moving forward, but “sentiment remained optimistic regarding demand, with six positive growth comments for every cautious comment.” In summary, the supply-side impairments continued to improve, and inflationary pressures were reduced with some demand destruction occurring but generally a still neutral manufacturing climate.
*A slight stabilization in July’s ISM Manufacturing PMI readings after the slowdown in the first half of the year
*Demand-orientated sub-indexes were mixed while supply-side indicators weakened, leaving the July headline index little changed since June
*Selected respondent comments seemed more negative but “but panelists again indicated month-over-month improvement in hiring ability in July. Challenges with turnover (quits and retirements) and resulting backfilling continue to plague efforts to adequately staff organizations.”
Construction spending fell by -1.1% to a seasonally adjusted annual rate of $1.76 trillion in June, compared to the revised 0.1% increase in May and market expectations of a 0.1% gain. Spending on private construction contracted by -1.3%, dragged by residential (-1.6%), power (-1.8%), and commercial (-0.6%) construction. At the same time, public construction shrank by -0.5%, pressured by highways and streets (-2.7%), transportation (-1%), and education (-0.7%) construction.
Why it Matters: The June report showed the largest decrease in construction spending since February of 2021. The decrease in residential spending was in line with what was seen in other housing data and is likely to be the trend moving forward as cost considerations slow starts while inventory levels normalize. On the public side, there was mixed progress in infrastructure-related areas, with Water Supply and Sewage projects increasing while spending on Highways and Streets fell.
*Total construction is up 8.3% YoY but is now likely going to trend lower, primarily driven by weakness in residential activity, although we still believe public construction spending could be more neutral
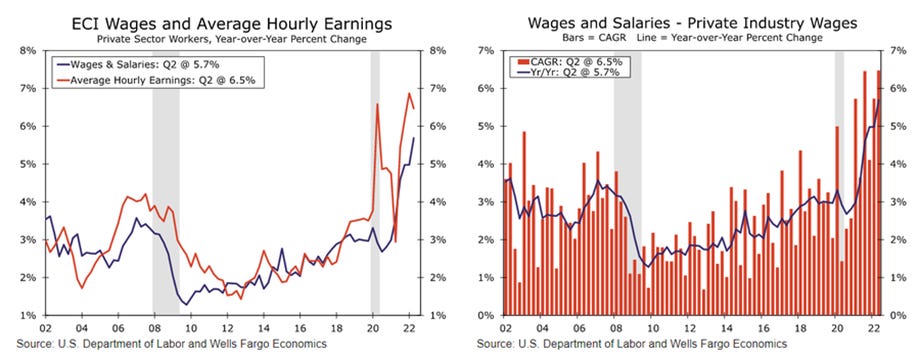
Compensation costs, measured by the Employment Cost Index, rose 1.3% quarter-over-quarter in the three months ending June, slightly slower than a record growth of 1.4% increase in the previous period and marginally faster than market expectations of 1.2%. The annual increase is now 5.1%. Wages and salaries increased 1.4% (vs. 1.2% in Q1 and 5.3% YoY), and benefits rose by 1.2% (vs. 1.8% in Q1 and 4.8% YoY). Compared with a year earlier, real labor costs fell -2.4 percent in the second quarter, following a -3.7 percent contraction in the quarter ending March.
Why it Matters: There are two main takeaways; real wage increases improved slightly in Q2, rising by 1.3% (-2.4% vs. -3.7% in Q1) but remain negative. Second, Fed Chair Powell, who has often referenced the ECI as a key measure of labor market tightness, won’t be swayed that wage-spiral risks are diminished from this report. The good news is this data is very backward-looking, and wage increases, in theory, should be peaking. Friday’s July wage data should show some moderation in pressures. We believe labor market “tightness” has been diminished due to increased initial claims and announced layoffs, as well as business survey hiring intentions weakening.
*The Employment Cost Index rose 1.3% in Q2, slightly lower than the 1.4% rise in Q1.
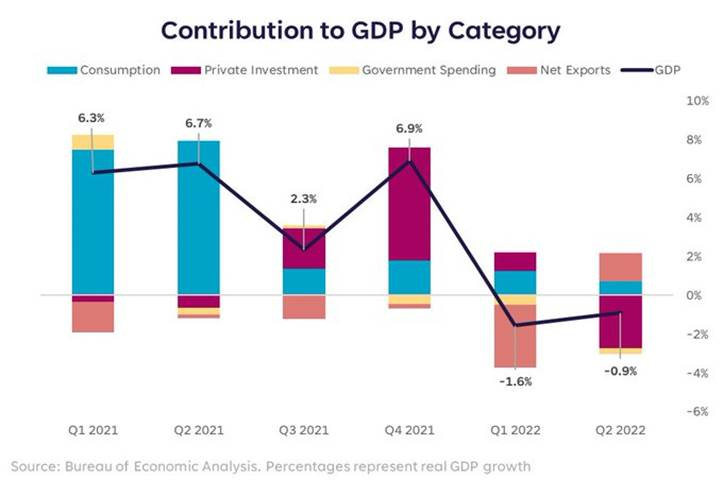
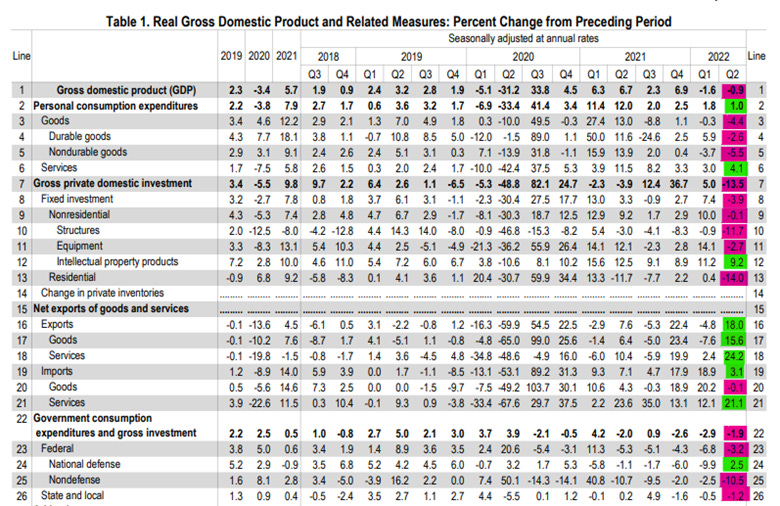
Real gross domestic product (GDP) decreased at an annual rate of -0.9% in the second quarter, following a -1.6% drop in Q1 and technically entering a recession, the advance estimate showed. Personal consumption expenditures rose by 1%, with purchases of Goods down by -4.4% and Services higher by 4.1%. Inventories declined mostly at general merchandise stores as well as motor vehicle dealers. Residential investment fell by -14%, structures by -11.7%, and equipment by -2.7%. On the other hand, net trade made a positive contribution for the first time in two years, as exports jumped by 18%, led by industrial supplies, materials, and travel, while imports were up by 3.1%. The PCE price index increased by 7.1%, the same rate as the first quarter. Excluding food and energy prices, the Core PCE price index increased 4.4%, compared with an increase of 5.2%. Current-dollar personal income increased by $353.8 billion in the second quarter, compared with an increase of $247.2 billion in the first quarter. Disposable personal income increased by $291.4 billion, or 6.6%, in the second quarter, in contrast to a decrease of -$58.8 billion, or -1.3%, in the first quarter. Real disposable personal income decreased by -0.5%, compared with a decrease of -7.8% in Q1. Personal saving was $968.4 billion in the second quarter, compared with $1.02 trillion in the first quarter. The personal saving rate—personal saving as a percentage of disposable personal income—was 5.2% in the second quarter, compared with 5.6% in the first quarter.
Why it Matters: As we are fond of saying, things are slowing quickly. The decrease in real GDP reflected decreases in private inventory investment, residential fixed investment, federal government spending, state and local government spending, and nonresidential fixed investment. That enough things for you? This was partly offset by increases in exports and personal consumption expenditures (PCE). The drag from inventories is a little perplexing, given the growth in the actual inventory data seen elsewhere. Declines in residential investment plunged at a -14% annual pace, the largest decline since the start of the pandemic and reflective of how high borrowing costs along with rapid inflation have squeezed the housing market. Regarding the income side, things improved from Q1, with real DPI only down -0.5% as wage gains kept purchasing power from falling too much.
*The slowdown in housing activity is translating to less residential investment, which was the largest drag on GDP growth in Q2
*There are signs that consumers, particularly those with lower incomes, are switching brands, forgoing some discretionary purchases, and saving less to cope with higher prices as real PCE is falling below the trend
*Consumers have been able to keep their real disposable income levels high in part because they have drawn down their savings or increased their credit-card borrowing
*Broad declines in everything but spending on services and the trade balance
The final University of Michigan consumer sentiment for July rose to 51.5 from a record low of 50 in June, slightly higher than the preliminary reading. The Current Economic Conditions subindex was revised higher to 58.1 from a preliminary of 57.1 and a reading of 53.8 in June. The Expectations gauge fell to 47.3 from 47.5 in June, the lowest reading since 2009. Concerns over global factors have eased slightly, helping buying conditions for durables improve, although they remained near the all-time low reached last month. There was a slight decrease in long-run inflation expectations, with one-year ahead falling slightly to 5.2% (from 5.3%) and five-year ahead 2.9% (from 3.1%).
Why it Matters: There was a slight improvement in the headline reading due to a notable improvement in perceived current conditions. However, it is too early to tell if the drop in gasoline prices has led to bottoming consumer confidence. The slight moderation in inflation expectations was a positive, but both one and five-year ahead inflation expectations remained highly elevated and well above any level the Fed can take comfort in. We still believe that there will be a continued improvement in consumer sentiment as inflation falls in the second half of this year, first from gasoline as already seen but increasingly elsewhere. Confidence will also be eventually helped by November’s midterm election, with Republicans and Independents historically taking comfort from a divided Congress.
*Improvements in views on current conditions helped drive the overall index higher after hitting a record low in June
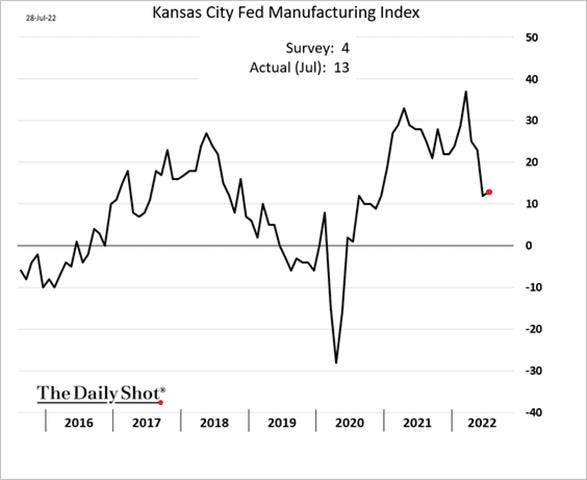
Kansas Fed Manufacturing Index increased to 13 points in July from 12 points in June. Activity and demand-orientated sub-indexes expanded with Production (7 vs. -1 in June), Backlog of Orders (5 vs. -4), and Shipments (9 vs. -3) returning to expansionary territory while New Order (-2 vs. -8) improved. Employment-orientated sub-indexes fell, although remained expansionary while Inventory intentions contracted, especially for Finished Goods (-5 vs. 9). Supplier Delivery Times (23 vs. 25) only marginally improved/shortened. Price pressures fell notably, with Prices Paid (41. Vs. 71) falling the most due to declines in energy costs.
Why it Matters: The KC results were more in line with other regional Fed manufacturing surveys. It showed a rebound in activity and demand while there was a reduction in prices and inventory. Unlike others, the employment-orientated subindexes fell, although not material, and remained expansionary. This month special questions asked about the use and need for physical infrastructure, the change in the geographical area that firms pull workers and remote workers from over the last year, and remote workers’ wages compared to in-person wages for the same type of occupation. In July, 71% of firms reported they were using 100% of the firm’s pre-pandemic physical infrastructure, with 66% of firms expecting no change in that moving forward. About 85% of firms reported that if they have remote workers, their wages are the same compared to in-person wages. Most firms reported that the geographical areas they pull workers (74.2%) and remote workers (86.5%) from had stayed the same over the last year.
*Thanks to rebounds in activity and demand-orientated sub-indexes, the headline KC Fed manufacturing Index rose by one point, remaining in expansionary territory.
*There was a clear story in the July KC report, with prices, inventory and labor-orientated sub-indexes falling
The Chicago PMI decreased to 52.1 points in July from 56.0 points in June and missing market forecasts of 55. The Production (-7.0 to 48.2) and New Orders (-5.4 to 44.5) sub-indexes fell further, both now near a two-year low. Order Backlogs slumped -6.8 points to 48.4. The Employment measure rose 5.4 points to a current year high of 56.1. The Supplier Deliveries sub-index hit the lowest level since October 2020, falling -2.0 points to 67.1, but still historically elevated. Inventories saw a significant decrease, plunging 16.2 points. Prices Paid rose 2.3 points to 81.9 as price pressures intensified.
Why it Matters: Bucking the trend seen in other regional Fed manufacturing surveys, the Chicago PMI was notably bad and saw no bounce back in the headline and demand-orientated sub-indexes in July as seen elsewhere. It was the lowest reading since August of 2020, with the largest drop in the Inventory sub-index ever recorded. The employment picture continued to be strong and lead times were little changed while there was a worsening in price pressures, showing no/little supply-side improvements. Otherwise, everything else fell, with demand/production orientated subindexes all firmly in the contractionary territory now.
*Activity and demand-orientated measures worsened notably in the Chicago region while the inflation picture did not improve
*The higher/improving readings of employment measures in many of the business surveys are getting a lot of attention as firms still struggle with finding and retaining qualified labor, giving the current slowdown a much different feel
Policy Talk:
Although it's been almost a week, we want to highlight some of the main takeaways from July’s FOMC meeting and Powell’s comments in the presser. Generally, both the prepared statement and Q&A had something for both those who wanted to see dovish and hawkish indications. This was due to Powell being less clear about what lay ahead at coming meetings, reducing the “forward guidance,” telegraphing that was more prevalent in prior meetings as they “enter a more data-dependent period.” The statement acknowledged that spending and production have softened while comments about supply chain disruptions with regard to China and Covid-19 have been removed. Powell stressed that the committee was looking for "compelling evidence" inflation is coming down with another unusually large rate hike potentially appropriate in September, which along with other comments, indicates that, not surprisingly, fighting inflation is still paramount. However, he stressed a broader read of all data verse just watching PCE and CPI, giving those for a more dovish message some hope that a policy pivot was coming later in the year. He also acknowledged that rates were at neutral and that the lagged effect of policy changes means they would move more carefully into what they saw as restrictive territory. Interestingly, he did not think he would do September 2020-style forward guidance again.
“We've been saying we would move expeditiously to get to the range of neutral, and I think we’ve done that now. We’re at 2.25 to 2.5, and that’s right in the range of what we think is neutral.”
“You know, we’ll be looking at the incoming data, as I mentioned, and that’ll start with economic activity. Are we seeing the slowdown that we—the slowdown in economic activity that we think we need, and there is some evidence that we are at this time.”
“And it’s also worth noting that these rate hikes have been large, and they’ve come quickly, and it’s likely that their full effect has not been felt by the economy. So there’s probably some additional tightening—significant additional tightening in the pipeline.”
“So where are we going with this? I think the best—I think the committee, broadly, feels that we need to get policy to—at least to a moderately restrictive level, and maybe the best data point for that would be what we wrote down in our SEP at the June meeting.”
“We actually think we need a period of growth below potential in order to create some slack so that the supply side can catch up. We also think that there will be, in all likelihood, some softening in labor-market conditions.”
“I do not think the U.S. is currently in a recession. And the reason is, there are just too many areas of the economy that are—that are performing, you know, too well.”
“We don’t know the situation. The truth is, though, we think that demand is moderating. We do. How much is it moderating? We’re not sure. We’re going to have to watch the data carefully.”
“The process of getting back down to the new equilibrium (balance sheet) will take a while. And that time—it’s hard to be precise, but, you know, the model would suggest that it could be between two, two and a half years, that kind of thing. And this is a much faster pace than the last time. The balance sheet is much bigger than it was. But we looked at this carefully, and we thought this was a sensible pace. And we have no reason to think it’s not.”
“So a big piece of that is inflation expectations; you know, break-even is coming down, which, you know, is a good thing. It’s a good thing that markets do seem to have confidence in the committee’s commitment to getting inflation back down to 2 percent. So we’d like to see market-based readings of inflation expectations come down.”
We reluctantly want to highlight an ongoing debate between Governor Waller and Larry Summers and company regarding the likelihood that the Fed will be able to orchestrate a “soft-landing.” We say reluctantly because it is highly academic, and we find historically that new (positive and negative) shocks usually keep economic data and hence policy reactive, not something that can be modeled too far out. The crux of the argument is whether the Fed can move policy into a restrictive stance, deflating excess demand for labor, as measured by the vacancy rate relative to the unemployment rate, without pushing the unemployment rate to levels that would signal a recession. Waller published a research paper on Friday, and Summers and Olivier Blanchard responded with a note on Monday. Today’s JOLTs data added to the debate, with job vacancies now down by almost one million from the end of April to the end of June, the third largest decline on record and something that would be a very troubling signal historically. However, the unemployment rate has held steady at 3.6%, with 1.8 million job vacancies per unemployed job seeker. It is too early to tell, but the very preliminary evidence indicates that the Fed is slowly reducing the tightness in labor markets without detrimentally raising the UER.
*“Regarding the slope of the Beveridge curve, currently, the V-U ratio is historically high, implying that the labor market is on a very steep portion of the Beveridge curve… A steeper curve implies that the unemployment rate will change less for a given reduction in vacancies.” - Andrew Figura and Chris Waller
*“We find it entirely unconvincing as support for the ‘soft landing’ idea -- pushed mostly recently by Fed Chair Jerome Powell in his July press conference -- that vacancies can decline substantially taking pressure off inflation without driving unemployment way up, rather, the data support our conclusion that vacancies are very unlikely to normalize without a major increase in unemployment.” -Blanchard, Domash and Summers
The New York Fed released its Quarterly Report on Household Debt and Credit, which showed total household debts increasing $312 billion (2%) to $16.15 trillion in Q2. Balances now stand $2 trillion higher than at the end of 2019, before the COVID-19 pandemic. Mortgage balances rose by $207 billion and stood at $11.39 trillion, while credit card balances increased by $46 billion, a 13% YoY rise and the largest increase in more than 20 years. Mortgage originations slightly declined in the second quarter and stood at $758 billion. The volume of newly originated auto loans increased to $199 billion, continuing the high volumes seen in dollar terms since Q3 2020. Aggregate limits on credit card accounts increased by $100 billion and now stand at $4.22 trillion, the largest increase in more than ten years.
*“The second quarter of 2022 showed robust increases in mortgage, auto loan, and credit card balances, driven in part by rising prices,” said Joelle Scally, Administrator of the Center for Microeconomic Data at the New York Fed.
*The share of current debt transitioning into delinquency increased modestly for all debt types but remains historically very low. The delinquency transition rate for credit cards, auto loans, and other debts increased by 0.5 percentage points, with home equity lines of credit increasing by 0.7 percentage points.
Technicals and Charts:
Four Key Macro House Charts:
Growth/Value Ratio: Growth is little changed on the day but weaker on the week. Large-Cap Value is the best performing size/factor on the day.
Chinese Iron Ore Future Price: Iron Ore futures are lower on the day, and little changed on the week. Despite low levels of steel inventory, weaker July economic data weighed on sentiment regarding future demand
5yr-30yr Treasury Spread: The curve is flatter on the day and the week as numerous Fed officials have pushed back on any dovish interpretation of the July FOMC meeting
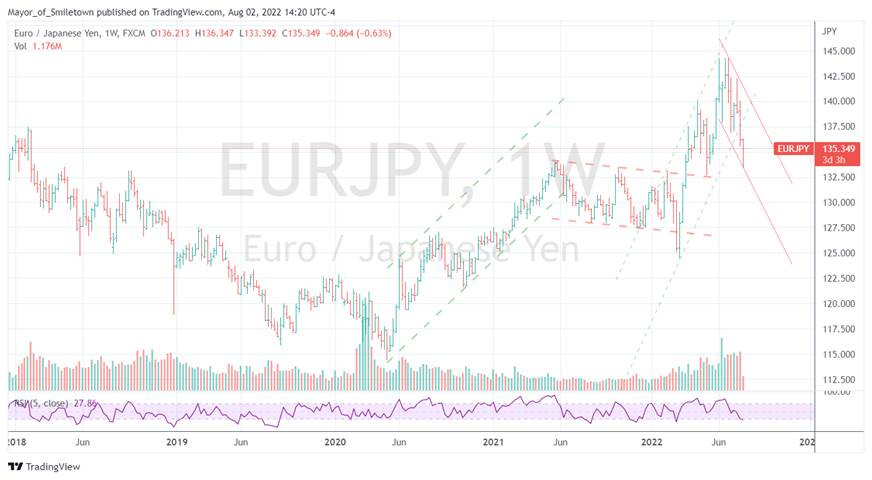
EUR/JPY FX Cross: The Yen is higher on the day and on the week. Speculative Yen shorts are increasingly being covered
Other Charts:
Q3 earnings estimates continue to fall, giving investors confidence that a more realistic outlook is increasingly priced in
Although falling, the percentage of companies beating earnings expectations is still above the average level for Q2
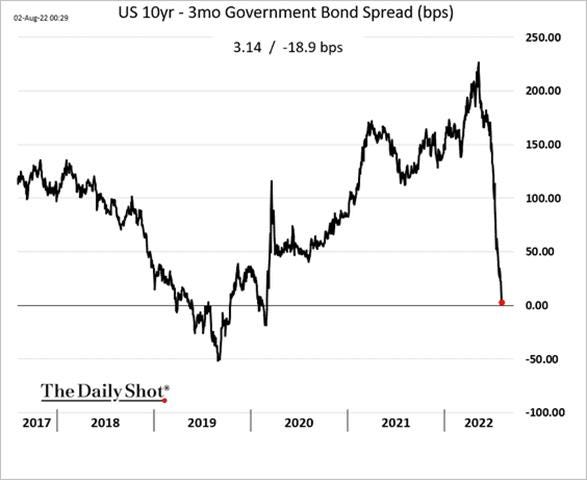
The all-telling three-month vs. ten-year yield curve is about to invert, something that has successfully signaled a recession every time.
The fast level of inversion has been due to the historically fast level of rate hikes as the Fed scrambles to move Fed funds to a more restrictive level.
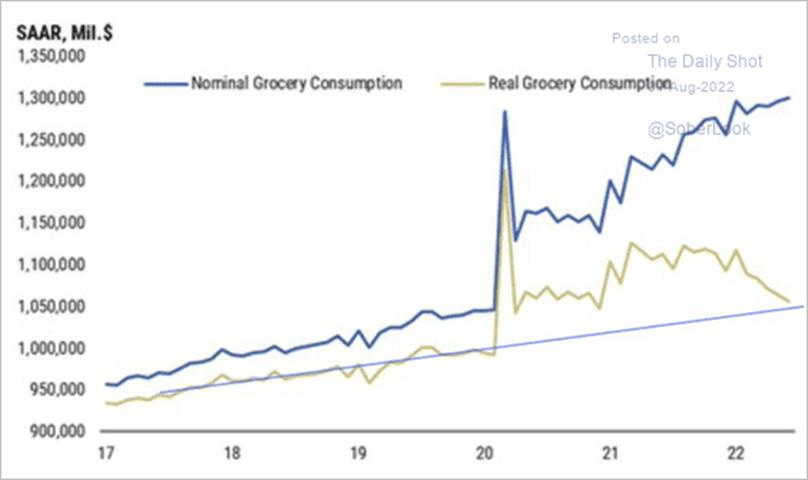
Inflation is causing real disposable income to remain flat, with this seen very clearly in spending on groceries, which are taking a larger percentage of overall spending while not delivering increased amounts of goods
The money growth rate, as measured at the M2 level, has been a good leading indicator of where inflation is going. With QT picking up pace, money growth will likely become negative into year-end.
“American Automobile Association’s estimate of the average price at the pump was showing a year-on-year inflation rate that was its lowest since early 2021, barring a few days just before the Ukraine invasion. True, year-on-year inflation is still at a nosebleed 32%, but the direction of travel is unmistakable.” – John Authors @ Bloomberg
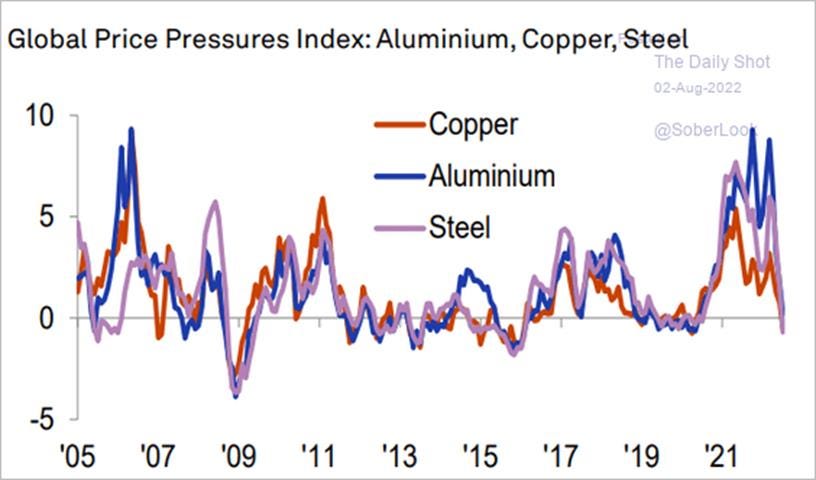
Inflationary pressures through rises in commodity prices have reversed for industrial metals.
Most of the decline in labor force participation since the pandemic has been driven by early retirements and demographic exits. - GS
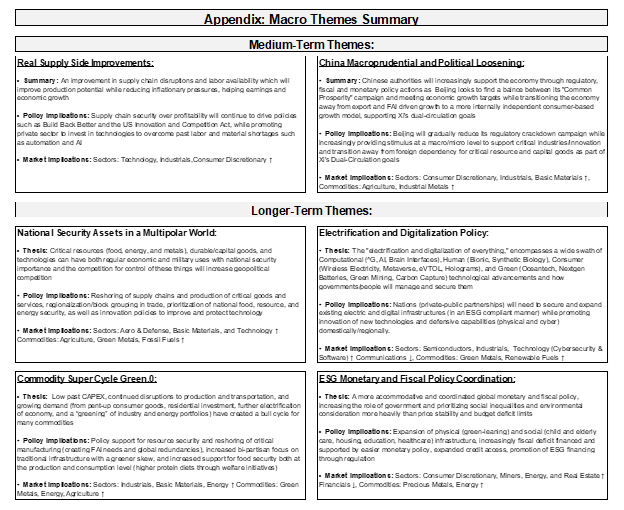
Article by Macro Themes:
Medium-term Themes:
Real Supply-Side Situation:
Again?: Container Ship Backlog Grows Again at the Port of Savannah – WSJ
A backup of container ships off Georgia’s Port of Savannah, the fourth-largest U.S. gateway for seaborne container imports, has swelled to 40 vessels, reviving a bottleneck that had cleared earlier this year and raising fresh concerns over potential supply-chain disruptions during the critical peak shipping season. Officials at the port said the delays in getting ships to berths resumed in recent weeks as shipping volumes accelerated after an earlier backlog that topped out at about 30 ships were cut back to nothing this spring. Mr. Lynch said the demand has been surging earlier than usual this year because some major retailers moved up their back-to-school and holiday imports to beat ongoing supply-chain challenges.
Why it Matters:
The backup at Savannah, which handled some 2.9 million containers last year, is the latest sign that congestion at U.S. seaports is persisting even as authorities from Southern California to New York are trying to speed up the flow of boxes and keep goods moving. A backlog of vessels at the California ports of Los Angeles and Long Beach, the largest U.S. container import complex, that peaked at 109 vessels in January has receded to between 20 and 24 vessels on most days and dipped as low as 17 ships earlier this week, according to the Marine Exchange of Southern California. But importers still face lengthy delays in moving goods by rail out of the Southern California ports, and backups have cropped up at sites including Savannah and the Port of New York and New Jersey as shippers have sought to find alternative routes into U.S. markets.
Still with the Autos: Chip crunch eases for phones and PCs, but not for cars - NikkeiAsia
After a long stretch of tight supply, there is a growing view among market watchers that the chip market has passed its peak in the current round of the boom-bust cycle that the industry goes through every three to four years. Global smartphone shipments fell -9% on the year in the second quarter, according to Canalys, and IDC data shows a -15% drop in PC shipments. Gartner, in July, cut its global semiconductor revenue growth forecast for the year from 13.6% to 7.4%. "Memory demand and pricing have softened, especially in consumer-related areas like PCs and smartphones, which will help lead the slowdown in growth," it said.
Why it Matters:
The semiconductor shortage that has plagued manufacturers is showing signs of turning around in some areas as inventories build up, but this dearth of chips for autos, industrial equipment, and data centers looks likely to drag on until late in the year. Toyota Motor has cut its August production estimate by roughly 20% from its initial figure. Semiconductor demand once depended heavily on consumer electronics like PCs and smartphones. While they still play a big role, chips for other applications, like autos and servers, have been rising fast. The market also has more variables to account for, like the ongoing logjam in global shipping.
China Macroprudential and Political Loosening:
More Capital: China Banks Rush to Raise Record Debt as Credit Losses Mount - Bloomberg
Chinese banks are rushing to boost capital as they prepare for a potential spike in bad loans due to the economic slowdown and spreading housing crisis. A record amount of fresh money has come from financial markets, with banks selling 29% more bonds in the first half of the year compared to last year to replenish capital and cover credit losses. Lenders have sold a combined 568 billion yuan ($84 billion) of additional Tier 1 debt, which is the main tool banks use to add extra capital and is the first to absorb losses in times of stress, and Tier 2 bonds. Local authorities also provided funds, allowing around 320 billion yuan from the sale of special local bonds to be used to top up the capital of medium- and small-sized banks. The amount, including 120 billion yuan in unused funds from last year, is 60% higher than in 2020, when money from the sale of these bonds was first allowed to be used for that purpose.
Why it Matters:
Financial regulators have urged banks to boost lending to builders to help finish the projects, and officials are considering giving some homeowners a grace period on payments. Stepping back, the “slower than expected” economic recovery has led S&P to raise its estimate of banks’ non-performing assets, which includes bad loans and some ‘special-mention loans,’ to 7.5% of total lending this year. That’s up from a May forecast of 6.5% and last year’s actual ratio of 6% (although the street has long considered the number much higher). The problem is especially acute at small and medium-sized lenders, which hold 29% of the banking sector’s total assets, according to CBIRC data. They have long been plagued by lax governance and heavy reliance on big local firms for loans and deposits. They are also more exposed to the weak links in the economy than bigger lenders, such as agriculture-related industries and small businesses.
More Stimulus: China’s central bank seeks to mobilize $148bn bailout for real estate projects - FT
Beijing is seeking to mobilize up to Rmb1tn ($148bn) of loans for millions of stalled property developments in its most ambitious attempt to revive the debt-stricken sector and head off a backlash by homebuyers. The People’s Bank of China will initially issue about Rmb200bn of low-interest loans, charging about 1.75% a year, to state commercial banks, according to people involved in the discussions. Under the plan, recently approved by China’s State Council, the banks will use the PBoC loans along with their own funds, lent at market rates, to refinance stalled real estate projects.
Why it Matters:
Overleveraged developers have had to suspend the construction of millions of apartments nationwide over the past year, raising concerns of financial and social turmoil if increasing numbers of home buyers withhold mortgage payments or take to the streets. Housing transactions in smaller “third-tier” cities, where most unfinished developments are located, fell more than a third this month from a year ago, even after local authorities rolled out numerous support measures to boost buyer demand, ranging from interest rate cuts to subsidies on purchases. Many unfinished projects have zero or negative value after taking into account their existing debts,” said an executive at a state lender that the PBoC has asked to join the bailout fund. As a result, it is unclear how effective additional loans will be if expected project profitability and cashflows remain negative.
Longer-term Themes:
ESG Monetary and Fiscal Policy Expansion:
Friends Again: Joe Manchin Reaches Deal With Chuck Schumer on Energy, Healthcare, Tax Package – WSJ
Sen. Manchin agreed to back a package aimed at lowering carbon emissions and curbing healthcare costs while raising corporate taxes, marking a stunning revival of core pieces of President Biden’s economic and climate agenda. The deal would raise roughly $739 billion, with much of the revenue coming from a 15% corporate minimum tax and enhanced tax enforcement efforts at the Internal Revenue Service, as well as projected savings from allowing Medicare to negotiate some prescription-drug prices. Of that new revenue, roughly $369 billion would be spent on climate and energy programs, including tax credits for buying electric vehicles, with another $64 billion dedicated to extending healthcare subsidies for three years for some Affordable Care Act users. The bill would dedicate the rest of the new revenue toward reducing the deficit, according to a summary provided by Messrs. Schumer and Manchin.
Why it Matters:
The deal will still need the support of almost every other Democrat in Congress, and while some embraced it, others were more cautious, saying they needed to review the details. Passing the agreement into law will test the ability of Mr. Schumer and House Speaker Pelosi to convince an ideologically diverse group of lawmakers to accept a deal announced by one of the party’s most conservative members. Republicans are set to unanimously oppose the bill if it comes up for a vote and will likely attempt to use procedural maneuvers and amendments to pare it back if possible.
Incentives: The New Climate Bill’s Secret Weapon? Tax Credits – Wired
The Inflation Reduction Act Bill would allocate $369 billion toward energy security and climate action by supporting domestic manufacturing of clean energy technologies like wind and solar power and preparing American agriculture for extreme heat, among many other campaigns. Consumers would benefit too if this bill passes. It includes ten years of tax credits to install all kinds of clean residential technologies, from rooftop solar to heat pumps. The bill would provide $9 billion in rebates for low-income Americans to switch to electric appliances and retrofit their homes to be more energy efficient and give people a $7,500 tax credit for buying a new electric vehicle.
Why it Matters:
All told, this bill would put the country on track to reduce its emissions by 40% by the year 2030. “We will improve our energy security and tackle the climate crisis by providing tax credits and investments for energy projects,” said President Joe Biden in a statement announcing the bill. “This will create thousands of new jobs and help lower energy costs in the future.” Targeting homes for climate-proofing with tax credits and rebates actually does both and then some. The ultimate goal for clean energy advocates is the fully electric home (no gas for stoves or furnaces allowed), which can run on renewable power like rooftop solar.
Potential to Pass: Senate Advances $280 Billion Bill Subsidizing Chip Manufacturing, Technology – WSJ
The Senate voted 64 to 32 Tuesday to advance a $280 billion package of subsidies and research funding to boost U.S. competitiveness in semiconductors and advanced technology. The bill combines about $52 billion in subsidy funding to boost semiconductor production in the U.S., along with about $24 billion in advanced manufacturing tax credits that would also support the industry. The package would authorize about $200 billion in spending, mainly for federally backed scientific research over the next decade. It would fund about $1.5 billion for next-generation wireless research and establish new long-term policies for the nation’s space program.
Why it Matters:
The package is set to give a big boost to domestic chip production, seen by the White House and leaders in both parties as critical to the U.S. supply chain and national security, as most semiconductors are imported from overseas. Supporters, including the Biden administration and the U.S. chip-making industry, say the legislation is needed because of the high cost of building advanced chip manufacturing facilities. They say the investment is needed for the U.S. to maintain its technological edge and to prevent semiconductor production from becoming too concentrated in Asia, where there are geopolitical risks of supply disruption.
Appendix:
Current Macro Theme Summaries:
VIEWS EXPRESSED IN "CONTENT" ON THIS WEBSITE OR POSTED IN SOCIAL MEDIA AND OTHER PLATFORMS (COLLECTIVELY, "CONTENT DISTRIBUTION OUTLETS") ARE MY OWN. THE POSTS ARE NOT DIRECTED TO ANY INVESTORS OR POTENTIAL INVESTORS, AND DO NOT CONSTITUTE AN OFFER TO SELL -- OR A SOLICITATION OF AN OFFER TO BUY -- ANY SECURITIES, AND MAY NOT BE USED OR RELIED UPON IN EVALUATING THE MERITS OF ANY INVESTMENT.
THE CONTENT SHOULD NOT BE CONSTRUED AS OR RELIED UPON IN ANY MANNER AS INVESTMENT, LEGAL, TAX, OR OTHER ADVICE. YOU SHOULD CONSULT YOUR OWN ADVISERS AS TO LEGAL, BUSINESS, TAX, AND OTHER RELATED MATTERS CONCERNING ANY INVESTMENT. ANY PROJECTIONS, ESTIMATES, FORECASTS, TARGETS, PROSPECTS AND/OR OPINIONS EXPRESSED IN THESE MATERIALS ARE SUBJECT TO CHANGE WITHOUT NOTICE AND MAY DIFFER OR BE CONTRARY TO OPINIONS EXPRESSED BY OTHERS. ANY CHARTS PROVIDED HERE ARE FOR INFORMATIONAL PURPOSES ONLY, AND SHOULD NOT BE RELIED UPON WHEN MAKING ANY INVESTMENT DECISION. CERTAIN INFORMATION CONTAINED IN HERE HAS BEEN OBTAINED FROM THIRD-PARTY SOURCES. WHILE TAKEN FROM SOURCES BELIEVED TO BE RELIABLE, I HAVE NOT INDEPENDENTLY VERIFIED SUCH INFORMATION AND MAKES NO REPRESENTATIONS ABOUT THE ENDURING ACCURACY OF THE INFORMATION


