Midday Macro - 8/17/2022
Color on Markets, Economy, Policy, and Geopolitics
Midday Macro – 8/17/2022
Market Recap:
Price Action and Headlines:
Equities are lower, with a negative overnight session, due to hotter than expected U.K. inflation data, not reversing at the NY open as July’s Retail Sales data was seen as a mixed bag, and recent earnings were less inspiring
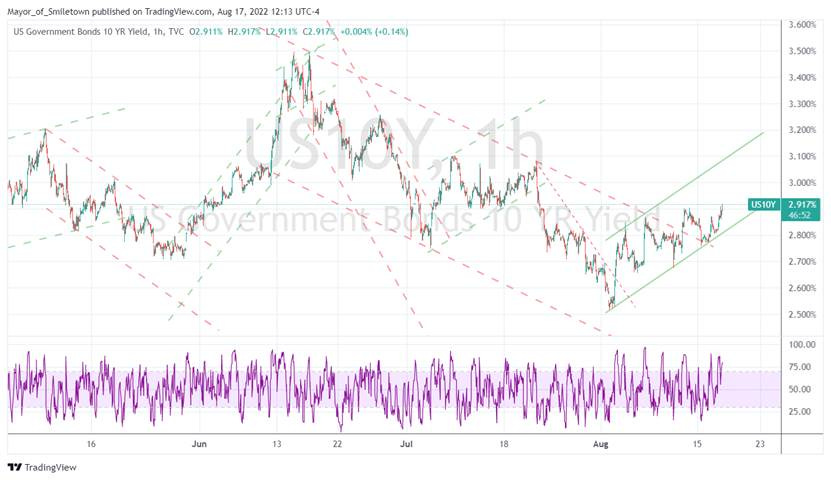
Treasuries are lower, with the curve flattening, although the belly is being hit the hardest as rising rates overseas have 10yr yields back near 3% as traders await the July FOMC minutes for hawkish/dovish clues
WTI is higher, although off session highs despite more significant than expected drawdowns as seen in the weekly EIA stock data with the JCPOA 2.0 saga continuing to shrowd future supply expectations
Narrative Analysis:
The June “Bear-Market” rally is taking a breather today after the S&P methodically bounced off its 200-DMA yesterday, and higher-than-expected inflation in the U.K. reported overnight reminded traders that all is not well yet, giving a pause to the Nasdaq's recent outperformance as more defensive sectors such as Utilities and Staples as well as Energy are best in class on the session. Generally, real rates have been creeping higher lately while the Fed continues to jawbone markets out of thinking they will ease too quickly next year, both of which are increasingly weighing on sentiment and leading many to question whether the current rally has gone too far. Today’s July FOMC minutes will shed further light on where Powell and company see things going, but given what we heard following the meeting, it is likely to be more neutral than overly hawkish or dovish. After all, the Fed continues to tell us it is moving away from forward guidance and becoming more data-dependent. Speaking of the data, Retail Sales was flat mainly due to reduced sales of autos and gasoline, although in real terms, most categories saw a deceleration outside of online orders and household durables. Stepping back, the data picture became more bifurcated this week, with Industrial Production holding up while the NY Fed’s regional manufacturing survey plunged due to deteriorating demand. There is still no relief in sight for housing. This more cautious picture has failed to stop Treasuries from continuing to sell off. Elsewhere oil is still down-trending with little bullish data and developments sticking. Copper has consolidated over the last few sessions as the outlook for China remains puzzling. The Agg market continues to be rangebound, with last Friday’s WASDE report helping traders recalibrate domestic supply data. Finally, the dollar has broken out of its recent downtrend, with the Euro and Yen materially weakening over the last few sessions.
The S&P is outperforming the Nasdaq and Russell with Momentum, Low Volatility, and High Dividend Yield factors, and Energy, Utilities, and Consumer Staples sectors are outperforming on the day. More growth-sensitive and defensive sectors and factors (Utilities & Staples and Momentum & High Dividend Yield) have outperformed over the last week.
@KoyfinCharts
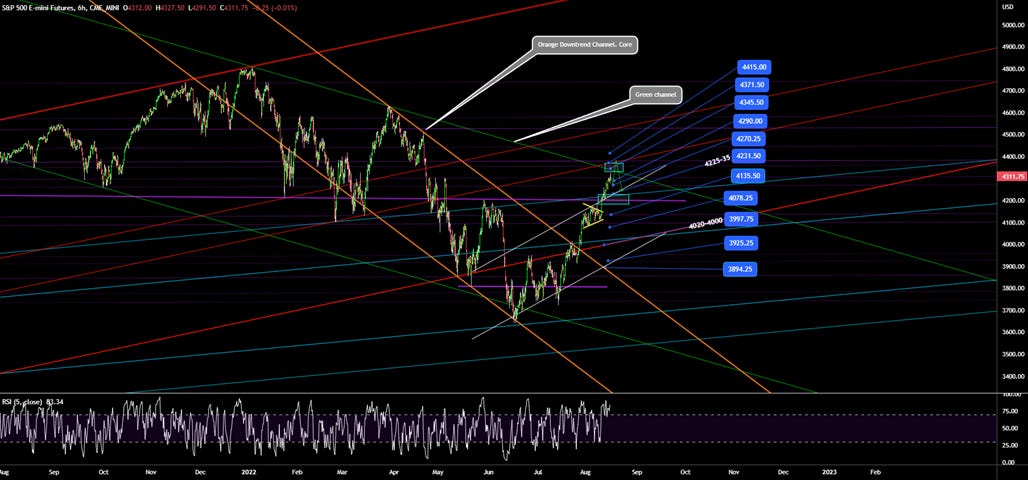
S&P optionality strike levels have the Zero-Gamma Level at 4217 while the Call Wall is 4300. Support is around 4250-60, with resistance at 4300. Yesterday's intraday action was notable as markets made an afternoon charge above the 4300 Call Wall. The rally was rejected sharply at 4325 as negative delta trading (call selling, put buying) increased into that major technical level (200-dma), driving the S&P back toward 4300. The move above the Call Wall did not seem to produce noticeable new long positions but did increase the overall size of gamma at that strike. With Friday’s Opex, it is likely next week will see greater volatility.
@spotgamma
S&P technical levels have support at 4235, then 4205, and resistance at 4275, then 4290. From July 30th to August 9th, the S&P consolidated sideways, forming a textbook bullish symmetrical triangle. On August 10th, we broke it out, and the price is doing what it always does after breaking out a two-week pattern: Rallying non-stop, trapping shorts on every dip, and running to the next large resistance zone. Today markets are getting some needed cool-off after a big multi-day run, with 4235 the key area of support to keep the rally going.
@AdamMancini4
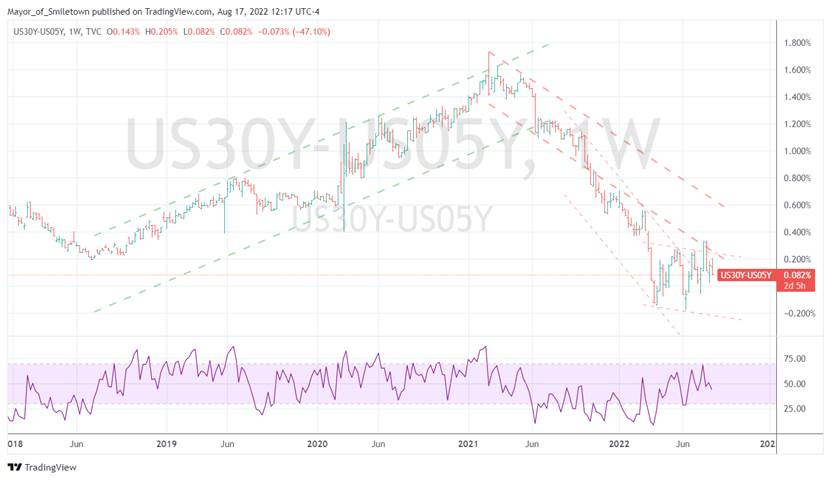
Treasuries are lower, with the 10yr yield at 2.91%, higher by 11bps on the session, while the 5s30s curve is flatter by 5.4 bps, moving to 8.2 bps.
Deeper Dive:
We are writing a shorter “Deeper Dive” today due to a sick toddler who can’t go to daycare this week but seems to have more energy than ever and needs lots of attention. We mainly want to convey that we reached our $SPY, $QQQ, and $VBK equity long targets and have taken profit there. Going into Friday’s August Opex and fully aware that macro fundamentals have only stabilized at best, we didn’t want to push our luck and still see the current environment as favoring tactical trading. As often written, we are still expecting inflation to fall faster than expected into year-end, allowing Fed policy to neutralize/normalize next year, but this doesn’t mean equities and risk assets more generally are going to recover all of this year's losses anytime soon. The level of gains now has indexes well into overbought conditions, and a cooling/retracement is in order. With QT starting in earnest in September and seasonalities becoming more challenging, we are moving the mock portfolio to a more defensive/cash-heavy position regarding our U.S.-focused plays. After much internal debate over the last three weeks, we continue to keep our Chinese equity and copper longs (two highly correlated trades). The barrage of positive and negative headlines regarding the zero-Covid policy, fiscal/monetary stimulus, and “Wolf Warrior” posturing leave us uninspired but still believing that 2023 will be a significantly better year for Chinese growth and financial assets. As a result, we have moved higher our stops but will remain patient there. Finally, we are adding a 5% natural gas short through the $UNG ETF. This is simply a tactical contrarian trade as U.S. natural gas has hit resistance around these levels twice before, and the level of bullishness seems detached from (domestic) fundamentals. We are looking for a -20% correction with a stop 12% higher, something the “Widowmaker” can do in a session, but again, we believe technicals and fundamentals indicate an overbought condition.
We saw the mid-June period as overly bearish given what we were reading in the harder economic data and where we expected inflation to go. As a result, we entered a more contrarian S&P long at the time and were able to ride much of the current rally, increasing our existing S&P long position while also adding sector/factor-specific positions we thought would outperform in mid-July. We continue to see a path for a soft landing and a further grind higher in equities into year-end, but technicals and optionality indicate that this is a good area to take profit, and we did so yesterday when the S&P hit 4300. We also believe the Fed will continue to jawbone financial conditions tighter even as future inflationary data resets the expected trend lower there, ultimately capping risk-asset gains even as volatility falls. Finally, we continue to be patient with our Yen and biotech/healthcare combo longs. This leaves us with four overarching themes in the portfolio: China’s Recovery ($FXI and $JJC), U.S. Healthcare Outperformance ($IBB and IYH), Dollar Weakness ($FXY), and Normalization in Energy Prices ($UNG). We would say all four of these are contrarian, and as a result, we have tighter stops but look for tactical recalibration in market narratives and leadership to allow us to reach price targets.
*Our mock portfolio is now down -2.23% since its inception and is 60% invested
We will not be writing again until the week of 9/19 due to travel/vacation and daddy daycare duties. Sorry for this inconvenience.
Econ Data:
Retail sales were unchanged in July, with markets expecting a 0.1% increase. Sales at nonstore-retailers increased by 2.7%, boosted in large part by Amazon’s Prime Day event. Increases were also recorded for building material & garden eq. & supplies dealers (1.5%), miscellaneous store retailers (1.5%), electronics & appliance stores (0.4%), health & personal care stores (0.4%) and at grocery stores (0.2%) as food prices jumped 1.1%. On the other hand, sales at gasoline stations fell by -1.8% as the gasoline price index dropped by -7.7%. Declines were also seen for motor vehicle & parts dealers (-1.6%), clothing & clothing accessories stores (-0.6%) and at department stores (-0.5%). Excluding gasoline stations, sales rose 0.2% (vs. 0.6% in June). Excluding automobiles, gasoline, building materials, and food services, the so-called core retail sales rose 0.8% (vs. 0.7%).
Why it Matters: The report was not as bad as we feared, given online purchasing activities and improvements in home-orientated “bigger” ticket items (appliances and furniture). The drop in gas station purchases can be seen as a positive as rises in gas prices up until June had been acting increasingly on a tax and slowing consumption elsewhere. Further, although complicated given the weaker outlook consumer have for auto purchases, we still see a supply/demand imbalance limiting auto sales and keeping prices artificially high. We would expect this to start to correct, with greater production occurring (due to fewer parts/materials shortages) increasingly occurring into year-end, allowing inventories to normalize and prices to stabilize. Finally, the retail sales control group (ex-autos, gas stations, and building materials) came in above expectations, increasing 0.8% and while there was a slight downward revision to June (which was revised down to a gain of 0.7% from 0.8%) there was a significant upward revision to the control group for May, which was revised up to a sizable gain of 0.8% versus an initially reported decline of -0.3%. Core retail sales have risen at a 9.4% annual rate over the last three months.
*There was a sizeable drag from auto sales and gasoline stations, something we knew was coming, but elsewhere things generally expanded, although often not at a real rate
*Most categories slowed from their prior month's reading while online activity and home-orientated bigger ticket purchases increased
Industrial production rose by 0.6% in July, surpassing market expectations of a 0.3% increase and edging higher from the revised higher 0% change in June. Manufacturing output rose by 0.7%, rebounding from the -0.4% decrease in June, with durable and non-durable manufacturing rising by 1.3% and 0.1%, respectively. Within the manufacturing of durable goods, motor vehicle production gained 6.6%, while fabricated metals, aerospace, and miscellaneous transportation equipment all added more than 1%. The index for mining rose by 0.7% MoM, easing from the 2% jump in June. The improvement in July resulted from gains in coal mining and in oil and gas well drilling/servicing. Utilities decreased by -0.8%. Capacity utilization rose by 0.4 percentage points to 80.3% in July, 0.7 percentage points above its long-run average.
Why it Matters: The hard data outside of housing continues to hold up despite the coming weakness that survey/sentiment-based data has shown for months. Total industrial production and manufacturing output, more specifically, rebounded after a weaker June. Mining continues to grow, averaging a 1.4% monthly increase since March, as fossil fuel extraction continues to expand. Mining capacity utilization continues to expand above the long-term average and is now at 88%. The bottom line, even when adjusted for inflation, real industrial production is not signaling a significant contraction in the economy. Further, we take comfort that the sizeable monthly increase in auto production signals a further improvement in the supply-side impairments that exited there (capping capacity) while reducing future inflationary pressures through that channel.
*There was a positive bounce back in July after two weaker previous months
*There are some signs that shortages of needed parts have improved, allowing auto manufacturing capacity to improve
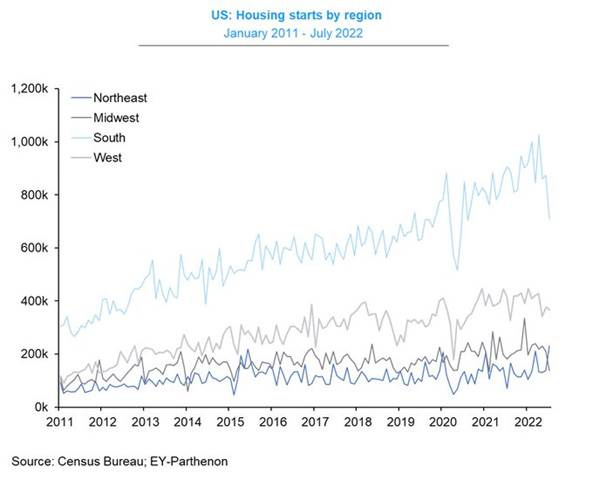
Housing starts fell by -9.6% to an annualized rate of 1.446 million units in July, the lowest since February of 2021 and well below market expectations of 1.54 million. Single-family housing starts sank by -10.1% to 916K, the lowest level since June 2020. Starts for multi-units fell by -10% to 514K. Monthly starts were lower in the Midwest (-33.8%), the South (-18.7%), and the West (-2.7%) but rose in the Northeast (65.5%). Building permits decreased by -1.3% to an annualized rate of 1.674 million in July, the lowest level since September last year, compared to forecasts of 1.65 million. Single-family authorizations dropped by -4.3% to 928K units, while approvals for multi-family units rose 2.5% to 693K. Building permits declined in the West (-12%) and the South (-0.1%) but increased in the Northeast (9.3%) and Midwest (8.1%).
Why it Matters: Construction starts fell in July to the slowest pace since early 2021 as single-family homebuilding tumbled. In an attempt to find something positive, the level of building permits for multi-family units still increased, while every other category of starts or permits decreased. Activity in the Northeast region continued to be the strongest, which makes sense since it saw the weakest gains during the pandemic. As seen elsewhere and according to an analysis by Redfin, more housing deals are also starting to fall through, with 63K agreements to purchase homes canceled in July.
*New housing starts fell by -9.6% MoM to 1.4 million in July, down -8.1% YoY. Single-family home starts fell -10.1% YoY, and multi-unit starts fell -10.0% YoY
*Areas that saw a larger acceleration in housing demand/activity during the pandemic continue to be cooling the most
The New York Empire State Manufacturing Index sank to -31.3 in August, the lowest reading since May of 2020 and missing expectations of 8. Business activity declined sharply as New Orders (-29.6 vs. +6.2), and Shipments (-24.1 vs. 25.3) plunged, while Unfilled Orders declined further (-12.7 vs. -5.2). Delivery Times (-0.9 vs. 8.7) fell into negative territory while Inventories (6.4 vs. 14.8) weakened but remained positive. The labor market indicators both decreased with Employment (7.4 vs. 18) and the Average Workweek (-13.1 vs. 4.3) contracting. Inflationary readings were mixed, with Prices Paid (55.5 vs. 64.3) falling while Prices Received (32.7 vs. 31.3) increased. Business conditions over the next six months (2.1 vs. -6.2) rebounded from a negative reading in July, thanks to improvements in demand-focused sub-indexes. However, expectations for inflationary pressures increased while Capex and IT spending decreased.
Why it Matters: August saw the second largest monthly decline ever in the headline reading. Current demand readings plunged while inventory and employee levels dropped notably, although they remained expansionary. Future expectations broadly improved, especially for demand-orientated sub-indexes, although supply-side improvements were more mixed based on expectations for prices to increase. Further, although weakening, investment intentions remained expansionary. The current part of this report was so bad that it smells wrong. We will have to see what other regional Fed business reports show for August and await next month’s report to see if this one was a fluke.
*The monthly drop in the headline index was one of the largest on record, as New Orders and Shipments decreased by -35.8 and -49.4, respectively
*Current Prices Paid was the only “price” sub-index that declined in August, with Current Prices Received and Future Prices Paid and Received rising after recent falls
The NAHB housing market index declined to 49 in August, the eighth straight month of declines and the lowest reading since May of 2020, and well below market forecasts of 55. The Current Sales subindex dropped 7 points to 57, The Buyer Traffic subindex fell to 32 from 37, and Sales Expectations in the Next Six Months declined by 2 points to 49.
Why it Matters: Higher mortgage rates, ongoing supply chain problems, and high prices continue to “exacerbate housing affordability challenges,” as seen by a further drop in the NAHB/Wells Fargo Housing Market Index. Buyer traffic reached the lowest level since April 2014 except for the spring of 2020, when the pandemic first hit. Roughly one-in-five (19%) home builders in the HMI survey reported reducing prices in the past month to increase sales or limit cancellations. The median price reduction was 5% for those reporting drops. On a more positive note, there was less of a decline in the future sales expectations than in the prior months. “Tighter monetary policy from the Federal Reserve and persistently elevated construction costs have brought on a housing recession. The total volume of single-family starts will post a decline in 2022, the first such decrease since 2011,” said NAHB Chief Economist Robert Dietz.
*“Ongoing growth in construction costs and high mortgage rates continue to weaken market sentiment for single-family home builders,” said NAHB Chairman Jerry Konter
*Looking at the three-month moving averages for the regional HMI scores, the Northeast fell nine points to 56, the Midwest dropped three points to 49, the South fell seven points to 63, and the West posted an eleven-point decline to 51
The Headline Producer Price Index fell by -0.5% in July, following a downwardly revised 1% rise in June and beating market forecasts of a 0.2% increase. The Core PPI (less foods, energy, and trade services) rose 0.2%, following a 0.3% rise in June. The index for final demand goods fell by -1.8%, the largest decline since moving down -2.7% in April 2020. The decrease can be traced to a -9.0% decline in the prices of final demand for energy. Conversely, the final demand for foods and for final demand goods less foods and energy rose 1.0% and 0.2%, respectively. The prices of final demand for services edged up 0.1%, with Trade prices increasing 0.3% and Transportation and Warehousing services increasing 0.4%. Producers paid more for services related to securities brokerage and dealing, hospital outpatient care, automobiles, automobile parts retailing, and transportation of passengers. Prices for processed and unprocessed goods for intermediate demand fell by -2.3% and -12.4%, respectively, the largest decline for both since April 2020. On an annual basis, producer inflation fell to 9.8%, the lowest since October, compared to forecasts of 10.4%.
Why it Matters: It is the first decline in the PPI in over two years, mostly due to a -16.7% drop in gasoline prices. Every Final Demand category decelerated or fell other than Food. Rises in Food were broad outside of grains and oils, with protein-related categories generally rising as the severe Avian Flu outbreak is hurting chicken and turkey egg production, although the price of young chickens fell. There have been signs recently that some of the food price increases reversed in August, especially for eggs. There was a notable deceleration in unprocessed/upstream prices with unprocessed goods for intermediate demand, especially for energy materials (even more than end-demand). Conversely, the price for transportation and warehousing service for intermediate demand increased by 0.9% MoM. We expect this area to cool as more warehouse supply comes online while inventory builds normalize into the holiday period. Finally, there was a 5.1% MoM increase in Final Demand for Construction, showing that builders still face rising cost pressures even with slowing residential demand.
*July’s negative headline print and a slowdown in monthly core increases look to have PPI peaking in June
*The largest drag on the headline PPI came from energy, but every category other than Final Demand for Foods decelerated, helping the headline index fall to 9.8% YoY and core to 5.8% YoY
*Significant drops in the price of Unprocessed products may signal further deflationary pressures are coming down the production pipeline
The University of Michigan consumer sentiment increased to 55.1 in August from 51.5 in July, the highest in three months and beating market forecasts of 52.5, preliminary estimates showed. The Expectations subindex increased to 54.9 from 47.3, while the Current Economic Conditions subindex declined to 55.5 from 58.1. Inflation expectations for a year ahead decreased to 5%, the lowest since February, from 5.2%. Meanwhile, the 5-year inflation outlook rose slightly to 3% from 2.9% in the previous month.
Why it Matters: Some stabilization in outlook while there was a further decline in the current situation reading despite improving prices at the pump. Higher-income consumers, who are more impactful to economic activity, reported large declines in both their personal finances and general buying conditions, leading the Current Conditions sub-index to fall by -4.5 points on the month. All the Future Expectations sub-index components improved this month, particularly among low and middle-income consumers. Uncertainty over the long-run inflation receded a bit. However, the share of consumers blaming inflation for eroding their living standards remained near 48%. How quickly can this reverse in the year's second half if inflation has peaked?
*Despite improvements in Expectations, which helped the overall Sentiment index, declines in the Current Conditions show a detachment from headline inflation (strong historical correlation to gas prices) due to worries regarding personal finances and buying conditions
*Inflation expectations look to be topping despite a slight pick up in the long run inflation level, which saw a drop in uncertainty
*Increases in Consumer Expectations were across party lines with the same for decreases in Current Conditions
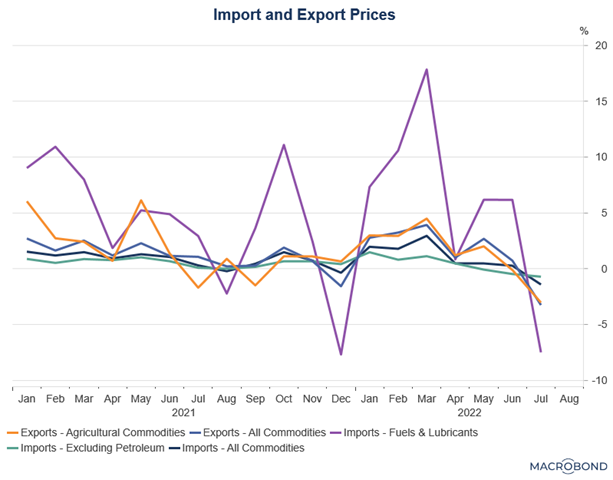
Import prices fell by -1.4% in July, following the upwardly revised 0.3% rise in June and surpassing market expectations of a -1% drop. It was the first decline in import prices since December 2021, as fuel import prices dropped by -7.5%, compared to the 6.2% increase in the previous month. Meanwhile, non-fuel import prices fell by -0.7%, the third consecutive decrease. Import prices are now higher by 8.8% on an annual basis. Export prices fell by -3.3% in July, following a 0.7% gain in June and compared with market expectations of a -1.1% drop. It was the first decline in export prices in seven months and the sharpest one-month decline since April 2020. Lower agricultural (-3.0%) and nonagricultural prices (-3.3%) each contributed to the decline. Export prices are now higher by 13.1% YoY.
Why it Matters: Import prices, ex-petroleum, fell by -0.5% in July, the third straight decline and the steepest decline since 2009, showing the stronger dollar and weaker demand are reducing inflationary pressures through the trade channel. However, prices for imported (and exported) finished goods did increase mainly due to increases in the price of autos (+0.6% MoM). Finally, despite the July drop in import fuel prices, the overall category is still higher by 56.6% annually. In summary, and in line with the other inflation data received for July, there were positive signs that things may have peaked but given the potential for fuel and food prices to rise again, we still have a ways to go to return to a more stable and normal inflationary environment.
*Decreases in imported fuel and exported food prices in July are encouraging, but much can change there quickly
Policy Talk:
In an interview with the Financial Times, San Francisco Fed President Mary Daly did not rule out a third consecutive 0.75 percentage point rate rise at the September FOMC meeting, although she signaled her initial support for the Fed to slow the pace of its interest rate increases. Daly believes rates should rise to around 3.5% by year-end, a level she believes will constrain demand enough to bring inflation down. She pointed out that the policy has already tightened significantly, and the full effects of those actions have not yet been felt. She highlighted that other central banks around the world are also rapidly tightening policy in a “synchronized” way to the extent that has dramatically tightened global financial conditions. At the same time, growth prospects across advanced and emerging economies have fallen. She concluded by saying the Fed needs more than a good monthly report on inflation. Instead, she is looking for the data in the aggregate to affirm the Fed is “on a path to bring inflation down substantially and achieve our price stability target.”
“There’s good news on the month-to-month data that consumers and businesses are getting some relief, but inflation remains far too high and not near our price stability goal.”
“There is a lot of uncertainty, so leaping ahead with great confidence that [a 0.75 percentage point rate rise] is what we need and being prescriptive would not be optimal policy.”
“We have a lot of work to do. I just don’t want to do it so reactively that we find ourselves spoiling the labor market.”
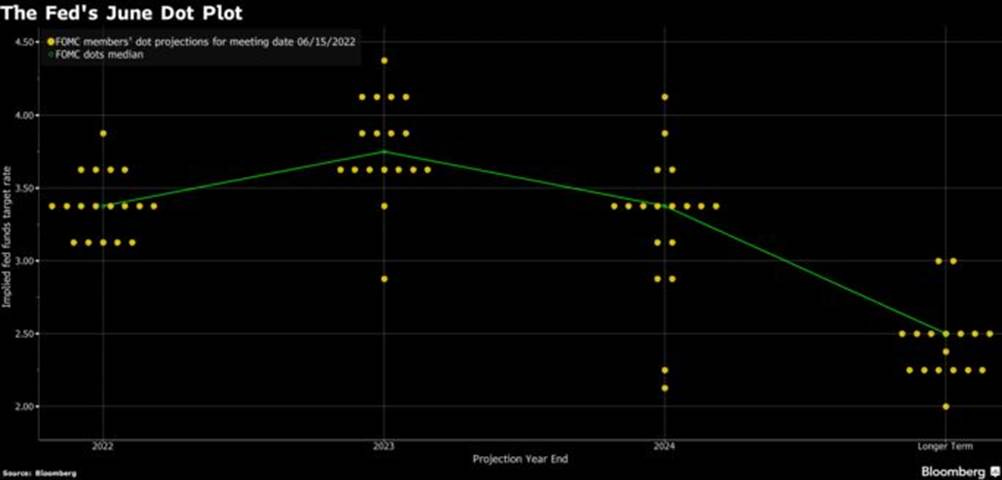
Federal Reserve Bank of Minneapolis President Neel Kashkari, speaking at an event at the Aspen Institute, said he wants to see the Fed Funds rate reach 3.9% by the end of the year and 4.4% by the end of next year. This makes him one of the most hawkish members of the FOMC. Alluding to market pricing of the Fed’s rate trajectory, Kashkari said it was not realistic to conclude that the Fed will start cutting rates early next year when in his opinion, inflation is very likely going to be well in excess of the 2% target. He acknowledged the transition back to a more normal inflationary regime may include a recession in the near future. Stepping back, we are reminded that Kashkari is a politician first and a central banker never, now becoming overly hawkish as inflation is peaking, given it is what the current mood of the public favors.
“In June, in the Summary of Economic Projections… I recommended being at 3.9% by the end of this year, and 4.4% by the end of the following year.”
“This is just the first hint that maybe inflation is starting to move in the right direction, but it doesn’t change my path.”
“I think a much more likely scenario is we will raise rates to some point, and then we will sit there until we get convinced that inflation is well on its way back down to 2% before I would think about easing back on interest rates.”
Chicago Fed President Charles Evans took part in a moderated Q&A on the economy and Fed policy at Drake University last week. Evans said he expects rates to reach 3.25%-3.5% by year-end and the ultimate terminal level to reach 3.75%-4% by early next year. On the optimistic side, Evans said he sees the core PCE falling to close to a 2.5% rate towards the end of 2023. He highlighted his belief that growth would return to “trend,” a more sustainable labor input and productivity induced level, somewhere around 1.5% to 2%. The interview covers a lot of ground but reveals nothing new, given how much we hear from Evans. He is still among the more dovish members, especially given his belief that inflation will fall quickly into year-end next year.
Technicals and Charts:
Four Key Macro House Charts:
Growth/Value Ratio: Value is higher on the day but flat on the week. Large-Cap Value is the best performing size/factor on the day.
Chinese Iron Ore Future Price: Iron Ore futures are lower on the day and on the week. Energy shortages due to droughts are negatively impacting steel production and hence iron ore prices even with growing expectations for further fixed asset investment orientated and property sector support stimulus to be announced.
5yr-30yr Treasury Spread: The curve is flatter on the day and the week as better than expected data and lower inflation reads lately have stagflationary fears diminished, but traders are awaiting the July FOMC minutes later today.
EUR/JPY FX Cross: The Euro is stronger on the day and the week. Japan’s current account continues to worsen due to increased energy import costs, while the BoJ has not changed its tune despite rising levels of inflation.
Other Charts:
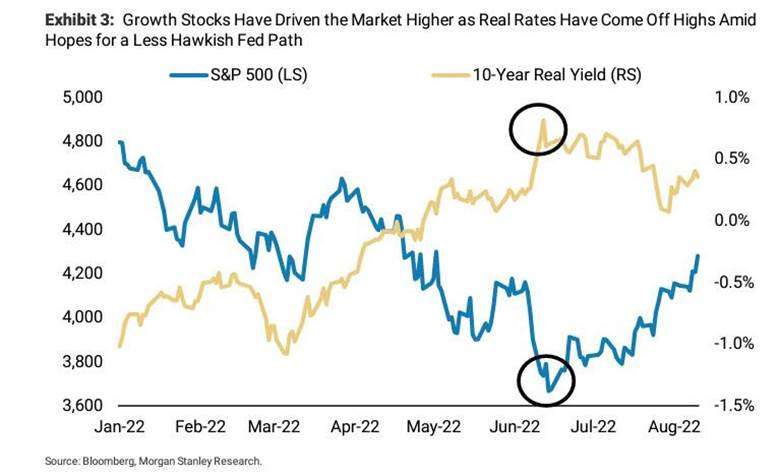
Stocks, especially more duration-sensitive sectors/factors, have been helped by falling real yields, but with that reversing and real yields rising again, is the current rally in trouble?
The spike in % of S&P members above their 50-day moving average is reminiscent of the March 2020 post-covid outbreak rally and at these levels usually indicates a correction is coming.
Sentiment has also improved, and the CNN Fear & Greed Gauge has moved notably higher but now seems too high given the underlying (still negative) macro fundamentals.
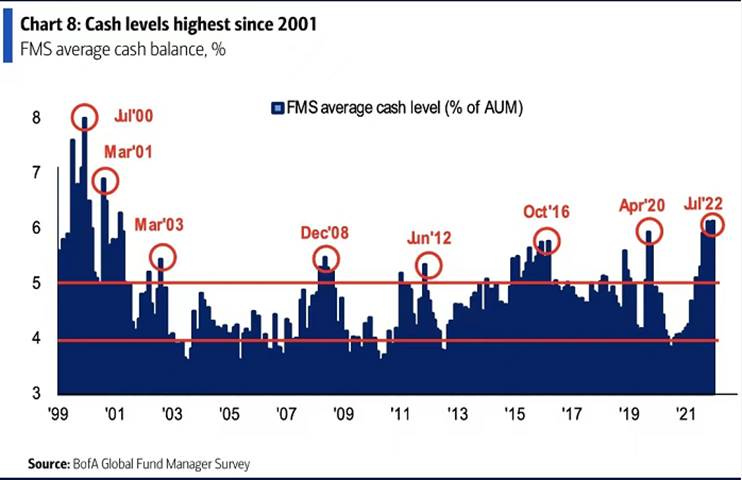
Cash levels are at their highest levels since 2001, although it is down from June highs with the recent rally luring some investors back into the market. This leads us to believe that there may be a Q4 rally (after the current one cools) if inflation continues to fall.
Corporate insiders have also picked up their buying levels recently, giving legitimacy to the current rally.
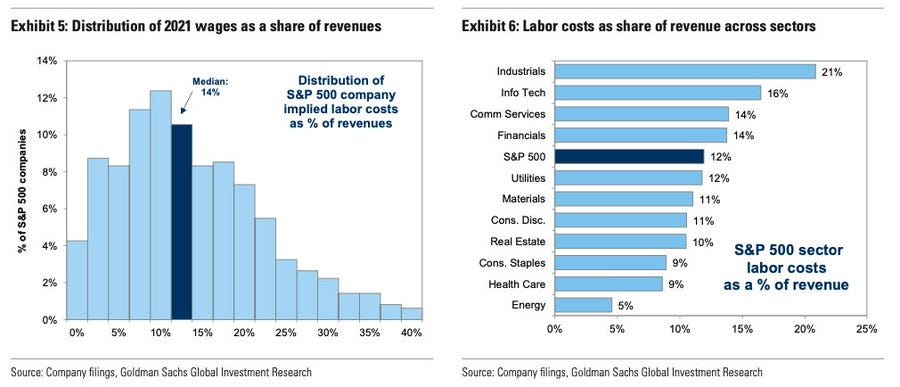
"Labor costs equate to 14% of revenues for the median S&P 500 stock and 12% of revenues for the aggregate index." – Goldman Sachs Research
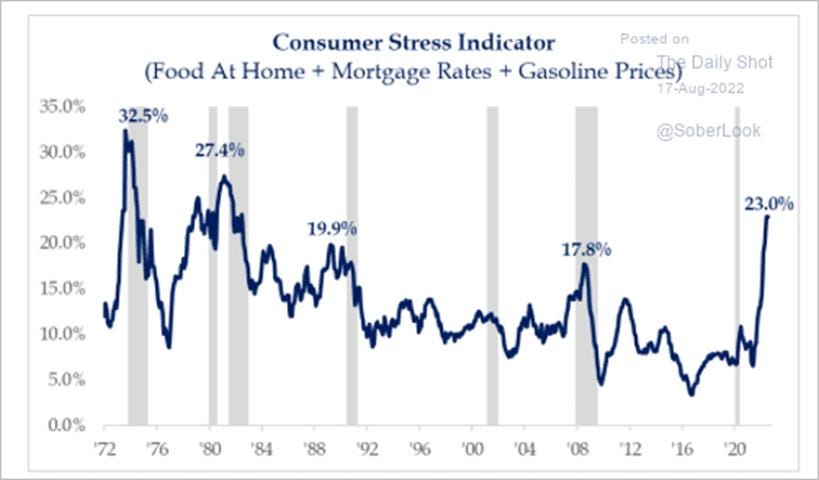
Consumer “stress” is clearly elevated, but given that mortgage rates have stabilized and fuel costs have fallen, is the level of stress going to fall, helping confidence improve into the holiday period?
A lot has been accomplished in D.C. over the last few weeks, and in combination, the CBO expects the combination of Biden’s legislative achievements to be somewhat deficit neutral
Article by Macro Themes:
Medium-term Themes:
Real Supply-Side Situation:
Back on the Boat: Shippers pull back from air cargo as ocean reliability improves – Supply Chain Dive
Air cargo volumes fell by -9% YoY in July, continuing a downward trend as global uncertainties and a shift back to ocean transport weigh on demand, according to a news release from Clive Data Services on Wednesday. Airfreight rates have also dropped, helped by added transatlantic capacity. But they remain elevated versus pre-pandemic levels. January rates were up 156% versus 2019, while July rates were 121% higher than in 2019.
Why it Matters:
Shippers are shifting more volume away from the fast-but-expensive transport mode as ocean freight congestion eases on some lanes. Global schedule reliability improved YoY in June, the first time this has occurred since the pandemic began, per Sea-Intelligence data. “Much of our air freight volume is driven by ocean conversions. We’d expect a bit of slowing there as well through the balance of the year,” C.H. Robinson President and CEO Bob Biesterfeld said on a July 27 earnings call. With more shippers sticking with ocean transport, C.H. Robinson’s international airfreight business saw a -6% YoY drop in metric tons shipped in Q2.
China Macroprudential and Political Loosening:
Stumbled: China Growth Slows Across All Fronts in July, Prompting Unexpected Rate Cut – WSJ
On Monday, the People’s Bank of China cut two key interest rates by 0.1 percentage point and pumped the equivalent of $59.3 billion into the financial system. The unexpected move marked a small step toward more support for China’s economy and may foreshadow further cuts to borrowing costs in the months ahead, some economists said. This followed a raft of data that showed economic activity slowed across the board in July, including factory output, investment, consumer spending, youth employment, and real estate.
Why it Matters:
Economists say Monday’s policy moves would probably do little to spur more borrowing by households and businesses who are on edge over the threat of fresh disruptions to daily life from any new Covid-19 outbreaks and gloomy about their prospects against a worsening backdrop for growth and jobs. Chinese Premier Li Keqiang told business leaders at an event hosted by the World Economic Forum in late July that the government won’t roll out massive stimulus measures or flood the financial system with too much new money, and would instead aim for stable prices and “a relatively good” economic performance, state media reported. Further, Senior Chinese Communist Party officials announced no new fiscal stimulus measures at a meeting late last month and pledged to stick with their zero-tolerance approach to managing Covid outbreaks.
Do More Now: China’s Li Urges More Pro-Growth Policy as Economy Sputters - Bloomberg
China’s Premier Li Keqiang asked local officials from six key provinces that account for about 40% of the country’s economy to bolster pro-growth measures after data for July showed consumption and output grew slower than expectations. Li told officials at a meeting to take the lead in helping boost consumption and offer more fiscal support via government bond issuance for investments. He also vowed to “reasonably” step up policy support to stabilize employment, prices and ensure economic growth.
Why it Matters:
Li urged local governments to accelerate the construction of projects with sound fundamentals in the third quarter to drive investment, the report said, and also asked officials to expand domestic consumption of big-ticket items such as automobiles and support housing demand. Based on the government budget, local authorities may be able to issue an estimated 1.5 trillion yuan ($221 billion) of extra debt and bonds this year to support infrastructure spending, after top leaders urged better use of the existing debt ceiling limit in a key July Politburo meeting. The arrangement could be approved in August, according to some analysts.
Longer-term Themes:
National Security Assets in a Multipolar World:
Nefarious: U.S. to Limit Exports of Some Chip Tech to Cut ‘Nefarious’ Use - Bloomberg
The US is imposing export controls on technologies that support the production of advanced semiconductors and turbines, protecting against their “nefarious” military and commercial use. The innovations “are essential to the national security” of the U.S. and meet the criteria for protection, the Department of Commerce’s Bureau of Industry and Security said in a statement Friday.
Why it Matters:
The move comes as the U.S. seeks to hinder the ability of China, which it sees as a strategic competitor, to develop advanced chipmaking technologies. “We are protecting the four technologies identified in today’s rule from nefarious end use by applying controls through a multilateral regime,” Thea Rozman Kendler, assistant secretary of commerce for export administration, said in the statement.
Electrification and Digitalization Policy:
Three-Tiered: US Fed Opens Pathway for Crypto Banks to Tap Central Banking System - CoinDesk
The U.S. Federal Reserve said Monday it is publishing its final guidance for novel financial institutions to access its "master accounts," something these firms need to participate in the global payment system. Monday's announcement would seemingly move the U.S. central bank one step closer to possibly allowing Wyoming special purpose depository institutions (SPDI), like Custodia (formerly Avanti) and Kraken Bank, access to these accounts so they would not need intermediary banks. The Fed first proposed guidance last year, opening up a request-for-comment process. Nearly 300 respondents filed comments, leading to a second public feedback process earlier this year.
Why it Matters:
The guidance is largely similar to what was first proposed in 2021 and will create a multi-tiered system allowing the Fed to adapt its evaluation process for granting access depending on what kind of financial institution is applying. Each tier corresponds to a respectively more stringent review process. Under the guidance, Tier 1 banks would be federally insured. Tier 2 banks would not be federally insured but are still "subject to prudential supervision by a federal banking agency." The third tier consists of firms that are "not federally insured and not subject to prudential supervision by a federal banking agency," which would most likely apply to the Wyoming crypto banks.
Stop: U.S. Sanctions Crypto Platform Tornado Cash, Says It Laundered Billions – WSJ
The U.S. Treasury Department imposed sanctions on the Tornado Cash cryptocurrency platform, accusing it of laundering billions of dollars in virtual currency, including $455 million allegedly stolen by North Korean hackers. The Treasury Department said Tornado Cash had failed to impose effective controls to stop its users from laundering funds for malicious cyber actors. The Treasury Department said the platform laundered more than $7 billion in cryptocurrency since 2019, but private sector analysts said that figure conflated illicit funds and legitimate transactions.
Why it Matters:
Monday’s action against Tornado Cash, a so-called mixer platform that enables users to exchange cryptocurrencies with relative anonymity, is another salvo by the Biden administration against the burgeoning blockchain financial markets. Regulators, lawmakers, and law-enforcement officials say that some cryptocurrency platforms afford users anonymity that enables them to launder criminal proceeds, finance terrorism, or engage in public corruption.
Commodity Super Cycle Green.0:
Indigenous: The Place With the Most Lithium Is Blowing the Electric-Car Revolution – WSJ
Chinese company BYD won a government contract to mine lithium, but indigenous residents took to the streets, demanding the tender be canceled over concerns about the impact on local water supplies. In June, the Chilean Supreme Court threw out the award, saying the government failed to consult with indigenous people first. Similar setbacks are occurring around the so-called Lithium Triangle, which overlaps parts of Chile, Bolivia, and Argentina. Production has suffered at the hands of leftist governments angling for greater control over the mineral and a bigger share of profits, as well as from environmental concerns and greater activism by local Andean communities who fear being left out while outsiders get rich.
Why it Matters:
In Chile, where lithium is already tightly controlled, President Gabriel Boric’s new leftist government plans to create a state lithium company after criticizing past privatizations of raw commodities as a mistake. A new constitution, if approved in a September referendum, would strengthen environmental rules and indigenous rights over mining. In Bolivia, the government nationalized its lithium industry years ago and has yet to produce meaningful amounts of the metal. Mexico, a smaller player, also recently nationalized lithium. In Argentina, the output is only starting to take off. The bottom line is the supply of lithium out of South America will be highly problematic.
ESG Monetary and Fiscal Policy Expansion:
What is in a Name: ESG Funds Face SEC Probe Over Ceding Votes on Social Issues - Bloomberg
For the past several months, Securities and Exchange Commission enforcement lawyers have been peppering firms offering ESG funds with queries, including how they lend out their shares and whether they recall them before corporate elections, according to four people with knowledge of the matter. The practice lets asset managers earn fees that benefit investors, but it can also impact the ability to cast ballots. Exchange-traded funds and mutual funds billed as sustainably managed $2.5 trillion globally as of the end of June, according to data from research firm Morningstar Inc.
Why it Matters:
For ESG fund managers, the practice of short-selling can raise specific challenges. Short-term bets against companies could make it harder for an ESG fund manager to influence a portfolio company to become more sustainable over a longer period. It also creates the awkward appearance of aiding investors who are betting against the companies that the fund has deemed worthy investments. Furthermore, supporters of the practice say money managers can recall shares if they want to vote on shareholder resolutions to exercise their influence and power over an ESG-related issue facing a company.
Appendix:
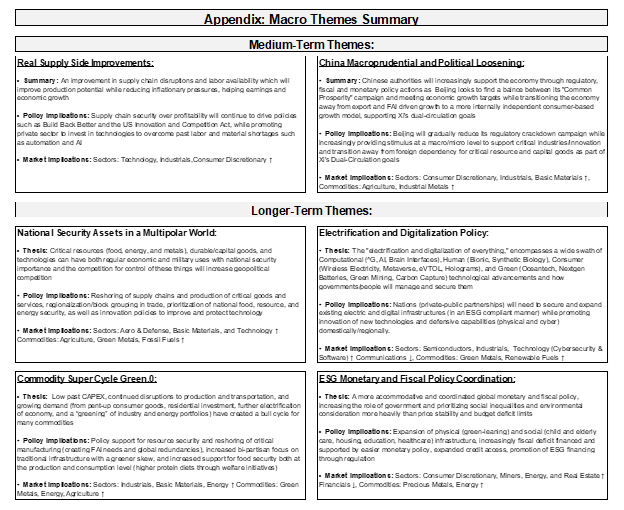
Current Macro Theme Summaries:
VIEWS EXPRESSED IN "CONTENT" ON THIS WEBSITE OR POSTED IN SOCIAL MEDIA AND OTHER PLATFORMS (COLLECTIVELY, "CONTENT DISTRIBUTION OUTLETS") ARE MY OWN. THE POSTS ARE NOT DIRECTED TO ANY INVESTORS OR POTENTIAL INVESTORS, AND DO NOT CONSTITUTE AN OFFER TO SELL -- OR A SOLICITATION OF AN OFFER TO BUY -- ANY SECURITIES, AND MAY NOT BE USED OR RELIED UPON IN EVALUATING THE MERITS OF ANY INVESTMENT.
THE CONTENT SHOULD NOT BE CONSTRUED AS OR RELIED UPON IN ANY MANNER AS INVESTMENT, LEGAL, TAX, OR OTHER ADVICE. YOU SHOULD CONSULT YOUR OWN ADVISERS AS TO LEGAL, BUSINESS, TAX, AND OTHER RELATED MATTERS CONCERNING ANY INVESTMENT. ANY PROJECTIONS, ESTIMATES, FORECASTS, TARGETS, PROSPECTS AND/OR OPINIONS EXPRESSED IN THESE MATERIALS ARE SUBJECT TO CHANGE WITHOUT NOTICE AND MAY DIFFER OR BE CONTRARY TO OPINIONS EXPRESSED BY OTHERS. ANY CHARTS PROVIDED HERE ARE FOR INFORMATIONAL PURPOSES ONLY, AND SHOULD NOT BE RELIED UPON WHEN MAKING ANY INVESTMENT DECISION. CERTAIN INFORMATION CONTAINED IN HERE HAS BEEN OBTAINED FROM THIRD-PARTY SOURCES. WHILE TAKEN FROM SOURCES BELIEVED TO BE RELIABLE, I HAVE NOT INDEPENDENTLY VERIFIED SUCH INFORMATION AND MAKES NO REPRESENTATIONS ABOUT THE ENDURING ACCURACY OF THE INFORMATION


