


MIDDAY MACRO - 8/13/2021
Daily Color on Markets, Policy, and Geo-Politics

MIDDAY MACRO - DAILY COLOR – 8/13/2021
OVERNIGHT/MORNING RECAP & MARKET ANALYSIS
Narratives/Price Action:
Equities are mixed, in a continuation of price action from yesterday, with Nasdaq outperforming the Russell
Treasuries are higher, getting a bid post-NY-open and helped by a significant miss in consumer confidence data
WTI is lower, as IEA and OPEC+ cut future demand expectations due to Delta’s impact
Analysis:
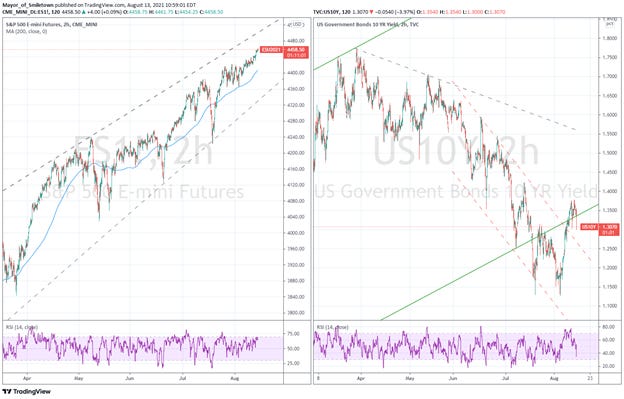
Equities are trading more defensively for a second day even as more record highs are made for the S&P and Treasuries got a NY-open bid, further helped by a sizeable drop in consumer sentiment.
The Nasdaq is outperforming the S&P and Russell with Low Volatility and Growth factors, and Consumer Staples, Utilities, and Health Care, sectors are all outperforming.
S&P optionality strike levels have zero gamma level at 4418 while the call wall is 4500; technical levels have support at 4420, and resistance is 4460, followed by 4490.
Treasuries successfully absorbed this week's supply and rallied through CPI and PPI data, with the long-end outperforming and the curve steepening today, showing Delta growth fears are driving trader sentiment currently.
The grind higher in equities is a testament to the high level of stimulus/liquidity in the system given the continuation of supply-side disruptions (maintaining inflationary pressures) as well as the increasing decline in consumer activity and sentiment due to the uptick in Delta.
Covid hospitalization rates continue to rise, which has correlated more to negative market risk sentiment than actual case counts, given when hospitals are full, lock-downs follow.
Consumer sentiment is dropping, and although sentiment is highly varied between political affiliation, likely also correlating to respondents vaccination status and hence general fear levels, the overall picture is becoming more negative.
One Covid case was enough to shut down 20% of the largest port in China, increasing fears that already delayed inventory restocking trade flows will be late for the holiday season and cost more to ship, capping growth and earnings.
Looking at equity markets, with S&P, Dow, and Nasdaq near all-time highs and Europe up for ten days, there is clearly a TINA (there is no alternative) attitude as dips are bought, and investors continue to believe central banks have their back.
Elsewhere, bad is becoming good, as new lockdowns in Asia increase the likelihood for additional monetary and fiscal stimulus while Europe is only now getting the effects of its late/slowly enacted fiscal response.
Bottom line: Delta has not gotten bad enough (in the West-Coast or North-East), and there is a belief case counts will peak soon while the “bad is good” attitude is becoming more consensus, allowing the index level melt-up to continue, but if things on the ground don’t change soon we will likely get that -5%+ pullback, as global stimulus although historically high, is falling.


Econ Data:
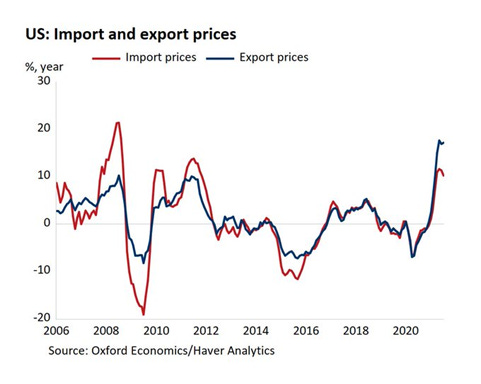
U.S. import prices increased 0.3% in July, less than the 0.6% expected, after advances of 1.1% in June. The July rise is the smallest monthly increase since the index ticked up 0.1% in November. Excluding fuels, prices were flat on the month, and the year-over-year increase for Ex-fuels fell to 6.3% from 6.5%. Interestingly the price of imported capital goods rose 0.4% for the second straight month boosting the year-over-year increase to 2.0%, the fastest increase since July 2008. The price of imported autos and parts also rose 0.4% in the month and 1.9% over the last year. Export prices increased to 1.3%, with the year-over-year increase advancing to 17.2% from 16.9%.
Why it Matters: After yesterday’s PPI beat, which increased our expectations for CPI to stay stickier, it is nice to see price pressure come down somewhere. Two quick points to highlight. The persistence of increases in capital good prices supports the case that firms are slowly investing in themselves despite the anecdotal chorus on financial media saying otherwise. Stepping back, it makes sense that the continuation of labor disruptions would incentivize firms to seek production increases through capital investments, improving the productivity of their existing labor force in the face of strong demand. Second, the ability of U.S. exporters to pass cost increases is a positive for earnings, generally speaking. With most of the gains in July’s increase coming from non-agricultural exports and finished goods, it shows a broad sectorial ability to increase prices and defend margins.

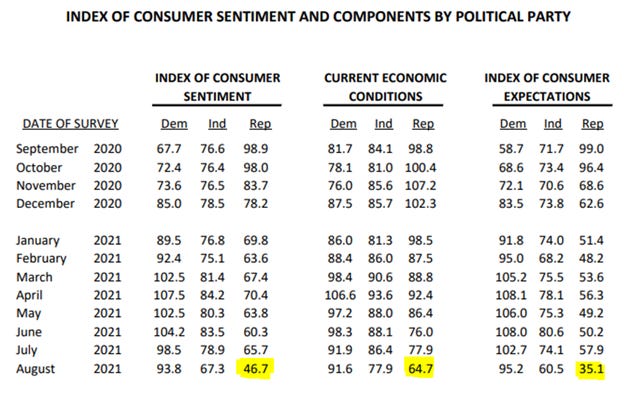
The Consumer Sentiment Index fell to 70.2 in early August from 81.2 in July, a -13.5% change. Over the past half-century, the Sentiment Index has only recorded more significant losses in six other surveys, all connected to sudden negative changes in the economy. The losses in early August were widespread across income, age, and education subgroups and observed across all regions. Moreover, the losses covered all aspects of the economy, from personal finances to economic prospects, including inflation and unemployment. However, it is worth noting that there is now a political affiliation addendum in the report, and not surprisingly, Republican Party-affiliated respondents are responsible for the majority of the drops seen in sentiment, current conditions, and expectations.
Why it Matters: The resurgence of the pandemic due to the Delta variant has been met with a mixture of reason and emotion. Consumers have reasoned that the economy's performance will be diminished over the next several months, and the surge in negative economic assessments reflects an emotional response, mainly from dashed hopes that the pandemic would soon end. This negative response will likely reverse quickly if case counts peak in the coming weeks and optimism for the re-opening improves into the holiday period. However, this is not a given, and more nuanced is the increased deterioration in consumer buying conditions. This sentiment is not in line with what we see in durable goods, retail data, and housing activity. Still, it needs to be acknowledged as a potential early indicator the consumer is pulling back due to increasing prices. Finally, one small positive in the report was that inflation expectations were little changed.

TECHNICALS / CHARTS
FOUR KEY MACRO HOUSE CHARTS:
Growth/Value Ratio: Value is outperforming on the week even after the second day of underperformance

Chinese Iron Ore Future Price: Futures continue to be under pressure as the degree of production cuts are still unclear with Beijing has committed to clear skies for next year’s Olympic Games

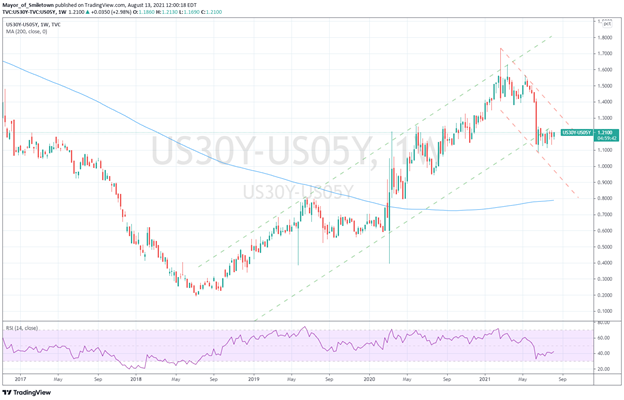
5yr-30yr Treasury Spread: The curve is steeper on the week even after a notable long-end rally following the big miss in consumer sentiment today
EUR/JPY FX Cross: Yen is slightly higher on the week; however,the cross is generally little changed

HOUSE THEMES / ARTICLES
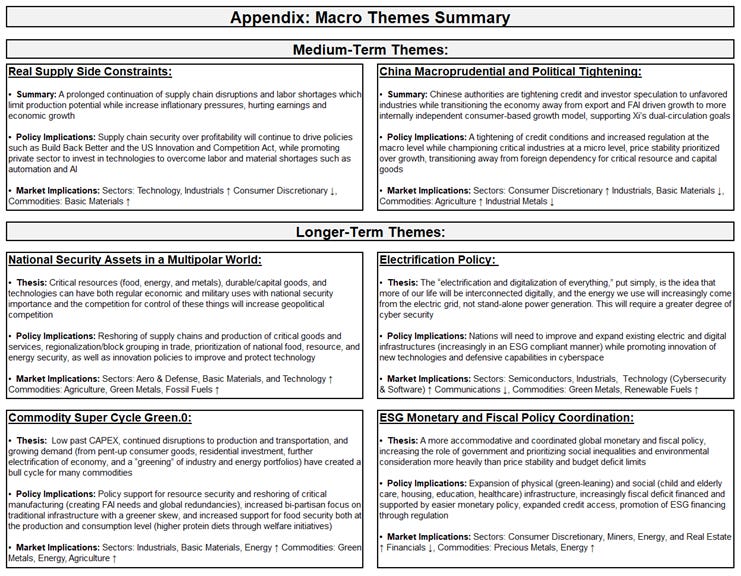
MEDIUM-TERM THEMES:
Real Supply Side Constraints:
Gateway Update: All eyes on Ningbo as global supply chains await news of terminal’s re-opening – Splash247
The Meishan terminal suspended operations on Wednesday after a double jabbed 34-year-old worker came down with the delta variant of Covid-19. Ningbo, lying to the south of Shanghai, is by some distance the world’s largest port in overall tonnage terms and ranks third in the world for container throughput, with Meishan accounting for roughly one-fifth of the activity throughput of the port.
Why it Matters:
Nerijus Poskus, vice president of the global ocean at logistics platform Flexport, commented: “We don’t know how long this closure will last, but with average wait times currently at two to four days, expect to add another day onto your dwell time for every day Ningbo Meishan terminal is closed. For any cargo already going through that terminal, it’s not a question of if it will be impacted but for how long.” Lars Jensen, CEO of Danish liner consultancy Vespucci Maritime, told Splash the Ningbo outage could cause operational disruptions larger than those already experienced in 2021

China Macroprudential and Political Tightening:
Unbalanced and Inadequate: Why Xi Jinping Waited Years to Launch His Crackdown on Tycoons - Bloomberg
Leading China watchers point to a range of factors driving Xi’s current crackdown. But two, in particular, stand out in explaining why this is happening now rather than five or ten years ago: The push for self-reliance as ideological divisions with the U.S. become more entrenched, and Xi’s own consolidation of power ahead of a once-in-five-year leadership reshuffle in 2022 at which he’s set to extend his indefinite rule over the country.
Why it Matters:
In a speech last month marking the Communist Party’s 100th anniversary, Xi pledged to stand for the people against powerful interest groups. The move was in part to stave off any criticism the party has been captured by the wealthy. China this year surpassed the U.S. to become the world’s first country with more than 1,000 billionaires, and Premier Li Keqiang shocked citizens when he said about 600 million Chinese people, almost half the population, live on a monthly income of 1,000 yuan ($154). In the end, as we have seen throughout history, leaders primarily use nationalism and corruption crackdowns to protect their interests, not better the world.

Ratings No More: PBOC Suspends Mandatory Ratings for Interbank Market Bond Issuers - Caixin
China’s central bank has suspended almost all credit rating requirements for companies who sell bonds and other debt financing instruments on the interbank market as regulators overhaul the credit rating industry to stamp out problems such as inflated rankings. This will mainly benefit high-quality SOEs, which dominate the onshore corporate bond market, as they will no longer need to pay for ratings.
Why it Matters:
The move is the latest measure by financial regulators to shake up the sector and restore market confidence after a series of scandals and defaults of highly rated bonds exposed deep-rooted problems, including inflated ratings and corruption. Investors have long complained that domestic rating agencies award some companies high rankings they don’t deserve in order to secure clients and have failed to flag risks of default. Sounds familiar to our own experience with rating agencies during the GFC.

LONGER-TERM THEMES:
Electrification Policy:
Round We Go: How Circle could create a U.S.-backed digital currency – Axios
Crypto giant Circle has announced its intention to become a fully regulated bank by the Federal Reserve, the Office of the Comptroller of the Currency, and the FDIC. Circle's dream is to become a “narrow” bank that avoids fractional-reserve banking entirely and instead places all deposits on reserve at the central bank. Buying those stablecoins would be equivalent to having money on deposit directly at the Fed.
Why it Matters:
We're still a very long way from this happening. Still, if it were to become a reality, then Circle would effectively be issuing a cryptocurrency backed by the Fed itself, a central bank digital currency. The Fed doesn't like "narrow" banking as fractional-reserve banking is the engine that powers money creation and even modern capitalism. Full-reserve banking risks messing with that model in a way that could prove dangerous. The bottom line, the CBDC drama continues, but we are far from any actual developments.

Commodity Super Cycle Green.0:
Water Needed: Droughts shrink hydropower, pose risk to the global push to clean energy - Reuters
Severe droughts are drying up rivers and reservoirs vital for the production of zero-emissions hydropower in several countries around the globe, in some cases leading governments to rely more heavily on fossil fuels. Certain areas are experiencing too much water as flooding and debris from megastorms force power stations offline.
Why it Matters:
Droughts or extreme flooding have forced power grid operators to rely more heavily on thermal power plants, often fired by natural gas or coal, and to ask businesses to curtail electricity use to prevent outages, according to Reuters interviews with grid operators and regulators. With severe weather likely to worsen, hydro sourced energy will become increasingly risky, likely limiting further development.

ESG Monetary and Fiscal Policy Expansion:
Redrawing the Lines: US census shows increasing share of non-white groups in wider population – FT
The results of the once-a-decade survey, which will be used to redraw congressional boundaries, “reveal that the US population is much more multiracial and more racially and ethnically diverse than what we measured in the past. The data confirmed earlier estimates of a decline in the US white population, from 223.6m in 2010 to 204.3m in 2020, an 8.6% decrease. People who identified as Hispanic or Latino, the second-largest group, grew 23% during the decade. In California, the population identifying as Hispanic or Latino became the largest group for the first time.
Why it Matters:
Overall population tallies released in April showed the growing influence of sunbelt states, which have gained seats in the US House of Representatives because of their population growth, largely benefiting Republicans. Fifty-two percent of all counties had smaller populations in 2020 than in 2010, with the declines concentrated in the smallest-sized counties, while growth was concentrated mainly in metro areas, notably in the south and west, such as the outer counties of Atlanta, Dallas-Fort Worth, and Minneapolis-St Paul. We pause to think this is too positive for the GOP, even as their traditional “areas” gained seats given the growth in urban areas and the limits gerrymandering districts have.

VIEWS EXPRESSED IN "CONTENT" ON THIS WEBSITE OR POSTED IN SOCIAL MEDIA AND OTHER PLATFORMS (COLLECTIVELY, "CONTENT DISTRIBUTION OUTLETS") ARE MY OWN. THE POSTS ARE NOT DIRECTED TO ANY INVESTORS OR POTENTIAL INVESTORS, AND DO NOT CONSTITUTE AN OFFER TO SELL -- OR A SOLICITATION OF AN OFFER TO BUY -- ANY SECURITIES, AND MAY NOT BE USED OR RELIED UPON IN EVALUATING THE MERITS OF ANY INVESTMENT.
THE CONTENT SHOULD NOT BE CONSTRUED AS OR RELIED UPON IN ANY MANNER AS INVESTMENT, LEGAL, TAX, OR OTHER ADVICE. YOU SHOULD CONSULT YOUR OWN ADVISERS AS TO LEGAL, BUSINESS, TAX, AND OTHER RELATED MATTERS CONCERNING ANY INVESTMENT. ANY PROJECTIONS, ESTIMATES, FORECASTS, TARGETS, PROSPECTS AND/OR OPINIONS EXPRESSED IN THESE MATERIALS ARE SUBJECT TO CHANGE WITHOUT NOTICE AND MAY DIFFER OR BE CONTRARY TO OPINIONS EXPRESSED BY OTHERS. ANY CHARTS PROVIDED HERE ARE FOR INFORMATIONAL PURPOSES ONLY, AND SHOULD NOT BE RELIED UPON WHEN MAKING ANY INVESTMENT DECISION. CERTAIN INFORMATION CONTAINED IN HERE HAS BEEN OBTAINED FROM THIRD-PARTY SOURCES. WHILE TAKEN FROM SOURCES BELIEVED TO BE RELIABLE, I HAVE NOT INDEPENDENTLY VERIFIED SUCH INFORMATION AND MAKES NO REPRESENTATIONS ABOUT THE ENDURING ACCURACY OF THE INFORMATION OR ITS APPROPRIATENESS FOR A GIVEN SITUATION.