Midday Macro – 7/6/2022
Market Recap:
Price Action and Headlines:
Equities are higher, with tech/growth outperforming alongside more defensive sectors while the Russell/small-caps is lagging
Treasuries are lower, with yields across the curve notably higher and the curve flattening as today’s JOLTs data showed the tight labor market continues
WTI is lower, reversing deeper morning losses but still down on the session as higher levels of volatility are becoming more common due to growing recessionary fears
Narrative Analysis:
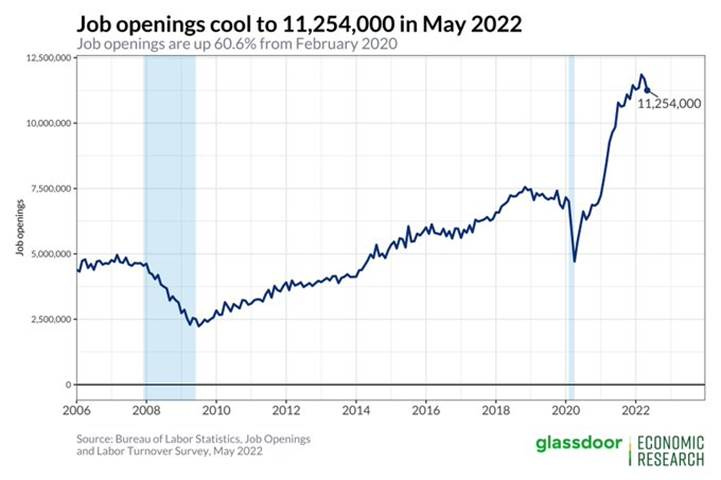
Equities are higher, with the S&P flat and generally consolidating in a 50-point range since yesterday’s close. Traders are now digesting the just-released June FOMC minutes. This morning's economic data was better than expected, with JOLTs showing openings only marginally falling to 11.3 million, a still historically very high level, while the ISM Service PMI report was helped by demand-focused sub-indexes. There was no meaningful reduction in inflationary pressures from either, and as a result, the new data was seen as negative “good” data. Treasuries are under notable pressure after an overnight rally quickly faded in the AM; however, this follows two weeks of gains. WTI oil front-month contracts fell to $95 this morning but have recovered back to around $98; however, the growing belief that the economy is entering a recession has the entire energy complex trending lower generally. This is also being mirrored by other commodities, with aggs and industrial metals off overnight lows but still under pressure and trending lower. Finally, the star of the show lately has been the dollar, with the $DXY now above 107 and the Euro near parity.
The Nasdaq is outperforming the S&P and Russell with Low Volatility, Growth, and Momentum factors, and Utilities, Technology, and Real Estate sectors are outperforming on the day.
@KoyfinCharts
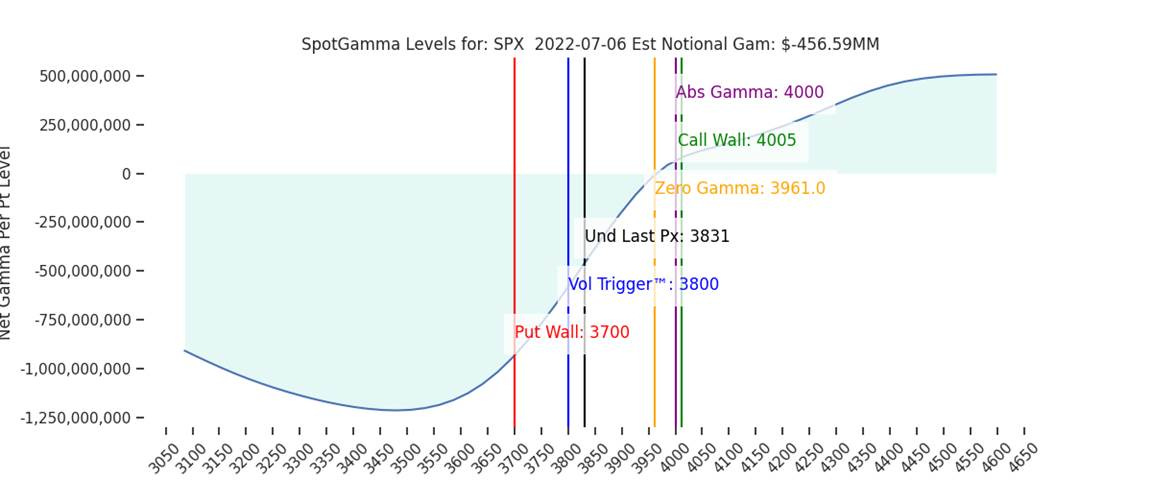
S&P optionality strike levels have the Zero-Gamma Level at 4961 while the Call Wall is 4005. The 3800 level continues to form as an important strike as positions build at that level, making it the Vol Trigger (or gamma flip marker). On the downside, 3700 remains the Put Wall and significant short-term support. Volatility should pick up on a break below 3800, which may lead to a quick test of the 3700 level. Finally, there are large put positions building on the VIX in the 20-25 range with also large call positions in the 30-35 range, implying the 25-30 range is likely to hold into July OPEX.
@spotgamma
S&P technical levels have support at 3810, then 3775, and resistance at 3855, then 3890. There have been a few 100 points swings in the last few days, but we are still at levels seen last Friday. The S&P continues to build a bear flag, with ultimate support at 3755, and failure would likely lead to new lows. Incredibly, the S&P is now down 5 out of the 6 months this year. 5 out of 6 red is *very* rare happening only three times since and during the 2008 recession, all of which followed a green month.
@AdamMancini4
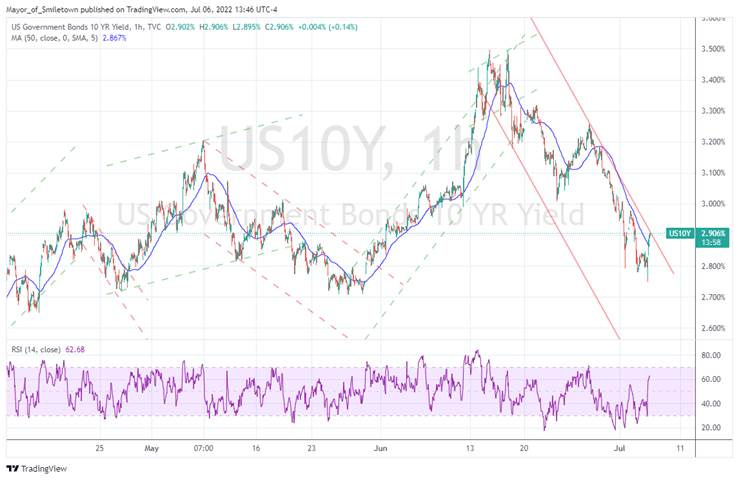
Treasuries are lower, with the 10yr yield at 2.90%, higher by around 9.3 bps on the session, while the 5s30s curve is flatter by -3.1 bps, moving to 19 bps
Deeper Dive:
The dollar’s appreciation over the last week has been impressive and is tightening financial conditions further, doing some heavy lifting for the Fed despite a more “stable” equity market and falling Treasury yields. However, to be clear, volatility, as seen through the MOVE and VIX indexes, as well as widening credit spreads, has shown no material changes and, as a result, continues to keep pressure on financial conditions through those channels. Stepping back this appreciation of the currency channel further reduces the need for the Fed to follow through with actual rate hikes, especially to a 3.5% - 4% Fed Funds level, as the market is now increasingly focused on rate cuts in the second half of next year (but still has the high around 3.5% around year-end). This is because inflation looks to have peaked, as seen by price decreases in commodity markets, increased expectations for price cuts to durable goods, and worries for service sector demand. Despite a policy reversal now expected, we are still far from out of the woods. Instead, we are in the latter part of the middle innings and now have to see what actual demand destruction occurs (as reflected in Q2 earnings forecasts and eventual Q3 & Q4 earning results) in this year's second half. As a result, we are making a minor change to the mock portfolio but still advocate caution and patience as we enter an even more range-bound, choppy environment (where inflation remains the policy maker's focus despite growing recession fears/focus by markets).
As we often highlight, it's all about targeting/changing financial conditions when it comes to Fed policy these days. By using forward guidance to signal coming actual policy tightening moves (rate hikes and QT) and, in today’s case, convincing markets you want to orchestrate a recession to bring inflation back down to target, the Fed is already closer to the end of its policy tightening cycle than many may think. This is due to how fast markets react, with financing rates rising quickly and consumers altering behavior due to the negative wealth effect they now feel. Of course, higher inflation is also acting as a significant tax on discretionary consumption due to reduced real disposable income, but when coupled with the above-mentioned, it is a perfect storm to reduce end-consumer demand, and the Fed knows it. As a result, due to a growing belief that inflation has peaked and our own view it will fall faster than expected, the Fed is likely only several meetings away from being able to pivot to a more neutral stance from the notably hawkish one they now convey.
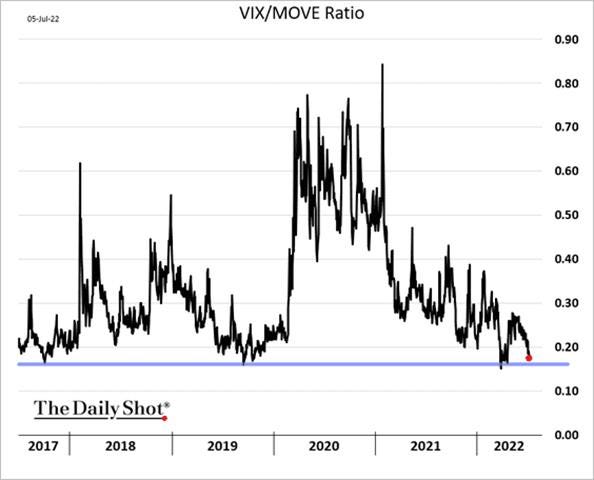
*The MOVE index is indicating higher levels of implied rate volatility verse the VIX, which has become more range-bound as vol skew has come off highs due to a lower need for downside protection. S&P put volumes have fallen about 35% since the middle of June to more normal levels
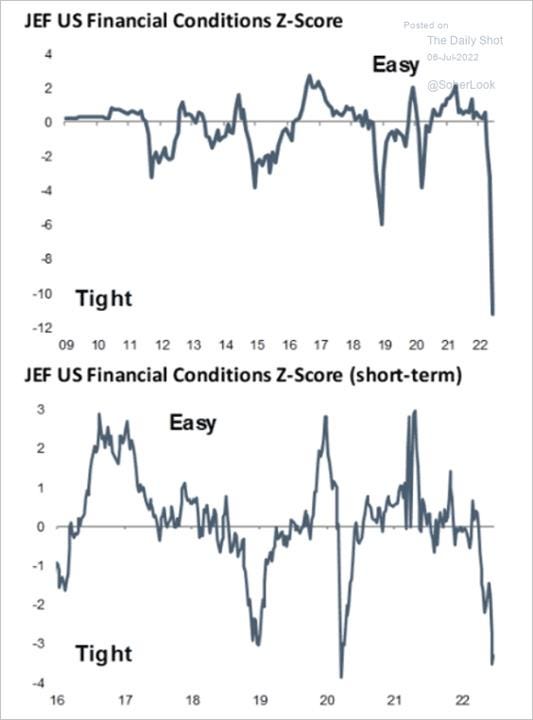
*There are various ways to construct and interpret financial condition indexes, with Jefferies standardizing theirs and showing that we have had a significant amount of tightening that is now on par with what occurred during the early months of the pandemic or worse
*On top of higher levels of volatility, which combined with wider credit spreads and a stronger dollar are driving financial conditions tighter, the rise in real rates has also correlated well with equity weakness. With inflation falling and nominals likely range-bound, will real rates rise further?
Why do we say several meetings and not a year for the Fed to potentially pivot, as many believe based on the Fed’s own projections? Because, as we said, things are happening faster than expected. With recession fears overtaking inflation fears, markets are repricing and doing so rather quickly. This is clearly seen in the rates market with the ten-year Treasury yield, although rising today, well off the 3.5% yield highs seen in the middle of June. Changes in Fed Funds futures and TIP breakeven rates are also confirming this. Commodity markets are also clearly supporting this change in narrative, with oil, gasoline, and natural gas futures falling notably despite only a marginal improvement in supply dynamics (for distillates and NG). At the same time, industrial metals, copper specifically, signal a significant drop in future demand is coming. Now we disagree with this, given our views on longer-term supply/demand imbalances in energy and certain industrial metals such as copper, as well as our view that demand is slowing (and likely to increase in China) but not falling off a cliff as price action is increasingly suggesting. However, the change in narrative is pronounced, occurring quickly, and needs to be respected not only from a risk management perspective but due to the effects it will have on the Fed’s policy path moving forward.
*The drawdown in inventories for diesel and gasoline is starting to diminish, and the trend back to a more historically normal level looks to be underway as higher prices have reduced seasonal demand somewhat while refineries continue to operate near max capacity
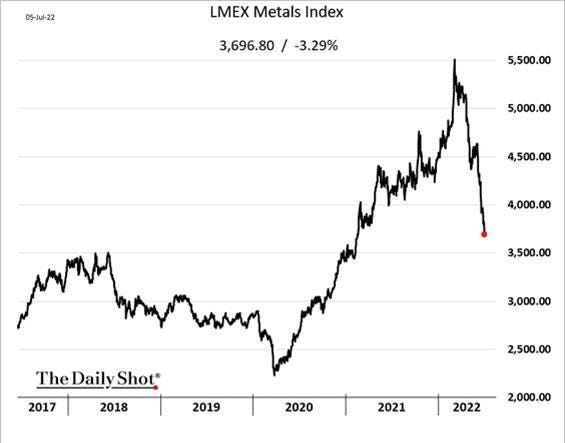
*Industrial metals have fallen sharply as demand expectations continue to fall due to recessionary fears and China’s outlook clouded by its zero-Covid policy
As a result of the increased likelihood that inflation has peaked and will fall faster than expected while financial conditions continue to tighten, reducing already falling end demand further, the Fed is going to need to shift gears to a more neutral/accommodative stance sooner than they are currently telegraphing, but markets are increasingly expecting. As stated above, we still need a clearer picture of how weak earnings growth will be in the second half of this year, but as often stated, markets price forward, and if the 2023 picture is one of a more supportive policy backdrop, then multiple expansion can occur again, reducing the drag that weaker earnings should have and changing leadership back to growth over value and cyclicals over defensives (something we may be starting to see already). We are not there yet but want to highlight it as our expected path to normalization, a world closer to a 2% inflation and Fed funds rate by the year-end of 2023.
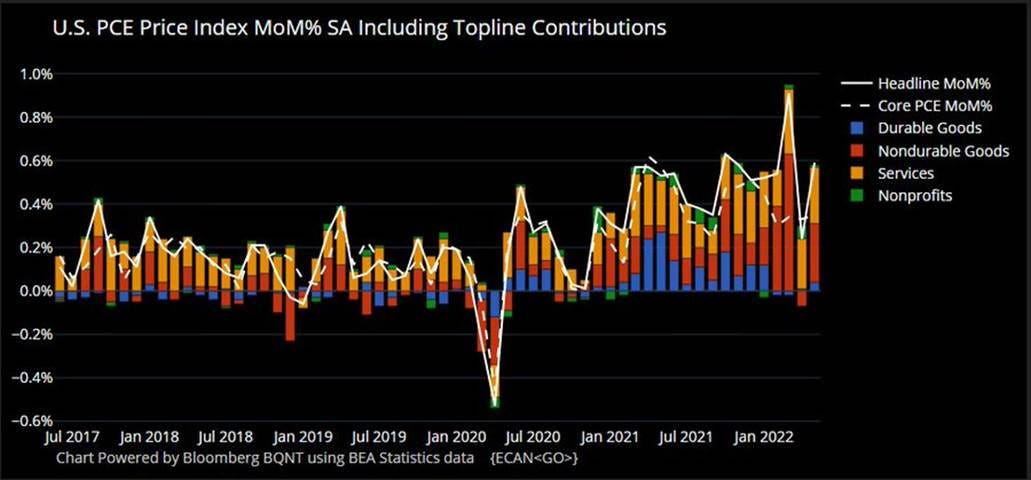
*What goes up fast can also fall fast as the cure for higher prices are higher prices with the COre PCE, the Fed’s primary gauge for inflation starting to roll over
Turning to the mock portfolio, we hit our target for our $DBA Invesco DB Agriculture Fund short and are taking profit there. Due to the fast price action, we never fully put forth our reasons for the short position, but a combination of looking for a tactical reversal in overbought conditions (brought on by the invasion of Ukraine) and expectations for improved growing conditions (globally) materialized. We see this gain as partially lucky due to the weather cooperating, partially technical (highly overbought RSI indicator), and partially fundamentally driven (we were less worried about shortages out of Eastern Europe). However, gains here have not offset the losses we are suffering in our copper long, which is now the largest losing position in the portfolio's history. We have lowered our stop one last time given the extremely oversold signal we are seeing and the belief that demand, particularly in China, is not as bad as feared, while the longer-term supply/demand fundamentals are still supportive. It's our intent to explore this further in future writings. This leaves the portfolio down over -5% and 50% invested.
Finally, we did a presentation on the macro factors we discussed in our “The Good, The Bad, and The Ugly” series here with Giacomo Mondonico, who produces market-focused, mainly individual company analysis focused, videos on his YouTube channel HUSTLE HUB. Although there is currently a lot to discuss, and the devil is in the detail, we covered the major macro factors in around thirty minutes of discussion. The video can be seen HERE. Please give it a watch!
Econ Data:
The number of job openings in the U.S. was 11.3 million in May, down slightly from 11.7 million in April and a peak of 11.9 million in March. Figures came above market expectations of 11 million. The largest decreases in job openings were in professional and business services (-325,000), durable goods manufacturing (-138,000), and nondurable goods manufacturing (-70,000). Meanwhile, some 4.3 million Americans quit their jobs in May, little changed from the prior month, with the so-called quits rate falling to a four-month low of 2.8%, and there were 1.9 job openings for every unemployed person. There was no pickup in layoffs in May with the layoffs rate holding steady at 0.9%.
Why it Matter: Today’s data showed that the ratio of unemployed workers to job openings is holding steady near its record low. The quits rate is also not changing. Despite expectations for hiring to cool further, the JOLTs data continues to indicate a very tight labor market.
*Layoffs & discharges ticked up in May, but remain near record lows. Layoffs didn't increase much in information (+1,000), financial activities (+10,000), and professional & business services (+6,000), all sectors where we've heard prominent stories of layoffs recently.
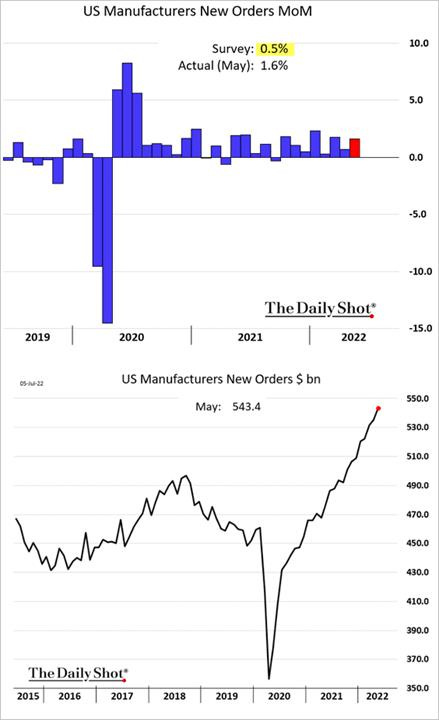
Factory orders rose 1.6% in May, beating expectations of an increase of 0.5%, following a revised higher May durable goods orders of 0.8%. Excluding transport, the rise in new orders was 1.7% MoM, and excluding defense, it was 1.5%. There was a large increase (+2/3%) in Nondurable goods to rises in energy-related products. Shipments increased 1.4%, Unfilled Orders rose 0.4%, while Inventories rose 0.6%.
Why it Matters: The report beat expectations notably given concerns that manufacturing activity is slowing, as seen in last week's ISM Manufacturing PMI reports. However, when looking at the Unfilled Orders details, there looks to be a slowing in activity likely coming as factories work through their backorders, especially in housing-related items such as appliances and furniture. Machinery demand remained stable, rising 1.2% MoM, confirming what is seen in the Fed’s regional surveys, firms continue to invest in themselves even if future intentions to do so are falling.
*Activity remained strong, with not only new orders growing but Shipments, Unfilled Orders, and Inventory levels all rising on the month, showing the hard data has yet to reflect the weakness anticipated by the soft data
The ISM Manufacturing PMI fell to 53 in June from 56.1 in May, below market forecasts of 54.9. Production (54.9 vs. 54.2) increased moderately, while New Orders (49.2 vs. 55.1) contracted for the first time in two years, while the Backlog of Orders (53.2 vs. 58.7) fell notably. Employment (47.3 vs. 49.6) declined further. Supplier Deliveries (57.3 vs. 65.7) slowed while Inventories (56 vs. 55.9) increased slightly faster. Prices (78.5 vs. 82.2) remained elevated but eased slightly. Business sentiment remained optimistic regarding demand, but firms continue to note supply chain and pricing issues as their biggest concerns.
Why it Matters: June Manufacturing PMI report pointed to the slowest growth in factory activity since June of 2020. Companies improved their progress in addressing moderate-term labor shortages and reduced inventory needs. Notable that Employment fell further into negative territory. Firms continue to say they still need skilled labor, but due to falling demand expectations and reduced backlogs of work, having less urgent hiring needs. Price pressures fell but, as seen elsewhere, are still highly elevated.
*Manufacturing activity is slowing fast but still no meaningful decreases in price pressures despite reduced urgency as seen in falling backorder and employment intentions
*Respondent comments were somewhat mixed but there were renewed worries of supply-side impairments and inflationary pressures
The ISM Services PMI fell to 55.3 in June from 55.9 in May, beating the market forecast of 54.3. The slight slowdown was due to softer New Orders (55.6 vs. 57.6) and a fall in Employment (47.4 vs. 50.2) while overall Business Activity rose (56.1 vs. 54.4). Interestingly, there was a large increase in the Backlog of Orders (60.5 vs. 52). Price pressures slightly eased for a second month (80.1 vs. 82.1) but remained highly elevated. Supplier Deliveries (61.9 vs. 61.3) rose and showed logistical pressures worsened, as also conveyed in the respondent comment section. Inventories fell for the first time since January 2022 (47.5 vs. 51) despite the Inventory Sentiment index indicating that firms continued to believe they were too low for current business needs.
Why it Matters: A better than expected report due to a significant increase in the Backlog of Orders and general Business Activity/Production readings. Otherwise, the majority of other sub-indexes were flat to lower. The decline in Employment mirrored what was seen in the ISM Manufacturing PMI report and other regional business surveys, indicating that future jobs reports should be cooling. Overall the message was mixed with a high headline reading due to demand remaining strong while inflationary pressures are not easing, as seen in particular sub-indexes and respondent comments. The outlook remains challenging as "logistical challenges, a restricted labor pool, material shortages, inflation, the coronavirus pandemic, and the war in Ukraine continue to negatively impact the services sector,” according to Anthony Nieves, Chair of the ISM Services Business Survey Committee.
*ISM Service PMI beat expectation thanks to production and demand-oriented sub-indexes remaining strong while there was a worsening in supply-side orientated measures
*Respondent comments noted a worsening in the availability of materials and higher inflationary/cost pressures, while some noted demand remaining strong
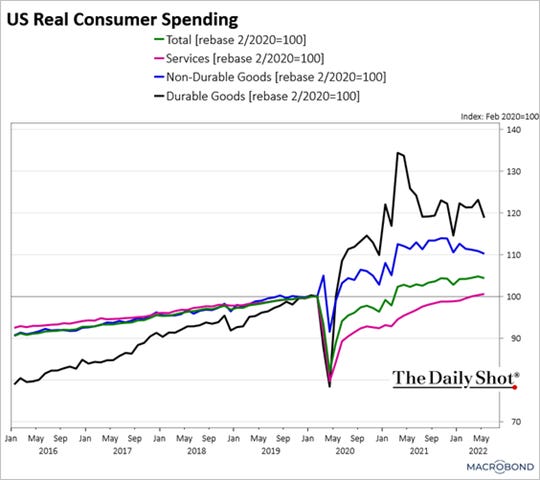
Personal income increased by 0.5% in May, with disposable personal income increasing (DPI) by $96.5 billion or 0.5% and personal consumption expenditures (PCE) rising by $32.7 billion or 0.2%. However, real DPI decreased by -0.1%, and real PCE decreased by -0.4% due to goods decreasing by -1.6% and services increasing by 0.3%.
Why it Matters: Real spending on goods is falling fast while services are still rising as the consumer continues to exhibit a preference for going out and leisure and hospitality. This will likely change as the reopening high fades and the realities of higher costs to “go out” increasingly set in over the summer.
*Total real consumer spending decreased in May, primarily driven by reduced spending on durable goods, although even nondurable spending fell while service-orientated spending continued to rise at a slower rate.
*Inflationary pressures continue to keep real disposable personal income flat, now well below a multi-year trend line
The PCE price index increased 0.6% in May, following a 0.2% increase in April. Excluding food and energy, the Core PCE price index increased 0.3%. The annual headline rate was unchanged at 6.3% after touching a record high of 6.6% in March. Energy prices increased 35.8% (vs. 30.4% in April), while food inflation rose to 11% from 10%. Excluding food and energy, the annual Core PCE rate eased to 4.7% from 4.9%, below forecasts of 4.8%.
Why it Matters: We see some positive signs that the Fed’s go-to measure, Core PCE, is stabilizing, given this was the fourth month in a row of a 0.3% rate rise. Drops in durable goods will likely increase and drive that monthly rate lower, if not negative, in the next month or two despite the persistence of rent rises. Given the price action we have seen in agriculture and energy markets over the last month, the headline rate will be falling in next month's report too. Hence, we have increased conviction that inflation has peaked.
*Core PCE Price Index rose 0.3%, the fourth month in a row, moving the annual increase to 4.7%, and the 3-month annualized average to 3.7%.
*Durables and nondurables will likely be a negative contributor next month, given what we see in other data and market pricing
The Chicago PMI fell to 56 in June from 60.3 in May, below forecasts of 58. It is the lowest reading since August of 2020. New Orders saw the largest decrease this month, dropping 9.8 points to 49.9, the lowest in two years, followed by Order Backlogs which fell 9.4 points to a 19-month low of 55.2. Employment grew 4.6 points to 50.7, the highest since November last year, as firms saw relatively stable employment conditions for the month. Supplier Deliveries edged down 0.2 points to 69.1. Prices Paid eased 9.0 points to 79.6, the lowest reading since February 2021.
Why it Matters: June’s Chicago PMI report showed a decline in all the sub-indicators except for employment. However, the decrease in prices, continued hiring, and stabilization in delivery times showed that supply-side impairments/shortages were improving in the region. Thirteen percent fewer firms saw higher prices in June compared to May. Delivery times remained slow, and lead times lengthened, but the reading was stable, and the report noted that “offshore supply lead times were reported at double that of domestic. However, some materials became substantially more available due to lower demand.” Firms were asked, “with employment costs increasing, are you looking at slowing hiring in the upcoming months?” in this month’s special question. The majority (43.9%) said no, while only 14.6% of respondents said yes. A further 17.1% were looking to slow hiring, and 24.4% were unsure, as growth outlooks remained uncertain.
*New Orders moved below 50 in June’s report, while other sub-indexes other than Employment all decreased too. However, price declines, drops in the backlog of orders, and stable delivery times point to less inflationary pressures
Technicals and Charts:
Four Key Macro House Charts:
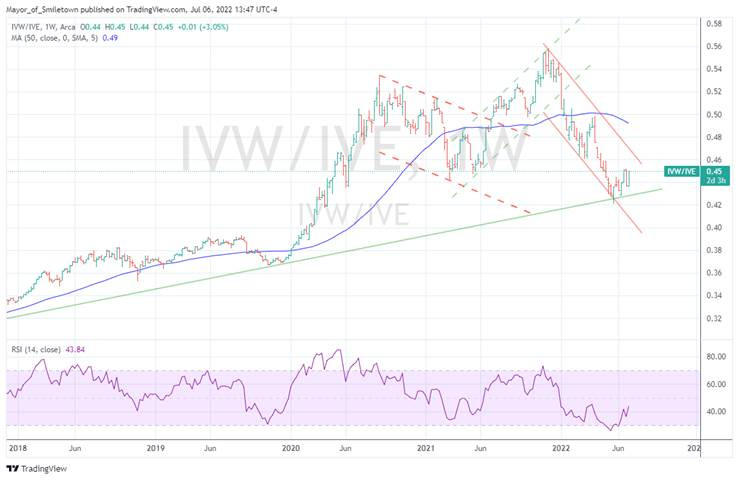
Growth/Value Ratio: Growth is higher on the day and the week. Large-Cap Growth is the best performing size/factor on the day.
Chinese Iron Ore Future Price: Iron Ore futures are lower on the day and the week. China’s land market remained weak in the first half of the year. Land transactions in major cities tumbled by over 50% from a year earlier. This reduces expectations for commercial and residential construction and hence demand for industrial metals.
5yr-30yr Treasury Spread: The curve is flatter on the day, and the week as Treasuries more generally are under pressure today after multi-day rally stalls.
EUR/JPY FX Cross: The Yen is higher on the day and week as the Euro is being hit by higher energy prices and increased recession fears
Other Charts:
With recession fears growing and commodities rolling over, inflationary fears are falling, and ratios between cyclical/defensive and value/growth are basing. “Start to see some balance in the force... Commodities the last domino to fall?” - @DoejiStar
As the year's first half is officially over, it's worth looking at how various countries’ equity markets have performed, with the U.S. being one of the worst among the larger markets.
Market participants continue to want to see a capitulation in the S&P to signal a bottom with the BCA’s capitulation indicator not reaching extreme levels yet
The volatility of the equity volatility index has hit its lowest level since 2019, as demand for calls on the VIX has eased and general option volume continues to fall
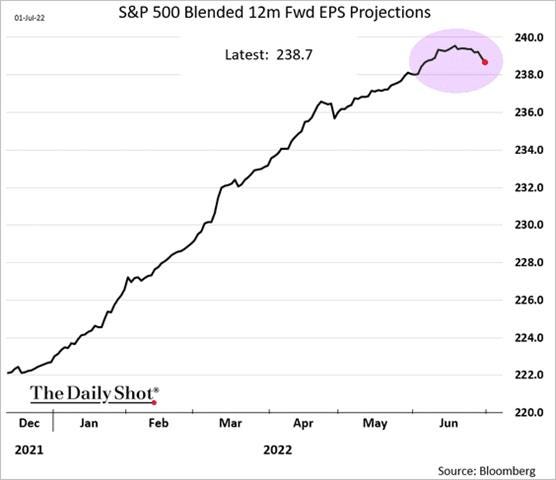
Earning expectations are finally following downgrades to economic growth as equity analysts become more pessimistic on company performances moving forward
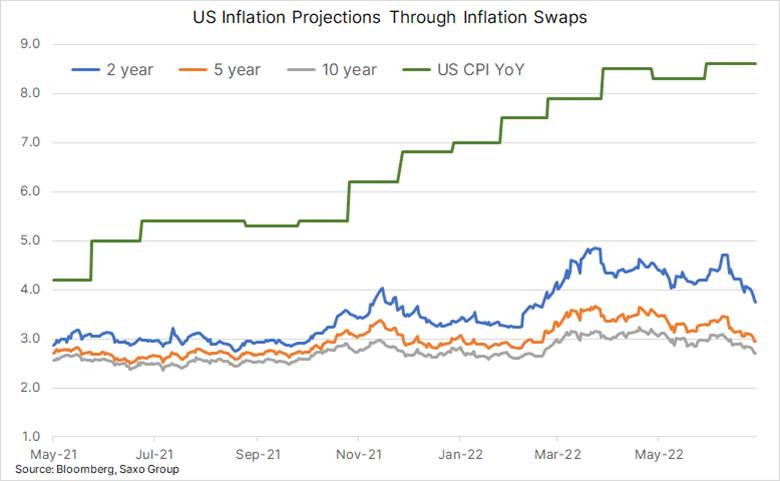
“Swap dealers continue to send inflation expectations sharply lower in response to lower commodity prices and the belief in central banks ability to curb prices. During the past two weeks, the 2-year inflation swap has slumped by one percent to 3.7%, a four-month low.” - @Ole_S_Hansen , Head of Commodity Strategy @SaxoBank
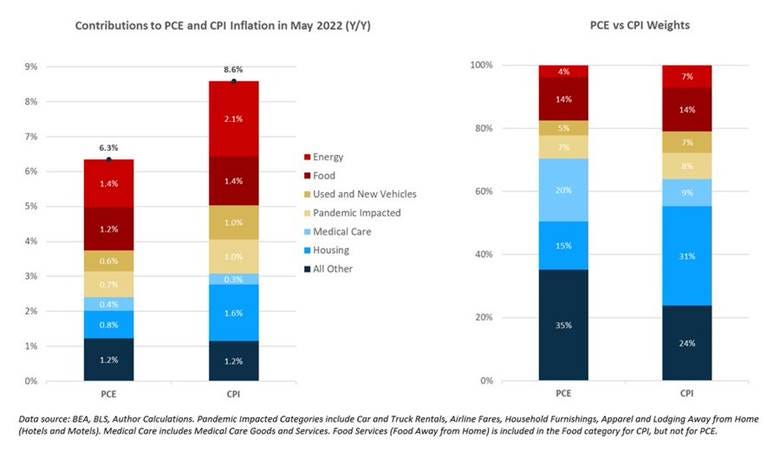
There are big differences between CPI and PCE inflation measures currently due to different weightings of inputs. This is worth keeping as shelter costs (due to rents) continue to rise, causing CPI to come in hotter than PCE.
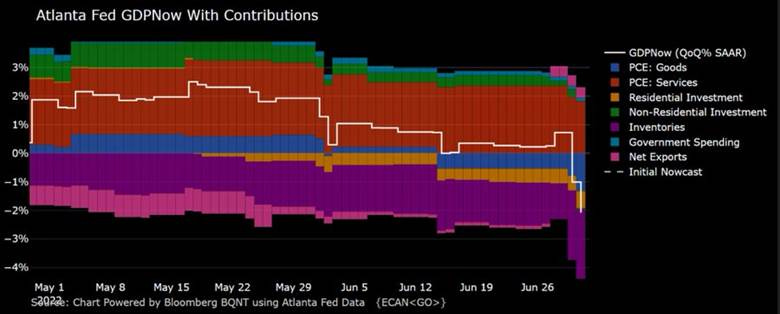
The Atlanta Fed’s Q2 GDPNow forecast is falling fast, now sitting below -2%, and if accurate would indicate we are in a technical recession currently.
Evercore ISI Retailer survey is showing a significant drop in reported pricing power, indicating consumers are finally pushing back on price increases.
"Against a backdrop of intensifying inflation, rising interest rates, and increased economic uncertainty, CRE activity already looks to be moderating. Property transaction volumes and price appreciation have both moderated." – Wells Fargo Research
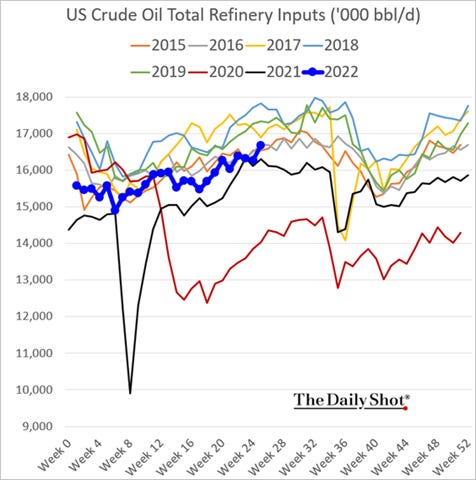
Refinery inputs have been improving and are now back at a more historically normal level for this time of year.
As a result of refineries working at high capacity levels, the total U.S. gasoline inventory/stock is starting to rise
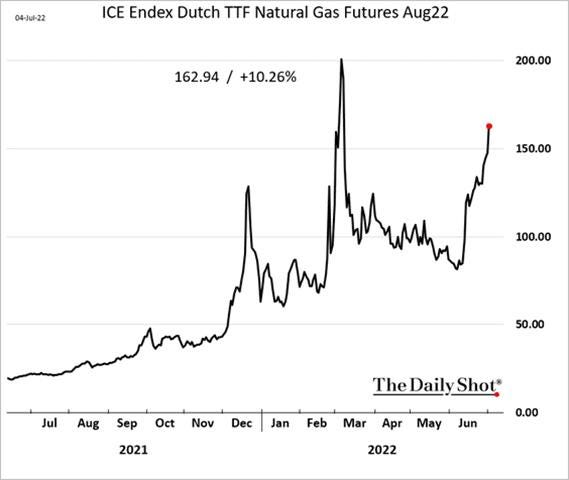
Natural gas prices in Europe are back on the rise as supplies from Russia continue to fall, and a strike in the North Sea further stresses the situation.
Commodity prices have fallen fast with 3-month changes showing expectations for large levels of demand destruction.
Article by Macro Themes:
Medium-term Themes:
Real Supply-Side Situation:
First Gear: U.S. Logistics Gauge Shows Economy Downshifting Into Second Half - Bloomberg
An indicator of U.S. supply-chain pressure fell to the lowest level in two years, as a sharp drop in transportation costs underscores the slowdown in the nation’s economy heading into the second half of the year. The Logistics Managers’ Index declined to 65 in June, the third straight fall from a record of 76.2 reached in March and the lowest level since July 2020, the monthly report released Tuesday showed. It was the first time since mid-2020 that the reading came in below the all-time average, currently at 65.3.
Why it Matters:
The index’s gauge of transportation prices fell for a third straight month, but the future index for transportation is “indicating expectations of slight price increases for the next year.” Meanwhile, warehouse prices, capacity, and utilization all retreated, though “we are not seeing the dramatic price drops for warehousing that we are seeing with transportation,” the report said.
Foreigners Needed: How a controversial shipping law is swaying the price of gas – Freight Waves
One part of the cost of oil involves its transportation. Fuel moves around the U.S. via rail, pipelines, and ships such as tankers and barges. Ships that operate from American port to American port must follow the Jones Act, meaning they’re built in the U.S. and owned, operated, and crewed by Americans. These ships are costly. The average U.S.-flagged ship costs around $20,000 a day to operate, compared to $7,400 for a foreign-flagged ship, according to a 2011 Department of Transportation study. These ships are also more expensive to build, six to eight times pricier than a foreign vessel, according to a 2017 Congressional Research Service report.
Why it Matters:
Through the early and mid-1900s, the U.S. enjoyed a vigorous domestic shipping industry, with 16% of the world’s cargo fleet sporting a U.S. flag as of 1960. Today just 0.2% of all ships are U.S.-flagged. Many ships now fly under the flags of Panama, Liberia, and the Marshall Islands, countries that allow ocean carriers to bypass a slew of safety regulations, labor laws, and taxes. Further, Jones Act supporters say it’s crucial for America to maintain its own fleet of ships in the worst-case scenario of international war. However, critics say there are far fewer ships due to the current structure of the industry and a lack of government support. It is also unclear just how much nixing the Jones Act would save at the pump. The article discusses the act and what a current waiver to it might do to fuel costs.
Mounting: South Korea’s Chip Stockpile Jumps Amid Tech Slowdown Concerns - Bloomberg
South Korea’s chip stockpiles increased by the most in more than four years, with the nationwide inventory jumping 53.4% in May from a year earlier. Semiconductor stockpiles have been rising on a year-on-year basis since October last year.
Why it Matters:
South Korea is the world’s biggest producer of memory chips that go into everything from smartphones and laptops to cars. An earlier 54.1% gain in March 2018 coincided with a slowdown in revenue growth in the memory chip industry. There is still a shortage of certain types of semiconductors, but the more common ones are no longer in short supply.
Longer-term Themes:
National Security Assets in a Multipolar World:
OnShoring: American Factories Are Making Stuff Again as CEOs Take Production Out of China – Bloomberg
The construction of new manufacturing facilities in the US has soared 116% over the past year, dwarfing the 10% gain on all building projects combined, according to Dodge Construction Network. There are massive chip factories going up in Phoenix: Intel is building two just outside the city; Taiwan Semiconductor Manufacturing is constructing one in it. And aluminum and steel plants are being erected all across the south: in Bay Minette, Alabama (Novelis); in Osceola, Arkansas (US Steel); and in Brandenburg, Kentucky (Nucor). Up near Buffalo, all this new semiconductor and steel output is fueling orders for air compressors that will be cranked out at an Ingersoll Rand plant that had been shuttered for years.
Why it Matters:
Rattled by the most recent wave of strict Covid lockdowns in China, the long-time manufacturing hub of choice for multinationals, CEOs have been highlighting plans to relocate production, using the buzzwords onshoring, reshoring, or nearshoring, at a greater clip this year than they even did in the first six months of the pandemic, according to a review of earnings call and conference presentations. In January, a UBS survey of C-suite executives revealed the magnitude of this shift. More than 90% of those surveyed said they either were in the process of moving production out of China or had plans to do so. And about 80% said they were considering bringing some of it back to the U.S.
Electrification and Digitalization Policy:
Make it Legit: Crypto’s Free Rein May Be Coming to a Close - Wired
On Thursday, EU institutions announced an agreement on two landmark pieces of regulation: the Market in Crypto-Asset Act (aka MiCA), regulating most providers of cryptocurrency services, and an anti-money-laundering package imposing robust checks on cryptocurrency transfers. In the U.S., several proposals have been put forward over the past few months. One notable example is the wide-ranging bipartisan bill sponsored by Republican Senator Cynthia Lummis and Democratic Senator Kirsten Gillibrand, which the crypto industry has saluted as beneficial, while others have condemned it as a capitulation to the crypto lobby’s requests.
Why it Matters:
After more than a decade when cryptocurrencies and related technologies have surged, boomed, and busted in a regulatory vacuum, lawmakers in both the US and Europe are writing new rules for a sector that has grown dangerously large in both values and reach, touching $2.9 trillion at its peak in November 2021. The ongoing crash in crypto markets has only strengthened rule-makers resolve. The article covers what regulations are occurring in different parts of the crypto world.
Not so Fast: Grayscale Suing SEC After Its Spot Bitcoin ETF Is Rejected - Bloomberg
Chief Executive Officer Michael Sonnenshein tweeted late Wednesday that Grayscale Investments was suing the Securities and Exchange Commission after the agency rejected a bid to convert its Bitcoin trust into the first crypto exchange-traded fund. The regulator found that the plan by NYSE Arca to list the product didn’t do enough to prevent fraud and manipulation.
Why it Matters:
Turning GBTC into an ETF would have solved a persistent issue for Grayscale: the trust’s deep discount on its underlying holdings. Unlike an ETF, GBTC shares can’t be created and redeemed to keep pace with shifting demand. That’s effectively turned GBTC into a closed-end fund, with GBTC’s price trading 28% below its net asset value. Steeping further back, it's clear the SEC still sees Bitcoin as a highly speculative investment, to put it nicely, and does not want to put its stamp of approval on investing in it.
Hack Me: DoD issues call for hackers to dig into networks – The Record
The Defense Department is offering monetary rewards to ethical hackers who discover critical or severe vulnerabilities within the massive agency’s networks. The Pentagon’s inaugural “Hack U.S” program, run in conjunction with bug bounty platform HackerOne and under the auspices of the department’s vulnerability disclosure program, launched on Monday. The pilot effort kicked off with $110,000 in funds up for grabs. Researchers will receive $1,000 for each flaw they find and report and $500 for any “high severity” weaknesses they uncover. Hackers can also earn $3,000 for what DoD calls “additional specialty categories,” as well as one grand prize bonus of $5,000.
Why it Matters:
The bug bounty is the latest attempt by the Pentagon to use “white hat” hackers to shore up its vast ecosystem of systems against potential digital threats, especially foreign adversaries like Russia and China. In May, DoD and HackerOne announced that a year-long bug bounty program that scrubbed a tiny portion of the sprawling U.S. defense industrial base uncovered more than 400 valid vulnerabilities. It is a positive sign that the DoD is willing to enlist private sector hackers, and we will be waiting to see the results given how many bugs were found in the trial run. However, in our uneducated hacker world opinion, the rewards for finding vulnerabilities seem too low given the risks they may pose.
Commodity Super Cycle Green.0:
Help us, help you: Albemarle Urges US to Cut Red Tape to Boost Lithium Supply Chain - Bloomberg
The world’s largest lithium producer is urging the U.S. government to cut red tape to accelerate a build-out of a domestic supply chain for materials needed for batteries, electric vehicles, and cleaner technologies while cutting dependence on China. The Biden administration added battery metals, including lithium, to the list of items covered by the 1950 Defense Production Act, which could help mining companies access $750 million to fund production at existing operations, productivity and safety upgrades, and feasibility studies.
Why it Matters:
The only way for the U.S. to have a chance of catching up to China, South Korea, and Japan is to make it easier to build a supply chain in the country “and have the government clear the way to make sure that happens quickly,” Eric Norris, lithium president at Albemarle Corp., said in an interview. “It takes more than money,” he said on the sidelines of the Fastmarkets Lithium Supply and Battery Raw Materials Conference in Phoenix. Steps the government can take include clearing the way around the permit process for miners, creating tax incentives, and making it easier to build a supply chain in the U.S., Norris said.
ESG Monetary and Fiscal Policy Expansion:
Gray Wolf: Trump-Era Changes to Endangered Species Act Tossed by Court – WSJ
A federal judge in California threw out Trump-era changes to the Endangered Species Act, including one that allowed economic factors to be considered on whether to list a species as threatened or endangered. The ruling also voids regulations that made it more difficult to give protections to species threatened by anticipated future events, such as the impacts of climate change.
Why it Matters:
The decision is a setback for some business groups that said the federal government had gone too far in some cases, for example, with broad definitions of critical habitat that had the effect of putting development off-limits. Several industry groups, including the American Farm Bureau Federation, the American Petroleum Institute, and the National Association of Home Builders, had said in the lawsuit that it would be “an abuse of discretion” for the judge to void the rules. We highlight this development because as America onshores more production and tries to build out its renewable energy industry, much of the needed materials will be not so environmentally friendly to obtain, bringing two “green” causes into contention.
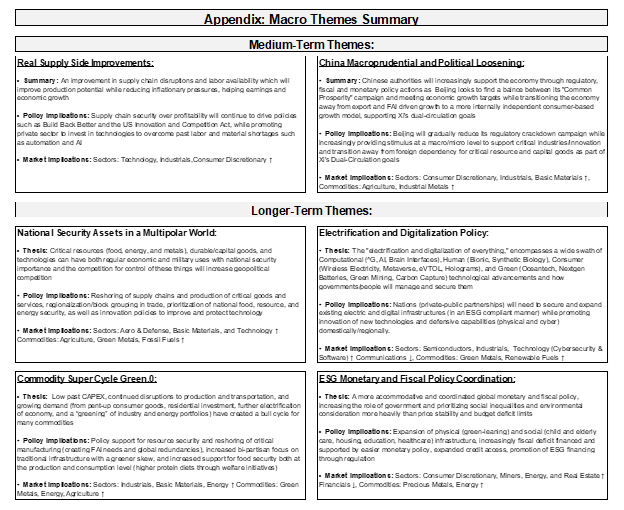
Appendix:
Current Macro Theme Summaries:
VIEWS EXPRESSED IN "CONTENT" ON THIS WEBSITE OR POSTED IN SOCIAL MEDIA AND OTHER PLATFORMS (COLLECTIVELY, "CONTENT DISTRIBUTION OUTLETS") ARE MY OWN. THE POSTS ARE NOT DIRECTED TO ANY INVESTORS OR POTENTIAL INVESTORS, AND DO NOT CONSTITUTE AN OFFER TO SELL -- OR A SOLICITATION OF AN OFFER TO BUY -- ANY SECURITIES, AND MAY NOT BE USED OR RELIED UPON IN EVALUATING THE MERITS OF ANY INVESTMENT.
THE CONTENT SHOULD NOT BE CONSTRUED AS OR RELIED UPON IN ANY MANNER AS INVESTMENT, LEGAL, TAX, OR OTHER ADVICE. YOU SHOULD CONSULT YOUR OWN ADVISERS AS TO LEGAL, BUSINESS, TAX, AND OTHER RELATED MATTERS CONCERNING ANY INVESTMENT. ANY PROJECTIONS, ESTIMATES, FORECASTS, TARGETS, PROSPECTS AND/OR OPINIONS EXPRESSED IN THESE MATERIALS ARE SUBJECT TO CHANGE WITHOUT NOTICE AND MAY DIFFER OR BE CONTRARY TO OPINIONS EXPRESSED BY OTHERS. ANY CHARTS PROVIDED HERE ARE FOR INFORMATIONAL PURPOSES ONLY, AND SHOULD NOT BE RELIED UPON WHEN MAKING ANY INVESTMENT DECISION. CERTAIN INFORMATION CONTAINED IN HERE HAS BEEN OBTAINED FROM THIRD-PARTY SOURCES. WHILE TAKEN FROM SOURCES BELIEVED TO BE RELIABLE, I HAVE NOT INDEPENDENTLY VERIFIED SUCH INFORMATION AND MAKES NO REPRESENTATIONS ABOUT THE ENDURING ACCURACY OF THE INFORMATION


