Midday Macro – 7/27/2022
Market Recap:
Price Action and Headlines:
Equities are higher, with “good enough” earnings from Microsoft and Google, as well as beats elsewhere, helping tech/communications and growth outperform as traders await the July FOMC meeting results at 2 PM
Treasuries are mixed, but generally better bid other than the two-year space, with weaker housing data being buffered by stronger durable goods orders and inventory data
WTI is lower, with exports of U.S. crude and refined products hitting a fresh record high, while the Biden Administration plans to end SPR releases in October as inventories continue to fall
Narrative Analysis:
The overall narrative continues to have a “good enough” feel regarding Q2 earnings as companies are having mixed results defending margins, but so far, the overall picture isn’t as dire as feared. The “hard” economic data shows businesses are still investing and restocking while the housing market is slowing faster than expected. There were slight improvements from regional Fed manufacturing surveys out of Texas and Richmond this week, showing demand recovering from June lows while inflationary pressures continued to fall. Speaking of the Fed, anything other than a 75 basis point hike to the Fed funds range would be a shocker, with traders focused on whether Powell will strike a more dovish tone in the presser. It is unlikely he will, as there have yet to be material changes in core PCE, inflation expectations, or wages. Financial conditions have also stabilized as lower volatility has buffered the effects of a stronger dollar, something the Fed may not want to see yet. Treasuries continue to indicate greater recessionary worries (verse inflation fears), with developed global rates more generally looking to question central bankers tightening intentions in the face of weaker economic growth. WTI is increasingly trading at a discount to Brent, with U.S. exports hitting a record level while the end of SPR releases is approaching. Commodities are mixed elsewhere, as copper looks to be basing while other industrial metals continue to be at the whim of Chinese headlines. The agg market is mixed but somewhat better bid as traders gauge whether wheat exports out of Ukraine will really occur while growing conditions vary across the U.S., bringing into question ultimate yields. Finally, the $DXY is higher, back above 107, as the Euro and Yen have both suffered from higher energy costs bringing greater recessionary worries.
The Nasdaq is outperforming the S&P and Russell with Growth, Small-Cap and Value factors, and Communication, Technology, and Consumer Discretionary sectors are outperforming on the day. More defensive sectors (Utilities and Healthcare) have outperformed on the week, while factor performance has been more mixed (Momentum and Low Volatility).
@KoyfinCharts
S&P optionality strike levels have the Zero-Gamma Level at 3990 while the Call Wall is 4100. Support is around 3935 (Vol Trigger), then 3900. Resistance is at 4000. All eyes are on today’s FOMC meeting, which likely triggers the next large directional move. Volatility has been contracting for the last ten days as the market has held the 3900-4000 range. Any “range release” following the FOMC meeting will likely spark a new volatility cycle into August OPEX, with bulls wanting continued lower implied volatility and call buying, all building greater positive gamma, which would drive the market higher.
@spotgamma
S&P technical levels have support at 3945-55, then 3920, and resistance at 3975 (here now), then 4000. As long as the S&P is above 3900, bulls are still in control. It is next to impossible to forecast how an FOMC day plays out. However, after today and Thursday, it should be possible to get back into providing a clearer multi-day path. Expect traps and any outcome.
@AdamMancini4
Treasuries are higher, with the 10yr yield at 2.78%, lower by around 3.2 bps on the session, while the 5s30s curve is stepper by 2.3 bps, moving to 15 bps.
Econ Data:
New orders for durable goods rose 1.9% from a month earlier in June, the most since January and the fourth consecutive monthly increase. Figures beat market forecasts for a -0.5% decrease. Excluding transportation, new orders went up 0.3%, and excluding defense, new orders increased 0.4%. Transportation equipment, up three consecutive months, increased by 5.1%. Orders for non-defense capital goods excluding aircraft, a proxy for investment in equipment, rose 0.5%, the same as in May. Shipments increased by 0.3%, following a 1.5% increase in May. Unfilled Orders increased by 0.7%. Finally, Inventories rose by 0.4%, following a 0.6% increase in the prior month.
Why it Matters: Although the headline New Orders number was heavily lifted by transportation due to aircraft orders jumping 20.4% and vehicle orders increasing 1.5%, the underlying report showed solid investment in equipment still occurring. Orders increased in June for computers, electronic products, and fabricated metals. When coupled with growth in shipments, unfilled orders, and inventories, the overall tone of the report was much better than expected. It will also increase Thursday's initial GDP print notably when combined with the trade and inventory data seen elsewhere today, likely saving us from a technical recession.
*Orders of non-defense capital goods excluding aircraft rose 0.5% in June, while shipments of these core capital goods were up 0.7% in the month
Wholesale inventories increased by 1.9% in June, the same pace as in May, a preliminary estimate showed. Stocks of durable goods rose by 1.9% (vs. 2.0% in May) while inventory levels of nondurable goods rose 1.8%, the same as in the previous month. On an annual basis, wholesale inventories are now higher by 25.6% YoY. Retail Inventories Excluding Autos increased by 1.6% in June, following an upwardly revised 1.4% rise in May.
Why it Matters: Wholesale and retail inventories are rising fast, supporting what we hear from the likes of Target and Walmart. This will help keep Q2 GDP growth positive and also looks to show firms are eager to be well stocked going into the holiday period (again) as just-in-time shipping continues to be second to having merchandise on hand. There will likely be less inflation pressure from the auto sector, given strong gains in motor vehicle and parts inventories.
*Despite worries about falling demand and changing consumer preferences, firms continue to stock up, showing a mixed picture between confidence readings and actual activity
The S&P CoreLogic Case-Shiller 20-city home price index increased 1.5% MoM or 20.5% YoY in May, slowing from a record jump of 21.2% in April and below forecasts of 20.6%. All 20 cities recorded double-digit price increases, with Tampa (36.1%), Miami (34%), and Dallas (30.8%) leading the gains. The national index, covering all nine US census divisions, grew 19.7% year on year, down from 20.6% in the previous month.
Why it Matters: “Housing data for May 2022 continued strong, as price gains decelerated slightly from very high levels,” says Craig J. Lazzara, Managing Director at S&P DJI. “Despite this deceleration, growth rates are still extremely robust, with all three composites at or above the 98th percentile historically. However, at the city level, we also see evidence of deceleration. Price gains for May exceeded those for April in only four cities. As recently as February of this year, all 20 cities were accelerating.” The bottom line is we are finally starting to see some relief from the high levels of housing price appreciation.
*Still a historically high monthly increase, but when coupled with what is being seen elsewhere, there are strong signs a topping is occurring
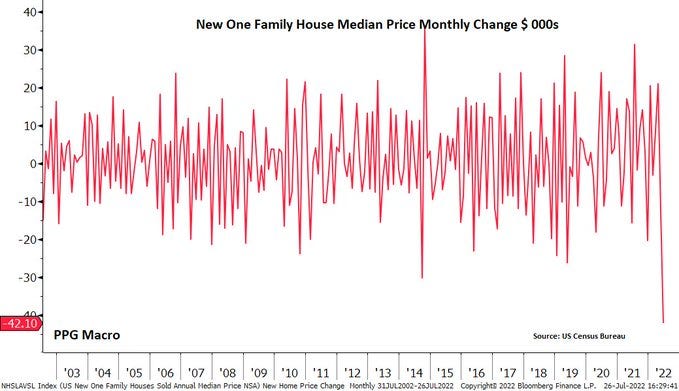
New home sales declined by -8.1% from a month earlier to a seasonally adjusted annual rate of 590K in June, well below market expectations of 660,000. Sales fell in the West (-36.7%), the Northeast (-5.3%), and the South (-2%) but rose in the Midwest (42.3%). The median sales price of new houses sold declined for the second month in a row to $402.4K, but was still way above $374,700 a year earlier. There are 457K houses to sell, corresponding to 9.3 months of supply in inventory, compared to 8.4 months in May.
Why it Matters: New home sales fell more than expected during June, while the prior month was also revised substantially lower. The slowdown in sales has led to an increase in new home inventories. The inventory of new homes has risen to a 9.3-month supply at the current sales pace, which is the highest it has been since May 2010. Builders have responded by reducing prices and offering incentives to buy down mortgage rates.
*The inventory of completed homes for sale is up from the record low in early 2022 but still about half the normal level. The inventory of homes under construction at 306K is very high and about 9% below the record set in 2006. The inventory of homes not started is at a record 110K.
*“Only the biggest nominal $ monthly fall in new house median price. Ever.” = @PPGMacro
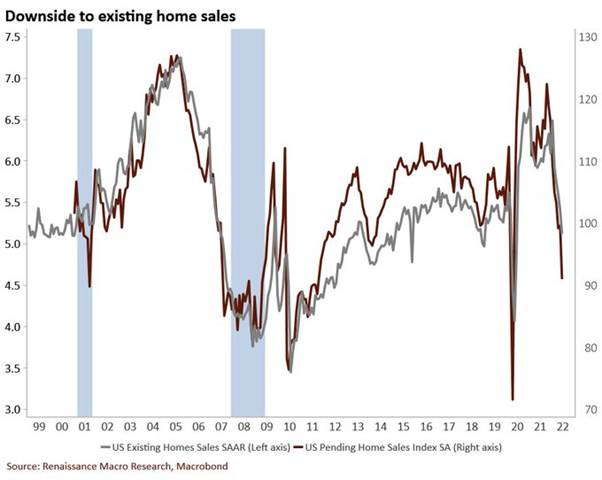
Pending Home Sales fell by -8.6% in June, after increasing 0.4% in May, and much more than market forecasts of a -1.5% drop. Pending sales retreated in all four major regions: Midwest (-3.8%), Northeast (-6.7%), South (-8.9%), and West (-15.9%). Year-over-year, transactions shrank by -20%.
Why it Matters: The significant drop in pending home sales is further evidence that the housing market is cooling quickly. "Contract signings to buy a home will keep tumbling down as long as mortgage rates keep climbing, as has happened this year to date. There are indications that mortgage rates may be topping or very close to a cyclical high in July. If so, pending contracts should also begin to stabilize", NAR Chief Economist Lawrence Yun said. According to NAR, buying a home in June was about 80% more expensive than in June 2019. Nearly a quarter of buyers who purchased a home three years ago would be unable to do so now. "Home sales will be down by 13% in 2022 but should start to rise by early 2023", Yun added.
*Pending home sales crumbled 8.6% in June. Excluding the pandemic, this was the lowest level since 2011. A sale is listed as pending when a contract is signed on an existing home. This series leads existing home sales by 1-2 months. Brokers' commissions will drop sharply in Q3. - @RenMacLLC
The Conference Board Consumer Confidence Index decreased by 2.7 points to 95.7 in July from 98.4 in June. The Present Situation Index fell to 141.3 from 147.2, while the Expectations Index ticked down to 65.3 from 65.8. Consumers’ appraisal of current business conditions was less favorable, and their assessment of the labor market was less optimistic. Consumers were mixed about the short-term business conditions and labor market outlook. Consumers were more pessimistic about their short-term financial prospects.
Why it Matters: A further deterioration in the consumers’ current sentiment was seen in the drop in the Present Situation Index and weakness in their assessment of business conditions and labor markets. However, the future outlook did not deteriorate as much, although it broadly weakened, with all individual categories worsening. “Consumer confidence fell for a third consecutive month in July,” said Lynn Franco, Senior Director of Economic Indicators at The Conference Board. “The decrease was driven primarily by a decline in the Present Situation Index—a sign growth has slowed at the start of Q3. The Expectations Index held relatively steady but remained well below a reading of 80, suggesting recession risks persist. Concerns about inflation—rising gas and food prices, in particular—continued to weigh on consumers.”
*“As the Fed raises interest rates to rein in inflation, purchasing intentions for cars, homes, and major appliances all pulled back further in July. Looking ahead, inflation and additional rate hikes are likely to continue posing strong headwinds for consumer spending and economic growth over the next six months.” - Lynn Franco, Senior Director of Economic Indicators at The Conference Board.
*The one-year ahead inflation expectation eased modestly in July. It has been above 7% for six consecutive months, the longest run on this metric in the history of the series, which dates back to August 1987.
The Richmond Fed’s Manufacturing Index remained rose to 0 in July, recovering from a revised -9 in June. New Orders (-10 vs. -20 in June) remained in negative territory but improved while Shipments (7 vs. -17) moved back into expansionary territory, while the Backlog of Orders (-15) was unchanged. Vendor Lead Time (0 vs. 9) dropped further while Local Business Conditions (-13 vs. -32) improved. Inventories also increased while Capex improved and service spending softened. The Employment picture cooled but remained expansionary with a worsening in finding needed workers. Finally, Prices Paid and Received both weakened further, with Received dropping notably more, putting pressure on profit margins. Expectations broadly improved, following similar changes in current conditions except for investment-orientated categories improving and Prices Paid worsening.
Why it Matters: A notable bounce back in certain sub-indexes helped drive the headline index back to 0 from -9. There was further indication that supply chains were improving, as seen in shorter lead times and higher inventory levels. Inflationary pressures also fell further, with price trends and wages continuing a multi-month drop. The improvement in future outlook was more pronounced (than in Current Conditions) but interestingly did not indicate much further inflationary cost relief is expected.
*The index for new orders rallied to -10 from -20 in July, while the employment index fell to 8 in July from 16 in June. However future outlook slightly improved
*Although still weak, there was a broad improvement off of June lows in numerous categories while supply-side impairments looked to have improved somewhat
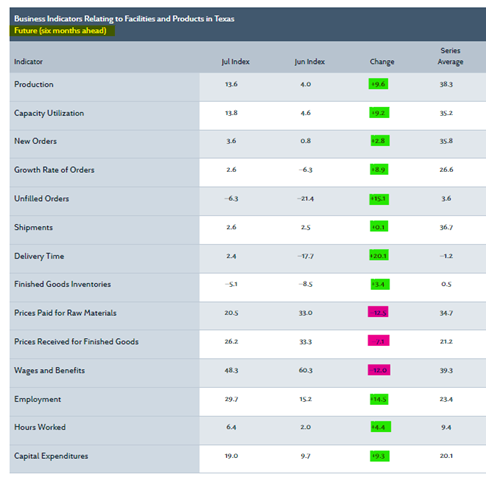
The Federal Reserve Bank of Dallas' general business activity index for manufacturing in Texas decreased to -22.6 in July from -17.7 in June, hitting the lowest level since May 2020. The Production index was largely unchanged at 3.8. New Orders fell further to -9.2 (vs. -7.3 in June), and the Growth Rate of Orders edged up to -12.0 (vs. –16.2) but remained negative. Capacity Utilization was unchanged at 3.5, and the Shipments index ticked up to 4.3 (vs. 1.2). Labor market measures continued to indicate growth in employment and longer workweeks. On the price front, prices and wages continued to increase but at a more moderate pace. The six-month-ahead outlook improved with broad increases in the sub-indexes related to demand while inflationary pressure expectations fell further.
Why it Matters: Despite the worse headline print for general activity, the underlying components of both the current and future painted a more positive picture. Demand continues to cool, but overall production, shipments, and employment activity remain positive. Meanwhile, supply-side impairments improved with prices falling and delivery times now neutral. More importantly, the six-month-ahead outlook saw increases in every sub-indexes except inflation-related ones, with employment and Capex intentions notably increasing. Firms are indicating a desire to continue to expand and invest, something that would not be occurring if a more prolonged recession was expected.
*Demand-related indicators fell further in July, and along with decreases in prices, delivery times, and inventory measures, drove the general activity headling print lower
*Future sub-indexes other than price all rebounded in July as firms indicated a more positive outlook
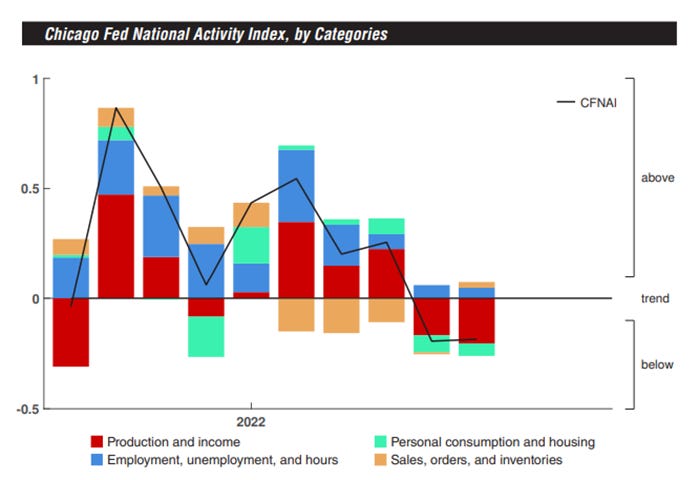
The Chicago Fed National Activity Index was unchanged at -0.19 in June from a downwardly revised -0.19 in May. Production-related indicators contributed -0.20, down from -0.17 in May; employment-related indicators contributed +0.05, down slightly from +0.06; and the contribution of the sales, orders, and inventories category edged up to +0.03 from -0.01. The contribution of the personal consumption and housing category to the CFNAI ticked up to –0.06 in June from –0.08 in May. Meanwhile, the index’s three-month moving average, which provides a more consistent picture of national economic growth, decreased to -0.04 from +0.09, the first negative reading in two years.
Why it Matters: The CFNAI is a summarization of 85 individual economic indicators broken down into four categories. Employment and sales-related activity positively contributed to the overall index while production and consumption-related activities continued to be negative. Forty-one of the 85 individual indicators made positive contributions to the CFNAI in June, while 44 made negative contributions. Forty-one indicators improved from May to June, while 42 indicators deteriorated, and two were unchanged.
*Slight improvements in Sales and PCE-related indicators were negated by further weakness in Employment and Production related economic indicators
Technicals and Charts:
Four Key Macro House Charts:
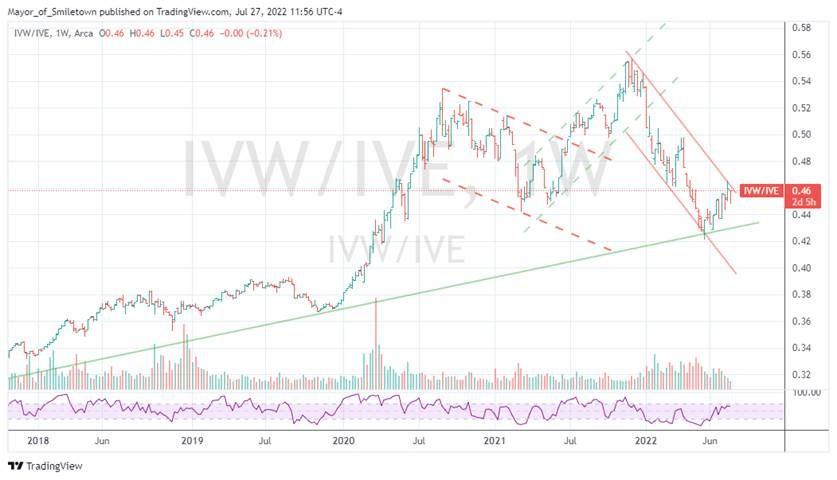
Growth/Value Ratio: Growth is slightly higher on the day but little changed on the week. Large-Cap Value is the best performing size/factor on the day.
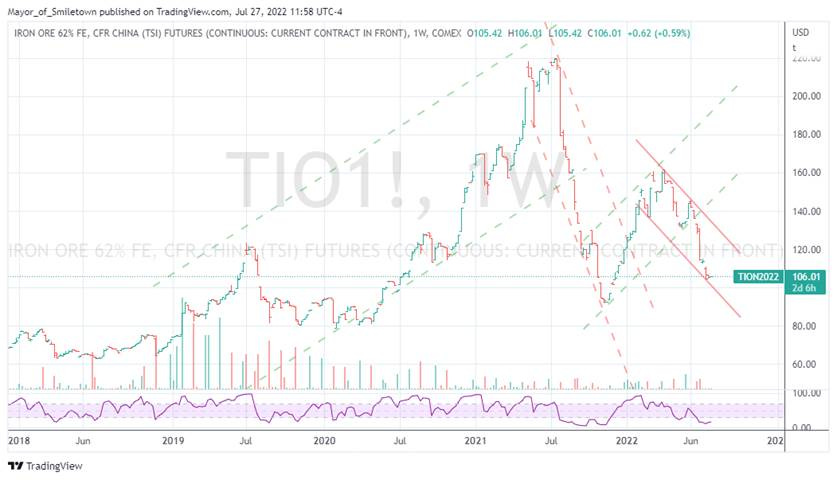
Chinese Iron Ore Future Price: Iron Ore futures are higher on the day, and little changed on the week. Chinese steel industry’s profit tumbled over 90% on year in June amid sluggish demand.
5yr-30yr Treasury Spread: The curve is steeper on the day and the week as better data and the coming FOMC meeting results have the front-end underperforming but five-year outperforming the long bond
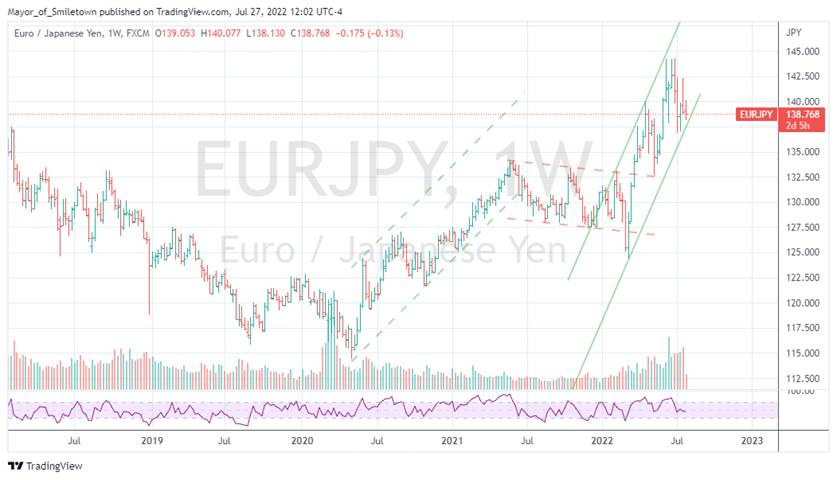
EUR/JPY FX Cross: The Yen is lower on the day but higher on the week. Continued concerns over energy supplies have both currencies weaker on the day verse the dollar.
Other Charts:
Earnings expectations for Q2 continue to fall when adjusting for the energy sector as margin pressures intensify due to increasing costs and reduced pricing power, likely leaving profit estimates still too rosy.
Mentions of dollar strength or FX volatility have increased significantly in Q2, adding an additional headwind to earnings.
Changes in the FX channel tend to lead to missed sales estimates, something likely to be a theme in Q2.
“At the half-year point, US investors had already added $212 billion to equity ETFs. That’s above full-year levels for 2016, 2018, and 2019 and not far off the 2020s $241 billion. At this pace, annual equity ETF flows will be the 2nd highest ever, behind 2021.” - @FactSet
“Travel and entertainment spending just exploded this quarter with all the pent-up demand,” American Express Finance Chief Jeff Campbell said, adding that spending on goods and services didn’t show any signs of slowing. Overall cardholder spending rose 30% from a year earlier when adjusted for currency effects, as consumers and businesses resumed travel plans that were on hold for the last two years.
“The Wards forecast of 13.3 million SAAR, would be up about 2% from last month, and down 9% from a year ago (sales were starting to weaken in mid-2021, due to supply chain issues).” - @calculatedrisk
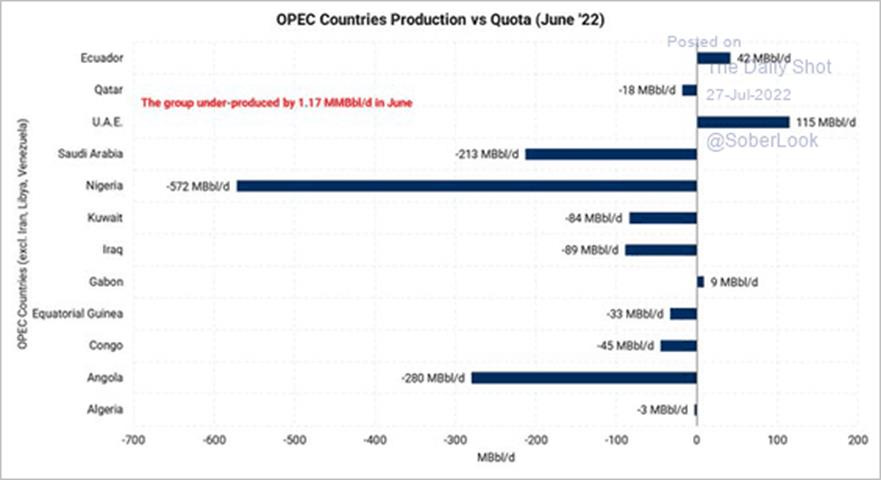
OPEC’s output continues to be below its production target, with the cartel short 1.17 million barrels a day, mainly due to Nigeria, Angola, and Saudi Arabia
“Taiwan exports are a great barometer for levels of global trade… Continued strength signals strong global trade moving forward and a welcome sign for today’s global economy…” - @SFA_InvResearch
The high level of uncertainty that zero-Covid has brought to everyday life in China has driven consumer confidence to all-time lows
Article by Macro Themes:
Medium-term Themes:
Real Supply-Side Situation:
Walky-Talky: West Coast Dockworkers Reach Tentative Pact on Health Benefits But Talks Still Ongoing - Bloomberg
The union for West coast dockworkers reached a tentative agreement with employers on health benefits, one portion of broader talks on a new labor contract for about 22,000 employees at key U.S. maritime locations. The ILWU and the more than 70 employers represented by the PMA started talks on May 10 to work out a new contract for longshoremen across 29 ports in California, Oregon, and Washington. While their most recent agreement ended July 1, the groups reaffirmed that neither party was preparing for a strike or lockout. Talks often go past the expiration.
Why it Matters:
West Coast operations include Los Angeles and Long Beach, which handle just under half of the containers entering and leaving the U.S. and are the principal gateway for shipments to and from China, the biggest source of American merchandise imports -- illustrating the high-stakes nature of the negotiations. Businesses had been holding their breath in anticipation of a potential dockworker strike, with shippers warning of the potential for higher costs and fresh delays. Container line Zim Integrated Shipping Services said in May that more businesses had shifted cargo to East Coast ports to avoid disruption. Still, while no strike is planned, a delay in negotiations may lead to informal work slowdowns that could threaten the flow of cargo, according to Peter Tirschwell, S&P Global Market Intelligence vice president for maritime, trade, and supply chain.
China Macroprudential and Political Loosening:
Signaling: China Property Stocks, Bonds Rally on Reported Fund Help - Bloomberg
China is reportedly planning to set up a real estate fund that could be worth up to $44 billion to support more than a dozen property developers. The fund has secured 50 billion yuan from China Construction Bank and a 30 billion yuan re-lending facility from the People's Bank of China (PBOC). It will be used to buy financial products issued by the developers or finance state buyers' acquisitions of their projects.
Why it Matters:
If confirmed, the move would mark one of the most direct measures yet taken by Beijing to support the housing sector. The sector has been roiled by massive defaults, slumping sales, and a widening boycott on bank loans. Despite the fund’s limited size, “clearly the government is signaling it wants to restore homebuyers’ confidence and encourage them to start purchasing houses again,” said Steve Wong, an analyst at Essence International Financial Holdings Ltd. “Setting up a fund is more feasible since a broad-based easing for the sector is unlikely.”
Hurray Up: China Urges Accelerating Construction Projects to Boost Economy - Bloomberg
A recent State Council meeting chaired by Premier Li called on local governments to ensure construction and supply chains won’t be interrupted and that more job opportunities be provided to migrant workers, state broadcaster CCTV reported. It vowed to prioritize stabilizing employment and inflation while stepping up efforts to strengthen the economy. The State Council pledged to support the healthy development of the internet platforms and reaffirmed that it would meet the demands of first-time home-buyers as well as the reasonable needs of those looking to improve their housing conditions.
Why it Matters:
China’s cabinet called for speeding up the construction of infrastructure projects this quarter as it sees the sector as a critical factor for an economic rebound. Stimulus efforts are having a low multiplier effect on growth due to the economy still being impaired by the loss of real activity and general consumer/business confidence due to the zero-Covid policy. As a result, authorities are increasing the urgency to set up a mechanism to efficiently approve infrastructure projects that can generate returns and start construction early.
Compliance: China plans three-tier data strategy to avoid U.S. delistings - FT
China is preparing a system to sort U.S.-listed Chinese companies into groups based on the sensitivity of the data they hold, in a potential concession by Beijing to try to stop American regulators from delisting hundreds. Chinese companies listed in the U.S. would be divided into three broad categories, a group with companies with non-sensitive data, those with sensitive data, and others with “secretive” data that would have to delist.
Why it Matters:
The category system would be the second significant concession by Beijing to remove hurdles allowing the US full access to audits. In April, it modified a decade-long rule that restricted the data-sharing practices of overseas companies. A mass delisting would represent a significant step towards an economic decoupling of the US and China and threaten $1.3tn of shareholder value. The China Securities Regulatory Commission, Beijing’s top securities watchdog, commented after publication that it “has not studied this three-tier” structure for listed companies. Hence much could still change.
Longer-term Themes:
Electrification and Digitalization Policy:
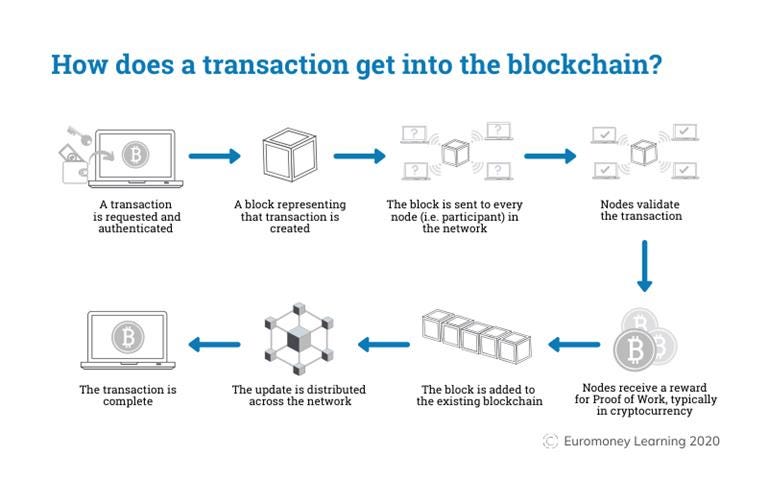
So-Called: Lawmakers Near Deal on Tougher Rules for Stablecoins – WSJ
U.S. lawmakers moved closer to a bipartisan agreement on new legislation that would regulate so-called stablecoins as part of efforts to impose basic safeguards on volatile cryptocurrency markets. The potential deal would mark the first significant step to applying tougher rules to an industry that developed with virtually no regulation. The deal wasn’t yet final and could still fall apart, people familiar with the negotiations said.
Why it Matters:
Biden administration officials and a bipartisan group of lawmakers worry that current laws don’t provide comprehensive standards for the new assets and have warned of potential risks to financial stability posed by stablecoins, a type of cryptocurrency intended to be pegged to the dollar or another national currency. If a deal is reached in the coming days, the legislation could be voted on by the House Financial Services Committee as early as next week and pass the House in the coming weeks or months. It faces an uncertain path in the Senate.
Transactional: U.S. Senators Push Bill to Make Small Crypto Transactions Tax-Free - CoinDesk
Sen. Patrick Toomey (R-Pa.) joined with Kyrsten Sinema (D-Ariz.) to push the exemption from tax requirements for crypto users making small investments or purchases of under $50. Their Virtual Currency Tax Fairness Act matches a similar effort previously introduced in the House of Representatives. The idea of clearing low-level transactions from tax worries has also appeared elsewhere, including in a more comprehensive bill introduced this year by senators Cynthia Lummis (R-Wyo.) and Kirsten Gillibrand (D-N.Y.). “While digital currencies have the potential to become an ordinary part of Americans’ everyday lives, our current tax code stands in the way,” said Toomey.
Why it Matters:
The latest bill will let people “use cryptocurrencies more easily as an everyday method of payment by exempting from taxes small personal transactions like buying a cup of coffee.” The Internal Revenue Service has held a firm crypto policy: “When you sell virtual currency, you must recognize any capital gain or loss on the sale,” the IRS declares on its website. That standard has been among the roadblocks standing in the way of crypto’s use in the U.S. as an alternative way to pay for things, industry advocates have argued. The new legislation faces an uphill climb in a Congress on the verge of a lengthy August recess before the midterm elections.
High Volume: China Has a Problem With Data Leaks. One Reason Is Its Surveillance State - WSJ
China’s government has built one of the world’s strictest cybersecurity and data protection regimes, but despite those efforts, a thriving cross-border underground market has grown up around the trade in the data of Chinese citizens. Much of that data comes from the Chinese government’s extensive surveillance network. Earlier this month, a popular online cybercrime forum put up data stolen from the Shanhai Police of an estimated 1 billion Chinese citizens. The WSJ has since found dozens more Chinese databases offered for sale, and occasionally free, in online cybercrime forums and Telegram communities with thousands of subscribers.
Why it Matters:
In 2021, Beijing passed a personal information protection law considered among the world’s strictest, which put tight limits on the collection and cross-border transfer of personal data. At the same time, Xi presided over constructing a massive digital surveillance state that combined biometric tools such as facial recognition with ID numbers and large quantities of behavioral data harvested by tech companies. Increasingly, this data has been collected and analyzed on centralized platforms, which Chinese authorities use to sniff out, or even predict, actions they consider threatening to social order. However, just like everywhere else, Beijing is having trouble securing this data showing the danger of large collection operations.
Improper: Congress goes after spyware purveyors. Will it make a difference? – CyberScoop
The House of Representatives is set to vote on sweeping policy legislation to crack down on and even ban firms that sell the technology from working with the government. But experts say the lucrative market for surveillance technology increasingly used around the world to track dissidents, journalists, activists, and others will be difficult to curtail. “Many companies like [Israeli spyware maker NSO Group] see entering the U.S. market as the ultimate prize and what we’ve seen so far is that the U.S. government does have the ability to chill investment interest in bad actors, and that’s really important,” said John Scott-Railton of the University of Toronto’s Citizen Lab, which has conducted extensive research on spyware.
Why it Matters:
The U.S. government has been increasingly focused on the threats of spyware at home. The Intelligence Authorization Act, which passed the House Intelligence Committee last week with bipartisan support, includes several spyware provisions. In addition to authorizing the Office of the Director of National Intelligence to ban contracts with foreign firms making surveillance tech and allowing the president to impose sanctions on firms targeting the intelligence community (IC) with spyware, the bill also augments funding for investigations into the use of foreign commercial surveillance software.
Commodity Super Cycle Green.0:
Jeopardized: Energy security an extra hurdle for financing pledge – Argus
The UN Cop 26 climate summit in Glasgow last year saw more than 20 countries and institutions pledge to end the international public financing of unabated coal, oil, and gas projects by the end of 2022. That number has since reached 39, but Russia's war in Ukraine has added complexity to how the signatories will implement the commitment, with several countries yet to finalize their policy.There are concerns that the war and subsequent fears over energy security could overshadow the pledge and other decarbonization plans. Commitments could be watered down by exemptions for gas, according to a report from civil society organizations (CSOs) Oil Change International, the International Institute for Sustainable Development, and Tearfund.
Why it Matters:
The wording in the Cop 26 pledge has some flexibility. It calls for the end of "new direct public support for the international unabated fossil fuel energy sector by the end of 2022, except in limited and clearly defined circumstances that are consistent with a 1.5°C warming limit". But the challenge now is to prevent signatories from stretching definitions to fit an energy agenda suddenly dominated by the security of supply. Most countries and institutions are yet to publish policies aligned with the Glasgow pledge, according to the CSOs. Outstanding policies from signatories are expected to be updated by the autumn. Progress will be monitored at Cop 27, when more countries will be encouraged to sign the pledge.
Appendix:
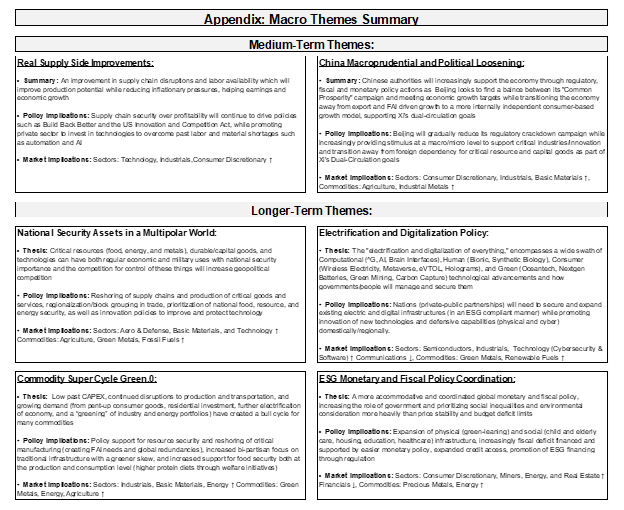
Current Macro Theme Summaries:
VIEWS EXPRESSED IN "CONTENT" ON THIS WEBSITE OR POSTED IN SOCIAL MEDIA AND OTHER PLATFORMS (COLLECTIVELY, "CONTENT DISTRIBUTION OUTLETS") ARE MY OWN. THE POSTS ARE NOT DIRECTED TO ANY INVESTORS OR POTENTIAL INVESTORS, AND DO NOT CONSTITUTE AN OFFER TO SELL -- OR A SOLICITATION OF AN OFFER TO BUY -- ANY SECURITIES, AND MAY NOT BE USED OR RELIED UPON IN EVALUATING THE MERITS OF ANY INVESTMENT.
THE CONTENT SHOULD NOT BE CONSTRUED AS OR RELIED UPON IN ANY MANNER AS INVESTMENT, LEGAL, TAX, OR OTHER ADVICE. YOU SHOULD CONSULT YOUR OWN ADVISERS AS TO LEGAL, BUSINESS, TAX, AND OTHER RELATED MATTERS CONCERNING ANY INVESTMENT. ANY PROJECTIONS, ESTIMATES, FORECASTS, TARGETS, PROSPECTS AND/OR OPINIONS EXPRESSED IN THESE MATERIALS ARE SUBJECT TO CHANGE WITHOUT NOTICE AND MAY DIFFER OR BE CONTRARY TO OPINIONS EXPRESSED BY OTHERS. ANY CHARTS PROVIDED HERE ARE FOR INFORMATIONAL PURPOSES ONLY, AND SHOULD NOT BE RELIED UPON WHEN MAKING ANY INVESTMENT DECISION. CERTAIN INFORMATION CONTAINED IN HERE HAS BEEN OBTAINED FROM THIRD-PARTY SOURCES. WHILE TAKEN FROM SOURCES BELIEVED TO BE RELIABLE, I HAVE NOT INDEPENDENTLY VERIFIED SUCH INFORMATION AND MAKES NO REPRESENTATIONS ABOUT THE ENDURING ACCURACY OF THE INFORMATION


