Midday Macro - 6/14/2022
Color on Markets, Economy, Policy, and Geopolitics
Midday Macro - Semi-weekly Color – 6/14/2022
Overnight and Morning Market Recap:
Price Action and Headlines:
Equities are lower, near recent lows, with the VIX hovering around 33 as traders await tomorrow's economic data and FOMC meeting after a violent move lower over the last three sessions
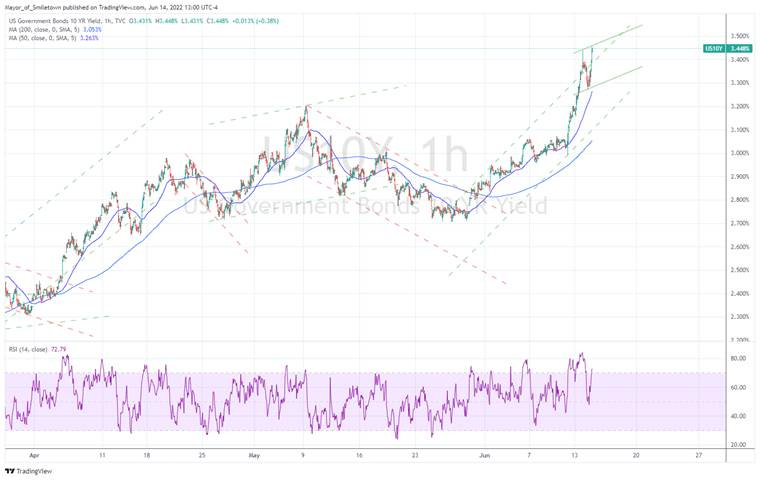
Treasuries are lower, with the curve little changed today as a slight relief rally overnight quickly reversed, unhelped by an inline PPI print and taking its cue from fixed-income weakness in the Eurozone
WTI is higher, but now off session highs and heading back to $120, with OPEC trimming its 2022 supply outlook due to lower internal and Russian production. Elsewhere, natural gas is down around -14% due to the closure of an LNG export hub lasting longer than expected
Narrative Analysis:
Good lord, what to say about these markets? The range in equities that had lasted several weeks quickly broke to the downside at the end of last week thanks to higher inflation and increased policy tightening fears, and three days later, the knife is still somewhat falling, with equities only marginally off recent lows, attempting to put in a green day after three -2%+ days in a row. Today's PPI report showed no materially weakening in inflation pressures, mainly due to energy-related inputs increasing, but was at least in line with forecasts. This brings us to expectations for a 75 basis point hike to be announced by the Fed tomorrow, something increasingly being welcomed by the markets and likely to allow a slight relief rally. Despite the negative moves in stocks, the real action has been in the global rates market, with Treasuries making multi-deviation moves higher in yields, inverting the curve as two-year yields are now 60bp higher in three days. Commodity markets have somewhat bifurcated, with oil continuing higher, although pulling back notably now, while copper and industrials are lower. The agg complex is more mixed as uncertainty regarding planting conditions globally continues. Gold is increasingly becoming decoupled from inflationary views as rises in real rates weigh on it. Meanwhile, the dollar, as seen in the $DXY, is back near recent highs, over 105, with the Euro and Yen falling hard last week, but hardly alone. We won’t even talk about the crypto markets, as just like Bruno, we don’t talk about crypto, no, no.
The Nasdaq is outperforming the S&P and Russell with Growth, Momentum, and Small-Cap factors, and Energy, Technology, and Consumer Discretionary sectors are outperforming on the day.
@KoyfinCharts
S&P optionality strike levels have the Zero-Gamma Level at 4244 while the Call Wall is 4500. Volatility is obviously expected to remain high with support for the S&P at 3700 followed by 3650. Resistance shows at 3800, followed by 3850. The 3700 level remains a large percentage of Friday’s June expiration strike (for puts). This strike could fuel a lot of movement after the Fed, particularly if the S&P is below 3700. Further, there is hardly any call gamma up until 3900, which indicates that prices should remain quite fluid below that.
@spotgamma
S&P technical levels have support at 3735-20, then 3670, and resistance at 3800, then 3835. Once last week’s range/triangle formation broke to the downside, the bear market was officially back in play, and we formally entered it with three -2%+ days in a row. As Ryan Detrick shared on Twitter, of the last ten bear market entries for S&P, eight were higher three months later, with the very notable exceptions of 2008 and 1970. The 3860 level was the major trigger for a move down once broken and will now be the hardest resistance if a relief rally takes hold following tomorrow's FOMC meeting.
@AdamMancini4
Treasuries are lower, with the 10yr yield at 3.45%, higher by around 8.2bps on the session, while the 5s30s curve is little changed, sitting at -13bps
Deeper Dive:
A lot has changed since we wrote last Wednesday, with markets effectively “falling out of bed” as things are increasingly breaking due to a “hawkish” ECB meeting and stronger than expected CPI data last week. The moves in equities and rates have been multi-deviational, meaning the price action we have seen hardly occurs (especially together), and the proverbial knife is still falling. What we have seen the last few days is exactly why we have preached patience and run a lightly positioned mock portfolio. All eyes now turn to whether the Fed will announce a surprise 75 basis point rate hike tomorrow. We hope for this, as current market pricing is expecting it (and would welcome it), but we are still uncertain given Powell specifically said it was not discussed in the prior meeting, and although stronger than expected, the CPI data was not crazy when removing the effects of energy increases. However, a rising terminal policy rate and deteriorating inflation expectation picture call for more aggressive actions, and it is possible the Fed will step up tomorrow (potentially causing a rally in risk assets). Either way, until they do get more aggressive and inflation meaningfully peaks (due to energy prices falling due to demand destruction), equities and rates will not base and establish a new trading range/channel, and recover into the end of next-years coming rate cuts as we continue to see any coming slow-down/recession as shallow and short-lived.
The Bad: Even though a lot has changed in a week, we wanted to continue our series on “the good, the bad, and the ugly” in the current macro backdrop. Clearly, markets have gravitated to a more negative narrative driven by worries of more significant policy tightening due to more persistent inflation, while the global/geopolitical backdrop has not improved materially, keeping energy and food cost pressure concerns elevated. The purpose again of this exercise is not to go into great depth but to mosaic the various themes into one story. Further, it is worth noting several of “the bad” macro factors are improving while several are not, just as most of “the good” were weakening.
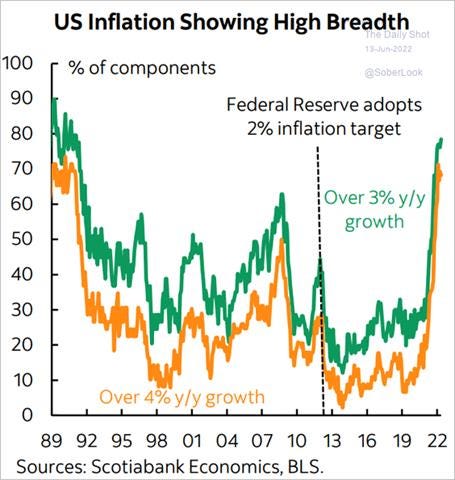
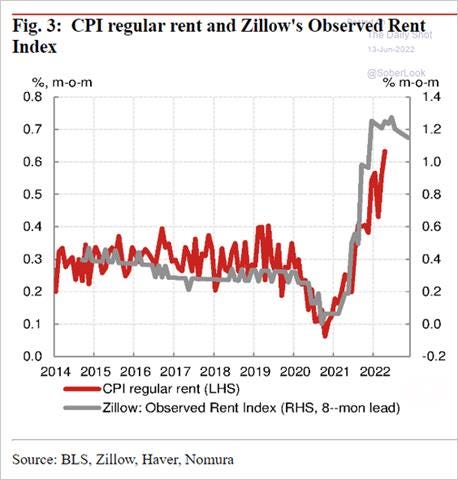
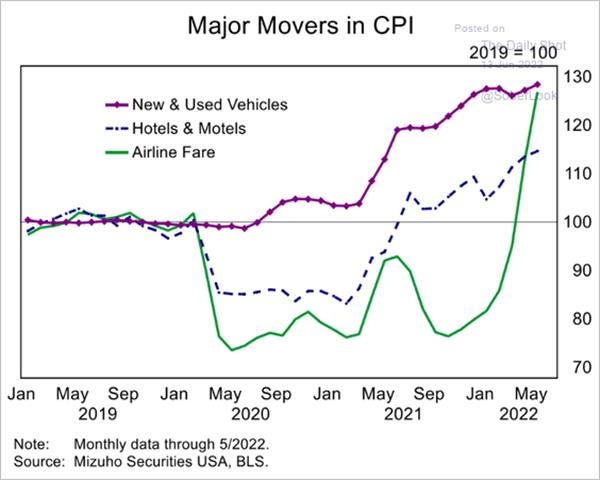
Inflation: The current tax that higher prices are having on consumers continues to grow, as made evident by last week's stronger than expected CPI data, which showed no material peaking. Instead, an intense, persistent, and broad inflation pulse continues for much longer than initially thought, helped by recent energy and food cost increases. Although there are signs “goods” orientated inflation has peaked, which contributes a larger percentage of components/weight to the overall CPI/PCE price indexes, shelter costs are still expected to increase due to rising rents, while service costs were recently pressured by increased “going out” demand (for travel, leisure, and hospitality) and higher fuel cost inputs. We question how strong and long both rent increases and discretionary service demand can continue, given the demand destruction price increases should have (as well as the passing of the re-opening and returning to work). Still, for now, landlords and “re-opening” orientated service providers have enjoyed strong pricing power.
*The breadth of inflation continues to grow, with 64% of components in May seeing a +6% annualized one-month gain
*Although we believe rent pressures have peaked, given the move back to urban areas should be fading while the catch-up many landlords played after two years of a moratorium is running its course, sell-side expectations see it as a continued pressure to core inflation
*The gains in airfare and leisure and hospitality will likely fade as consumers retrench their discretionary service spending due to rising prices there, while improvements in supply chain impairments and higher financing costs may improve the supply/demand mismatch in autos
Supply Chain Pressures: Shortages of materials and components persist, and every day seems to bring new stories of missing consumer products, with hipster girls in Brooklyn now short on sriracha and feminine goods. Signs of improvements into Q1 following last year's sizeable holiday inventory build were quickly squashed by geopolitical developments and lockdowns in China. Currently, there are ongoing labor negotiations with the West Coast Longshore and Warehouse Union, who are seizing their moment and trying to fight further automation of the ports they work at, while truckers in South Korea are on strike due to higher fuel costs. Relief may be coming as shipping lead times and trucking demand are falling as companies order fewer goods due to higher inventories and growing demand uncertainty. Business surveys are confirming this trend should continue, reducing cost-push inflationary pressures. However, historically speaking, supply chains are still not normal.
*Oxford Economics U.S. supply chain stress tracker is showing some peaking in impairments with activity and transportation components falling
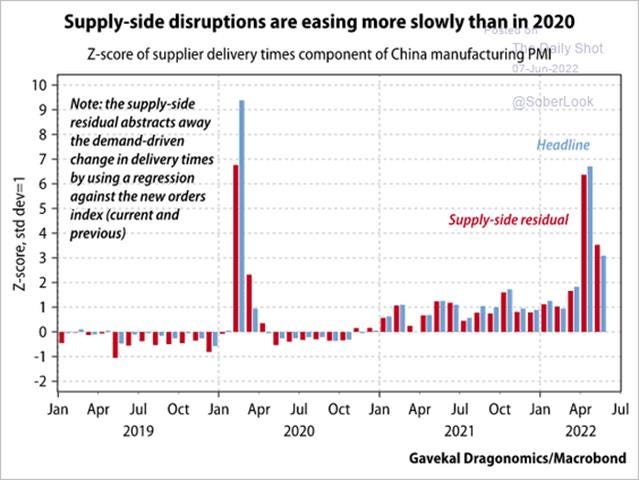
*Although easing, the disruptions that China's zero-Covid policy caused are sticker than the initial pandemic outbreak
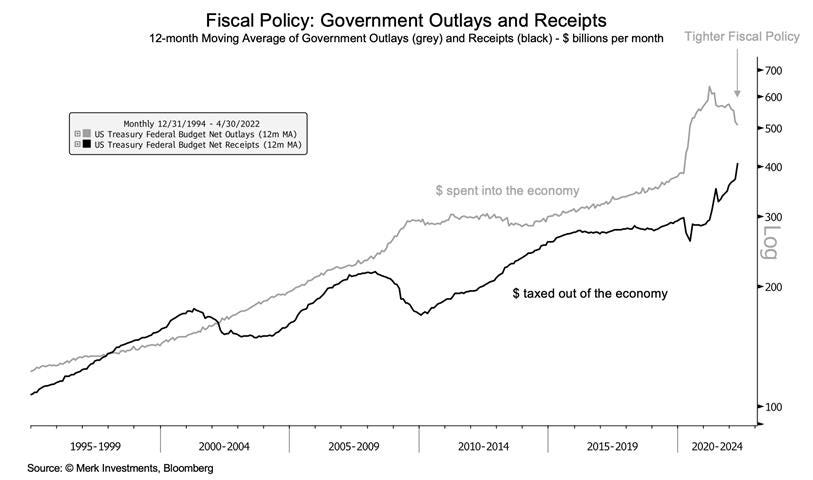
Tightening Policy: Both fiscal and monetary policies in the U.S. is currently tightening, removing liquidity, and weighing on consumption/activity. On the fiscal front, the CBO expects the U.S. deficit to shrink by an estimated $1 trillion this fiscal year due to surges in tax receipts. Not to dive too deeply into Modern Monetary Theory, but that’s one trillion of spending power removed from U.S. consumers and firms. Turning to monetary policy, long-time readers are well aware of the effects that higher Fed policy rates have as well as the reduced liquidity a shrinking Fed balance sheet produces. It is no coincidence that forward guidance (telegraphing the Fed’s intention to normalize policy), which began in earnest last spring/summer, coincided with the peak in speculative assets like crypto, Spacs, and Meme stocks and began the now feverish rise in rates across the Treasury curve. Despite the significant financial tightening that has already occurred due to forward guidance, the actual real channel effects of a shrinking monetary base and higher financing costs are still coming, meaning, when coupled with a tighter fiscal policy, this dual policy front will be a headwind to economic growth and financial asset liquidity (reducing earnings growth and multiples) for some time still.
*Unprecedented levels of fiscal support are reversing while tax receipts have shot up, bringing both back towards their longer-term trend lines
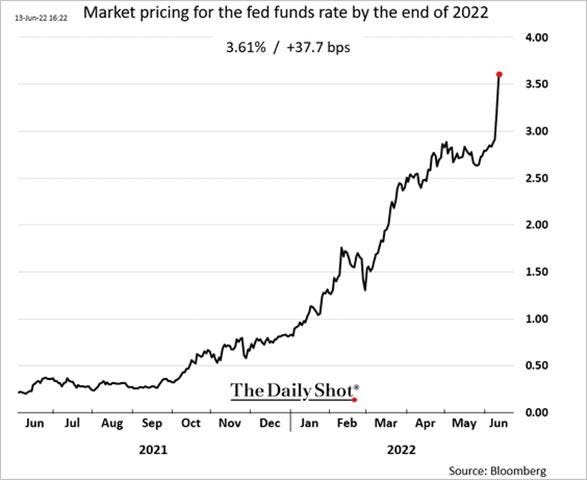
*After last week’s hotter-than-expected CPI print and a WSJ article by a perceived Fed mouthpiece, the market has increased its expectations for a 75bp hike in June (and July) while also raising the overall level of hikes this year
*Fed officials have noted the tightening in financial conditions as a positive development resulting from their forward guidance, but many still see it as too loose given the persistent inflationary pulse
China Slowdown: China’s economy is teetering on the brink of contraction this quarter, with economic data for May likely to show little improvement from the previous month as Covid restrictions, a housing slump, and weak demand more generally continue to weigh on growth heavily. The persistence of the zero-Covid policy also keeps a “stop and start” nature to activity, increasing uncertainty and reducing the ability of consumers and firms to plan for the future. In short, the usual global growth driver has become completely derailed. Worse, the ripple effects of production and shipping closures have renewed pressures on global supply chains and inflation. Beijing has committed to getting its economy back on track through a long list of fiscal initiatives while slightly easing monetary policy, but the damage that has been done from the lockdowns coupled with pre-existing weakness from their common prosperity regulatory crackdowns and wish-washy response to supporting the property sector means there is a big hole to dig out of. The good news is that there will eventually be a better (mRNA) vaccine by year-end, and the wide array of supportive measures will increasingly take hold in the second half of the year, likely meaning the worse is over given no further shocks.
*The lockdowns and subsequent crash in activity are almost unfathomable to Western minds showing just how different an authoritarian centrally controlled economy operates; however, this also means restarting it may occur quicker
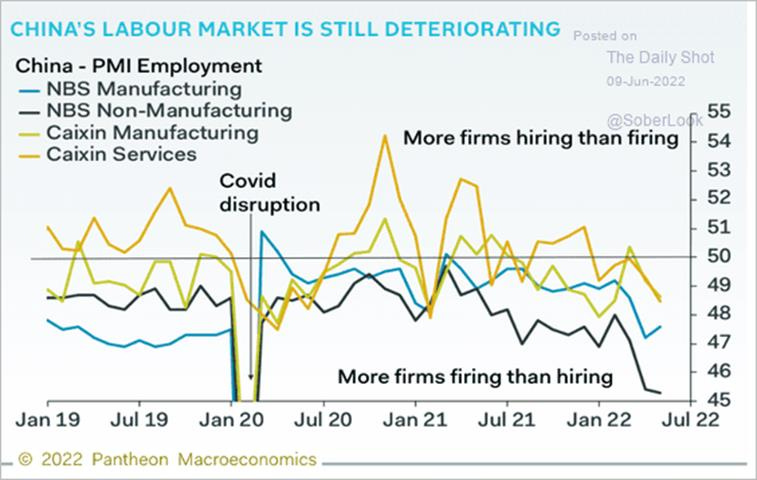
*Social unrest is heavily connected to unemployment, especially among younger citizens, and the rise in the unemployment rate this year will continue to be a primary driver of Beijing's policy easing
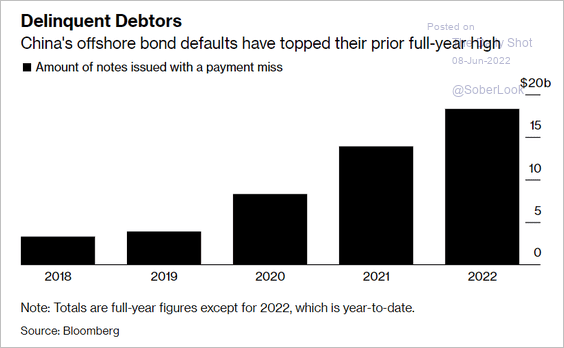
*The PBOC is still committed to keeping the macro leverage rate in check, limiting the actions that will be taken there while municipalities and private sector participants are being urged to allow troubled borrowers to refinance/restructure existing debt at less punitive costs; however, defaults continue to rise
The U.S. Housing Market: Activity in the housing market, whether as seen in purchases or construction activity, is slowing much quicker than anticipated this year. Affordability is increasingly problematic as higher prices and rising mortgage rates have effectively removed lower/middle-income and first-time homebuyers from the market. Low inventory levels (and record levels of permits and starts) will likely keep construction activity from meaningfully deteriorating for some time, helped by reduced supply-side shortages/impairments. However, things are clearly cooling, bringing into question how positive housing activity will be on overall economic growth in the U.S. moving forward. However, the situation is far from the days of the GFC, when borrowers were unable to make mortgage payments and found themselves increasingly underwater (negative equity). This gives us some comfort that, although a reduced growth driver, there will be a limit to how bad a slowing housing market can get.
*Purchase activity has hit a (dry?) wall, as would-be buyers have become more price-sensitive due to a reduced urgency to move from changes in lifestyle brought on by the pandemic
*Housing activity is far from recessionary levels, but current sales, buyer traffic, and sales expectations, the three sub-components of the NAHB Housing Market Index, fell heavily in May
*The quality of mortgage borrowers is much stronger than in the past due to tighter regulation and some self-restraint on the part of lenders, leaving less risk of a detrimental consumer credit cycle to occur moving forward
*The U.S. homeowner has just experienced two years of historic gains, leaving them with the highest level of housing equity ever seen and helping to buffer losses to their net worth due to drops in financial assets
In summary, inflation and subsequently the level of policy tightening coming, as well as the U.S. housing market, are worsening “bad” macro factors, although to different degrees. At the same time, supply chains and Chinese growth are likely to improve in the second half of this year. Overall, “the bad” is likely to remain generally bad for some time still. Given that things are moving fast in markets (due to poor liquidity and historically low investor sentiment), any negative news that may lead to tighter financial conditions is being seen as a reason to de-risk/gross further. Furthermore, the buy the dip mentality is effectively dead at current levels, with the S&P not likely to find that support until below 3500. Treasury yields are defying gravity despite the growing worries of a recession. A lot of the price action does not add up, but here we are. The bottom line, remain patient, hold cash, and wait for energy prices to capitulate, reducing inflationary pressures and hence policy tightening expectations. This will finally (likely towards the end of Q3, in our opinion) allow an actual base/new upward channel/range in risk assets to form.
*Things sure aren’t adding up (and often don’t) with cross-asset price/correlation break-downs flashing red, indicating the knife is still falling
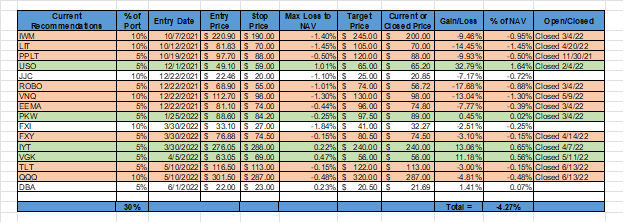
*How quickly things changed with the price action since last Thursday stopping us out of our long-end Treasury and Nasdaq longs while our copper and China equity longs also took a sizeable hit, leading our mock portfolio to be down -4.27%
Econ Data:
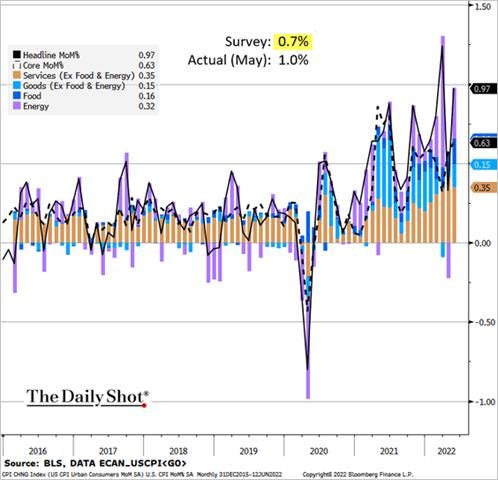
Headline consumer prices jumped 1% in May, after rising 0.3% in April and much higher than forecasts of 0.7%. The Core CPI index rose 0.6% MoM, the same as in the previous month and slightly higher than market expectations of 0.5%. Shelter costs rose 0.6% on higher rents (0.6%) and lodging away from home prices (0.9%). Airfares soared 12.6%, used car prices rose 1.8%, and new car prices rose 1.0%. Turning to the headline components, monthly gains in gasoline (4.1%) and food (1.2%) were notable.
Why it Matters: There was no sign of a deceleration in inflation based on the May CPI report. Over the last three months, the core CPI has risen 6.3% at an annualized rate, faster than its year-over-year increase of 6.0%. The headline CPI is up an annualized 10.7% over the last three months. The gains were very broad-based, and although the core CPI inflation slowed to 6.0% YoY in May from 6.2% in April, 64% of the 84 CPI components saw one‐month annualized gains of 6% or greater in May.
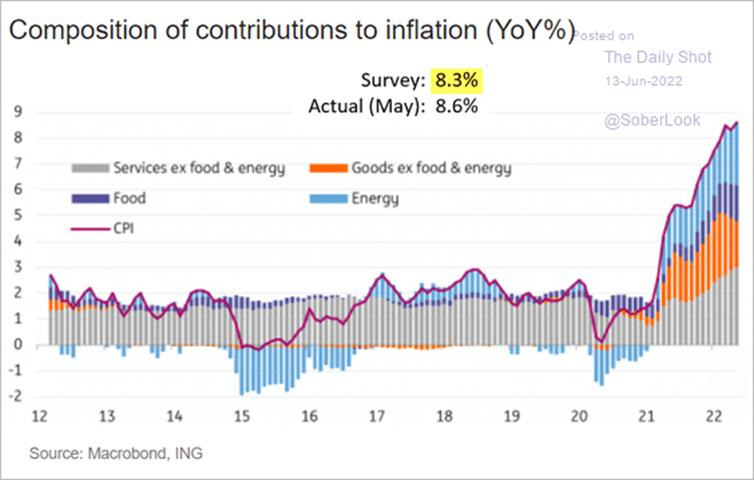
*Increases in Energy and Food were the main driver in the greater than expected rise in Headline Inflation in May as Services were mildly higher and Goods fell again.
*A more detailed look at the monthly gains showed increases in service sector inflation actually cooled slightly in its contribution to headline while energy reversed negative gains seen last month
*Owners’ Equivalent rent continues to trend higher, driving the shelter component of CPI to above 0.6% on the month
*How things have changed in a year with the Fed’s inflation dashboard showing that the broad “measures of underlying inflation” it looks at are all safely above their target
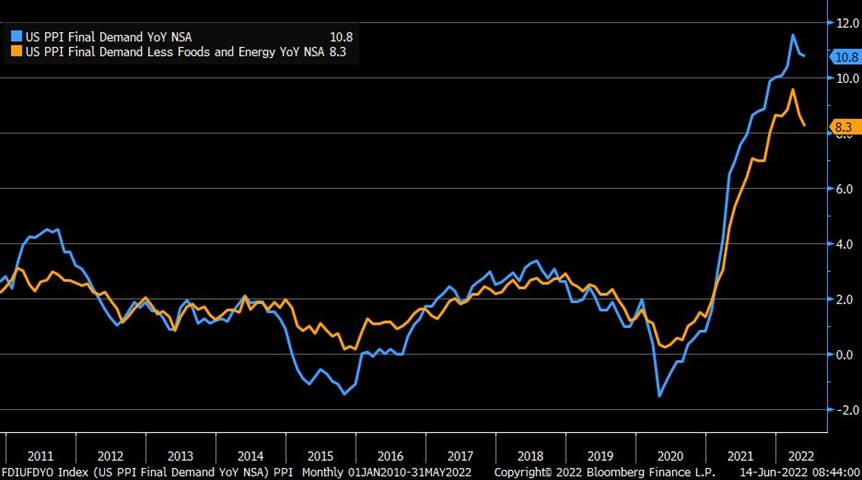
Producer prices increased 0.8% in May, following a 0.4% rise in April and matching forecasts. This brought the annual rate down to 10.8% from 10.9% in April. Core PPI increased to 0.5% from 0.2% in April, moving the annual rate down to 8.3% from 8.6%. Final Demand Goods increased 1.4% due to a 5% rise in Energy, contributing 70% of the increase. Final Demand Services increased by 0.4%, mainly due to a 2.9% rise in Transportation and Warehousing. Processed goods rose 2.3% MoM, driven by energy goods, higher by 21.6% YoY, while Unprocessed goods rose 6.3% MoM, again mainly due to energy, higher by 48% YoY. Interestingly unprocessed nonfood materials less energy declined by -4.2%.
Why it Matters: It is all about rising energy costs, and this PPI report confirmed that it is now the primary driver of inflationary pressures, as seen in the data. Although both the year-on-year gains for headline and core levels slowed, the three-month annualized gains are running faster than the twelve-month gains. Monthly gains for both processed (+2.3%) and unprocessed (+6.3%) goods rose sharply due to the energy goods/material component. We take some comfort in the decrease in unprocessed goods that are not food or energy-related, showing the beginning of the production pipeline for goods is cooling. Again the Fed is supposed to look through increases in food and energy, and last week’s CPI report and today’s PPI data are increasingly being dragged up by the two.
*Slight decrease in headline and core PPI even though energy-related pressures continued to be apparent across the report
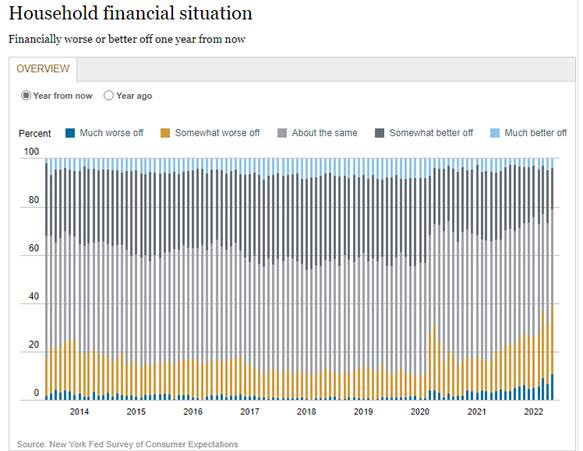
The New York Fed’s Consumer Expectation Survey showed inflation and spending expectations for one and three years ahead rose in May. The one-year-ahead inflation expectation increased to 6.6%, up from 6.3% in April. At the three-year horizon, inflation expectations were unchanged at 3.9%. The one-year-ahead earnings growth expectations remained unchanged for the fifth consecutive month at its series high of 3.0%, but expectations that the future unemployment rate will rise grew. Household spending expectations over the next year rose by 1.0 percentage points to reach 9.0%, a new series high. The median one-year-ahead home price expectation came in at 5.8%, down from 6.0% in April. Credit access perceptions (relative to a year ago) and expectations (one year from now) both deteriorated notably. Perceptions about households’ current financial situations deteriorated noticeably, with more respondents reporting they are financially worse off today than a year ago.
Why it Matters: The weight of continued high inflation and the uncertainty of the (geo)political backdrop was increasingly apparent in May’s Consumer Expectation survey. On the positive side, there is still confidence that the labor market will remain strong and household income will be little changed a year ahead. However, inflation expectations picked up at the one-year-ahead mark, something the Fed will take note of, given that was also seen in the University of Michigan survey. Consumers also seemed to indicate that they were prepared to meet the challenges of higher prices with higher expectations for spending growth. Weaker credit availability and views that would worsen do not bode well for housing or other big-ticket item financing/demand.
*Consumers look to be accepting that inflation will be persistent a year or so longer but have yet to change their three-year outlook meaningfully.
*The “Somewhat worse off” and “Much worse off” expectations one year from now expectations are creeping higher, showing “confidence” is falling in the economy
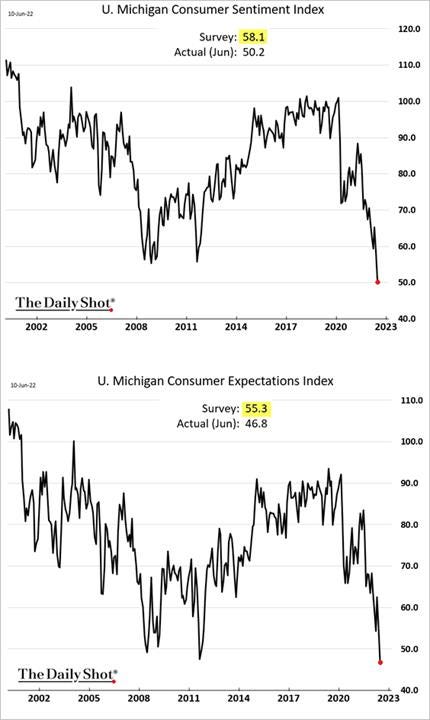
The University of Michigan’s consumer sentiment fell sharply to a record low of 50.2 in June, well below market forecasts of 58, preliminary figures showed. The Current Economic Conditions subindex sank to an all-time low of 55.4 (vs. 63.3 in May), and the Expectations subindex plunged to 46.8, the lowest since May of 1980. Consumers' assessments of their personal financial situation worsened by about 20%. Consumer increasingly attributed their negative views to inflation, with 46% now siting that as the primary reason, the biggest share since 1981. Inflation expectations for the year ahead went up to 5.4% from 5.3% and the 5-year outlook to 3.3%, the highest since June of 2008. Consumers expect gas prices to continue to rise a median of 25 cents over the next year, more than double the May reading.
Why it Matters: There were double-digit percentage declines in the overall and the two subindexes with inflation, especially gas price increases, continuing to drive sentiment lower. The much larger than expected drops show the continued broad price increases, and a lack of confidence the end is near, as seen by increases in inflation expectations, has the consumer further entrenched in negative sentiment. Consumers also continued to “spontaneously” mention supply shortages for the ninth consecutive month. The featured chart was “Expected Change in Real Income Over the Next Year,” something that is dropping like a rock but still above levels seen during the GFC.
*The overall sentiment index dropped much more than expected, with the Expectations Index falling to levels not seen since 1980, mainly due to growing concerns regarding inflation
*Weakening sentiment (Overall, Current, Expectations) have increasingly been driven by Independent and Democrat-leaning voters, given Republicans were already at low levels
Technicals and Charts:
Four Key Macro House Charts:
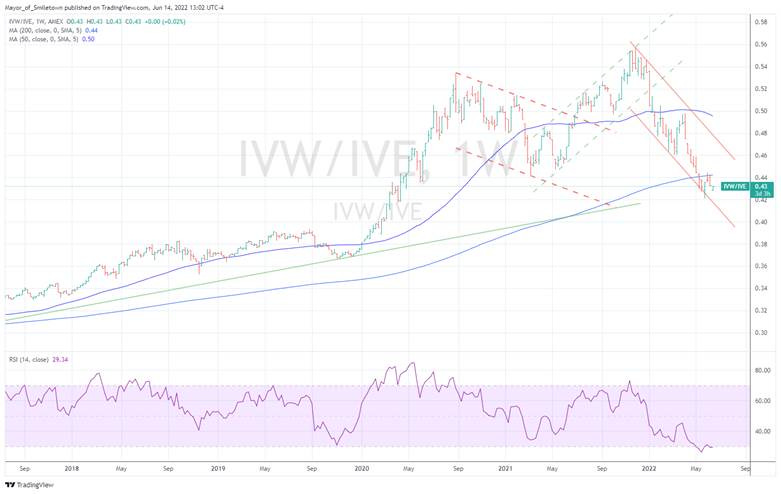
Growth/Value Ratio: Growth is higher on the day and the week. Large-Cap Growth is the best performing size/factor on the day
Chinese Iron Ore Future Price: Iron Ore futures are lower on the day and the week, with steel inventories higher in June so far while Goldman predicts the worst may be over for the property sector
5yr-30yr Treasury Spread: The curve is little changed on the day and flatter on the week, with last week's inflation data increasing rate hike expectations, sending the front of the curve notably higher
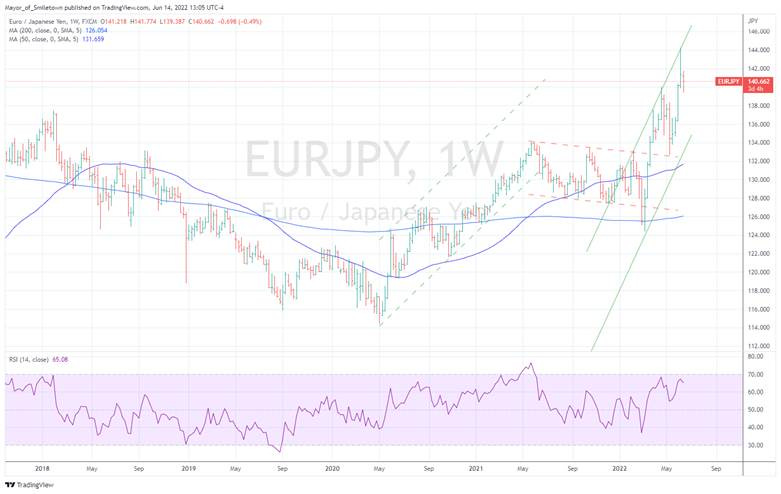
EUR/JPY FX Cross: The Euro is higher on the day but lower on the week as last week’s ECB meeting led to Euro weakness while BooJ’s Kuroda is facing mounting leadership concerns
Other Charts:
Small-caps are becoming historically cheap based on expected forward earnings, although these earning forecasts are likely to still fall through the second half of this year.
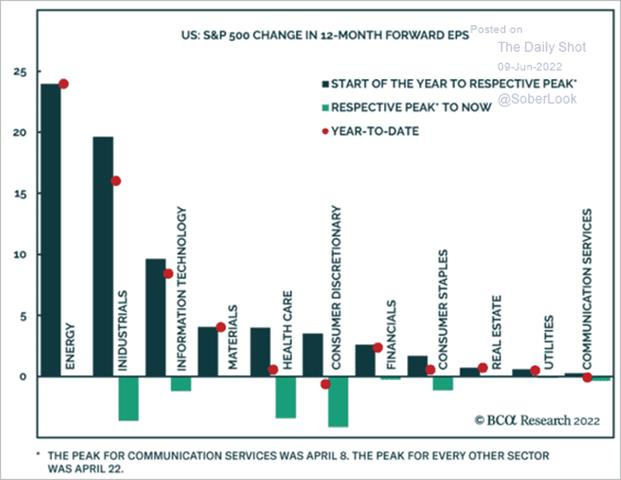
Forward earnings expectations are increasingly falling as the persistence of high inflation and growing expectations that the Fed will have to tighten policy enough to meaningfully slow growth will weigh on earnings, but we are not near the bottom here.
Although the outlook for the stock market is dropping hard, current allocations are not yet falling, according to the University of Michigan's Consumer Survey report.
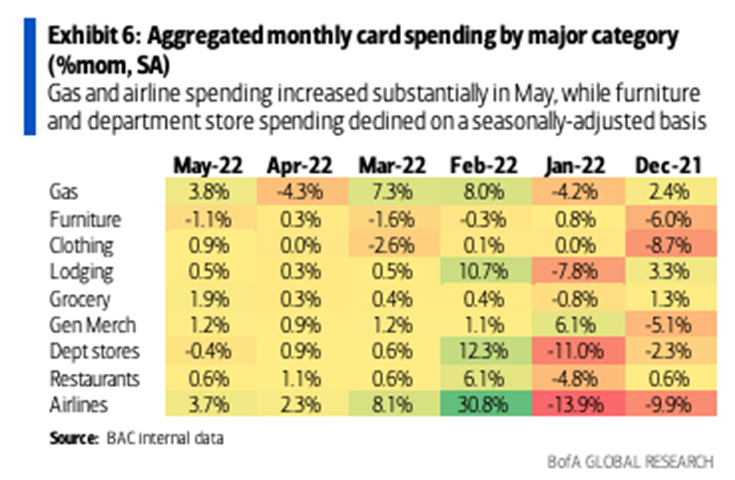
Speaking of consumers, spending on Gas and Groceries picked up (as expected) based on BofA credit card data, while Memorial Day holiday activity also saw a rise in travel and leisure activity.
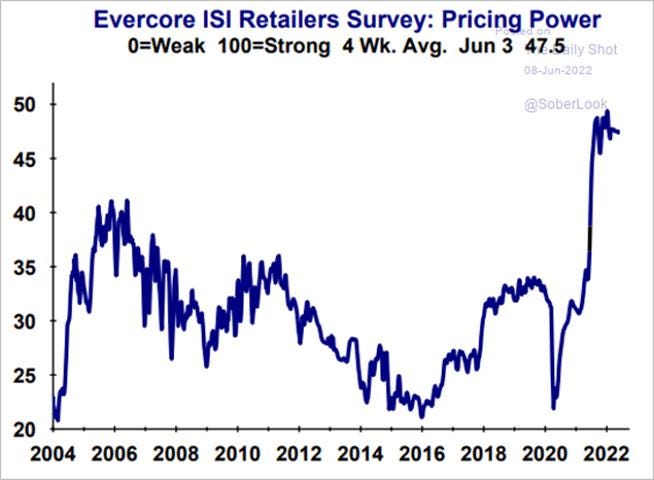
Retailers are still reporting they have strong pricing power, according to a recent Evercore ISI survey
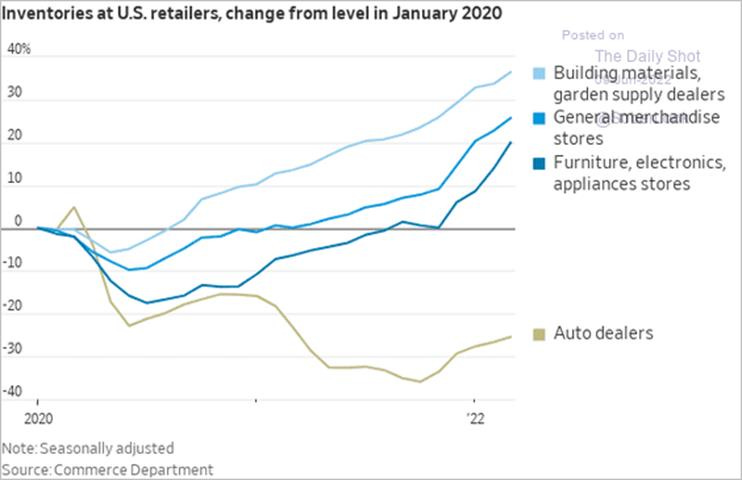
Mainly discretionary goods will increasingly become a deflationary force in the second half of the year as retailers find their inventory levels potentially too high (accept auto dealers).
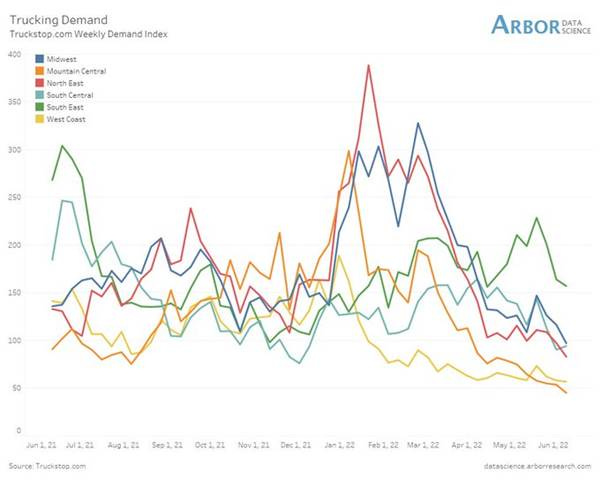
As a result of better inventory levels (reduced urgency) and the shift from discretionary goods to services, trucking demand is falling
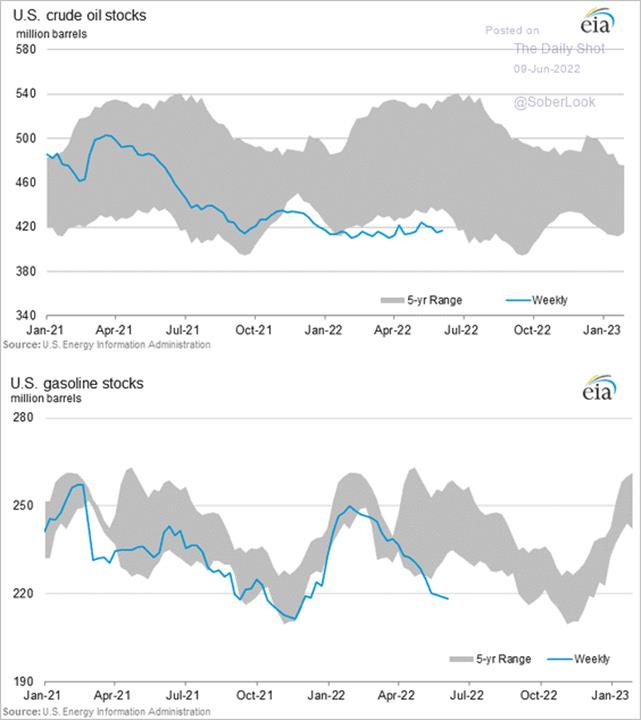
Both crude and gasoline stocks/inventories are below their 5yr-ranges as investors have are increasingly accepting that the U.S. production (majors & shale) growth won’t beat expectations, there is little OPEC+ spare capacity, while the downward trend in refining capacity has been the key contributor to the shortage of fuels.
The U.S. (and the world) hasn’t invested enough in maintaining or adding refineries, leading to significant gaps between the price of oil and gasoline.
China is happily buying discounted Ural oil (-$30 to -$40 a barrel) from Russia, throwing the trade balance off this year. With a solid domestic oil inventory, access to cheaper oil, and refiners eager to export, China may increasingly be a supplier of fuels in the second half of the year.
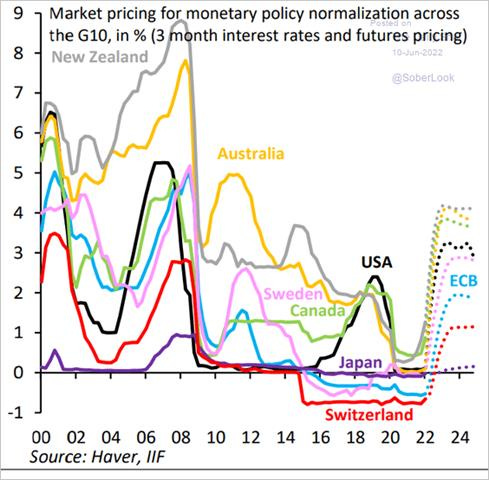
Central banks are certainly behind the curve, with the ECB one of the worst, prompting the formal announcement of a regime change last week and expectations for an increased pace of hiking to begin in September if inflation pressures don’t fall.
Market pricing for rate hikes has gone parabolic into next year, where expectations are growing for cuts to begin near the 2023 year-end, and then there is the BoJ.
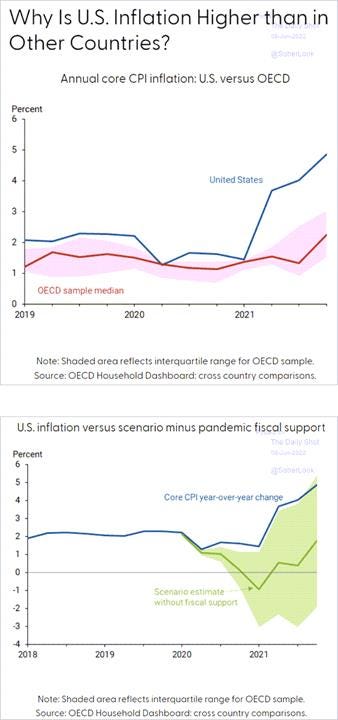
Massive levels of fiscal and monetary policy stimulus contributed to why the U.S. is above levels of inflation seen elsewhere.
Article by Macro Themes:
Medium-term Themes:
Real Supply-Side Situation:
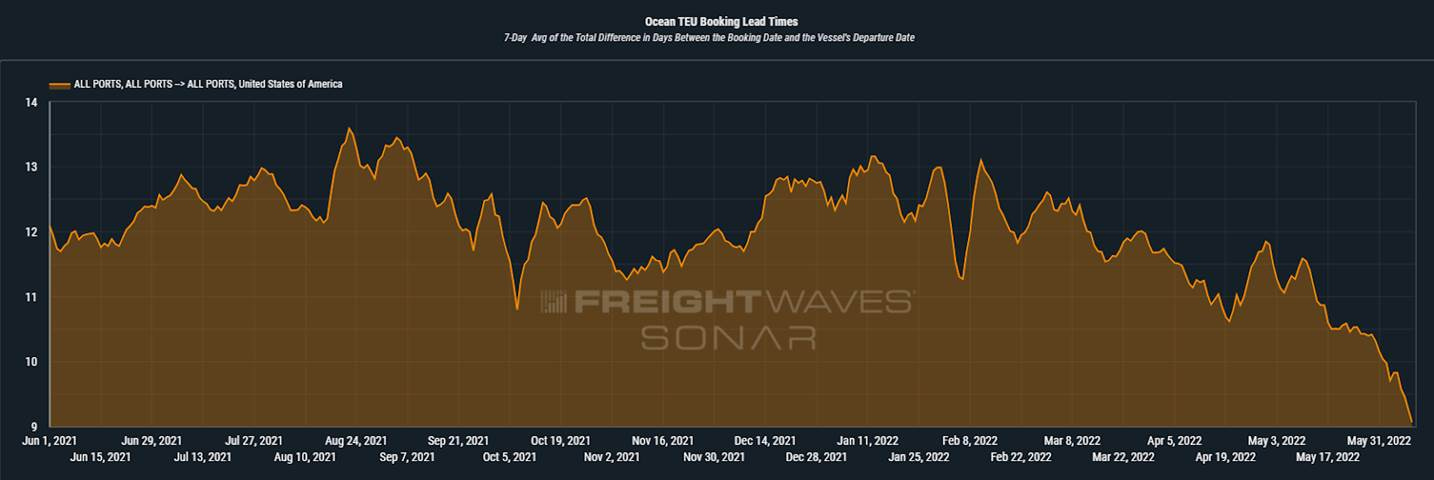
Dropping: Order lead times plummet as inventories grow and demand uncertainty soars - FreightWaves
Order lead times, the time between order placement and expected ship date for containerized imports, have dropped 23% since late April as supply chain managers are forced to change their strategy in an economic environment that is once again in a transitional state. Further, near-real-time data like tender volumes (OTVI) and the monthly reported Logistics Managers’ Index that measures inventory growth, are showing that shippers are slowing down domestic transportation shipping due in part to record inventory growth that started in January and increased future demand uncertainty.
Why it Matters:
Pairing the current demand-side uncertainty with production and supply inconsistencies, like the recent/potential for shutdowns in Shanghai, and you have a supply chain management hellscape continuing. The global environment has become riddled with “black swan” relatively unpredictable events, especially in the long term. Even if you can predict them, their economic impacts are even more uncertain. The only real solution is to become more flexible, which is what you see reflected in the import lead times. With inventories being elevated, companies have some buffer in the way they can make smaller, more frequent orders, which is increasingly happening.
China Macroprudential and Political Loosening:
Chip Decoupling: China’s Chipmaking Power Grows Despite US Effort to Counter It - Bloomberg
Chinese orders for chip-manufacturing equipment from overseas suppliers rose 58% in 2021, making it the biggest market for those products for a second year running, according to data provided by industry body Semi. Even in a year when worldwide bookings for equipment from the likes of US-based Applied Materials Inc. and Japan’s Tokyo Electron Ltd. climbed 44%, fueled by a global surge in chip demand, the growth of China’s chipmaking industry far outpaced other regions.
Why it Matters:
While those figures appeared in April, the flood of machinery headed to China is now drawing more attention, especially as a legislative push to bolster the US chip industry with investments and incentives falters. The U.S. Commerce Department, meanwhile, appears unwilling to crack down harder on Beijing, irking critics by saying it’s so far found nothing other than normal market forces at play. The department has enforced bans on some supply to Chinese companies listed as a threat to national security, including Semiconductor Manufacturing International Corp. But it’s avoiding dabbling in industrial policy beyond that.
Longer-term Themes:
National Security Assets in a Multipolar World:
More?: Lawmakers Make Bipartisan Push for New Government Powers to Block U.S. Investments in China - WSJ
Congress is pressing ahead with legislation that could rewrite the rules for American companies investing abroad, proposing the screening of investments in countries like China to protect U.S. technologies and rebuild critical supply chains. The measure, part of broader legislation to bolster U.S. competitiveness with China, would require American companies and investors to disclose certain new outbound investments and authorize the executive branch to form a new interagency panel to review and block investments on national security grounds.
Why it Matters:
While the U.S. has for decades regulated foreign investment in U.S. entities and limited American companies’ exports of sensitive technologies abroad for national security, the new bill expands the federal government’s purview over Americans’ investment activities overseas.The revised screening measure would enable the federal government to restrict certain future transactions in any “country of concern,” defined as “foreign adversary” countries like China. The text says that the provisions would apply to greenfield investments, such as the construction of new plants and joint ventures involving the transfer of knowledge or intellectual property, and to capital contributions including venture capital and private equity transactions. The U.S.’s intellectual property regarding critical technologies continues to be a vital national security asset, allowing it leverage over Beijing’s “Wolf Warrior” ambitions.
Electrification and Digitalization Policy:
Election Season: Ransomware, botnets could plague 2022 midterms, NSA cyber director says – The Record
The National Security Agency is concerned that ransomware and botnet attacks could be used in the upcoming midterms to erode further the confidence that the U.S. can conduct safe and secure elections. “For us, we are worried about both ransomware and botnets because that’s in our technical lane,” NSA Director of Cybersecurity Rob Joyce told reporters during a roundtable at the RSA conference. Last month, the NSA and U.S. Cyber Command revealed new leaders of a joint election security task force that will work to protect the midterms against foreign interference.
Why it Matters:
Joyce noted that NSA and Cyber Command are “background players” to the Cybersecurity and Infrastructure Security Agency (CISA), which is responsible for securing the country’s voting infrastructure, and the FBI, which tackles disinformation operations. “The worry in all of the election security is trust and confidence that we’ve delivered a safe and secure election,” Joyce noted, going on to say, “if elections are subject to ransomware, or if there’s a botnet that runs a denial of service, what you’ll find is that’s probably going to, in this day and age… escalate and be an issue of trust.” Furthermore, the somber assessment from the NSA comes as Republican members of Congress and candidates at the federal, state and local levels continue to push unfounded claims that the 2020 presidential election was stolen, already undermining confidence in our voting process
Progress?: Congress is actually taking a go at a real privacy bill – Protocol
Three top congressional negotiators working on privacy have released a draft bill requiring companies to collect the least amount of data necessary to provide a service, end ad-targeting to kids up to age 16, and mandate annual civil rights assessments of algorithms used by the largest companies. In addition, the draft would allow users to opt out of targeted advertising and permit individuals to sue over certain prohibited data uses. While it would also overrule many state privacy provisions, the draft bill would dramatically increase the Federal Trade Commission's power to make rules in certain areas of privacy.
Why it Matters:
The draft bill, known as the American Data Privacy and Protection Act, represents a bipartisan, bicameral agreement after years of stalled talks on data protection. It also lays out compromises on issues, such as lawsuits, that had stymied lawmakers even as industry, consumer groups, and political leadership pushed Congress to act. Despite the existing bipartisan agreement, the proposal still faces significant hurdles to becoming law this year. Foremost among them: It does not have a sign-on from Democratic Sen. Maria Cantwell, who chairs the Senate Commerce Committee and is the most powerful legislator in the process.
Commodity Super Cycle Green.0:
Beginnings: Port of Rotterdam to start green hydrogen trial – Port Technology
The Port of Rotterdam has scheduled a trial for green hydrogen production at the Sif factory on the Maasvlakte for 2023. Called the AmpHytrite project, it will consist of three phases: first, a feasibility study into offshore off-grid production of green hydrogen; a second phase to develop and build a production unit that will be placed near the Sif factory on the Maasvlakte; and third the project will see a scaling-up phase to apply the concept on a full scale in a wind farm at sea.
Why it Matters:
The Port of Rotterdam recently announced several other projects on the horizon in its mission to achieve sustainability across the maritime industry; these include a new battery recycling factory in cooperation with TES and a new plastic recycling plant arriving by the end of 2022. We highlight the beginning of this project as an example of the maritime industry further moving from blue hydrogen projects to pure green ones.
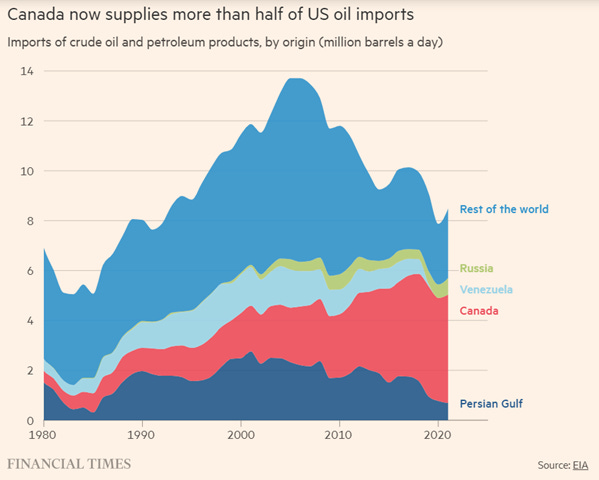
Not Green: Canada’s oil sands: why some of the world’s dirtiest fuel is now in hot demand – FT
Jason Kenney, Alberta’s premier, says Russia’s invasion of Ukraine has triggered new anxiety about energy security that offers “perverse vindication” for the province and its controversial oil sands sector. Political hostility is beginning to soften as leaders are “mugged by reality,” he says. “We’ve been saying all along — we cannot allow some of the world’s worst regimes to have a dominant role in global energy markets.” Yet, even if the political winds are changing, there is a bigger test facing the oil sands: whether its operations can be greened sufficiently to remain viable in a future that may demand much less oil, and certainly a lot less carbon.
Why it Matters:
The Canadian government is cracking down on emissions as part of its pledges toward international climate goals. For the country’s oil and gas sector, it is calling for a 42 percent emissions cut from 2019 levels by 2030. An escalating carbon tax is already in place, priced at C$50 per tonne now and due to rise to C$170 by 2030. Decarbonising Alberta’s oil industry will take some doing — and a lot of money. The first phase of the producers’ plan involves building the world’s most ambitious carbon capture and storage facility. Much else will follow, but once the current energy crisis inevitably passes the oil sands will go back to being the villains.
ESG Monetary and Fiscal Policy Expansion:
Transparency: Hospitals Face Penalties for First Time for Failing to Make Prices Public -WSJ
Two Georgia hospitals on Wednesday were hit with federal financial penalties for failing to disclose their prices, marking the first such enforcement action taken under federal rules that have met with uneven compliance since taking effect in January 2021. The fines are the first to be issued, and the two hospitals, which are owned by Northside Hospital, will face penalties totaling roughly $1.1 million.
Why it Matters:
Research has shown that thousands of U.S. hospitals remained out of compliance months after the rules took effect. Only 6% of more than 5,200 U.S. hospitals displayed both of the two required price lists when the hospitals’ websites were evaluated between July and September 2021, according to an analysis of hospital transparency compliance published this month in the Journal of the American Medical Association. The study found that roughly 14% of hospitals had posted only the comprehensive list, while roughly 30% had posted only the file with shoppable prices.
Dealing: The U.S., Latin American Countries to Pledge to Take In More Migrants – WSJ
The Biden administration is signing a migration agreement with Latin American nations that would mark a shift in the approach countries take to refugees and migrants amid unprecedented movement across the region. President Biden is hosting the Summit of the Americas, which is focused on economic, climate, and migration issues. He has thus far laid out an economic-recovery agenda in the aftermath of the pandemic that he said aims to include mobilizing investments in the region, making supply chains more resilient, and pushing for more clean-energy jobs and more-inclusive trade relations among the countries.
Why it Matters:
The goal of the agreement, which will formally be known as the Los Angeles Declaration on Migration and Protection, on the part of the U.S. and other large countries is to have more Western Hemisphere countries accept migrants either temporarily or permanently to help share the burden. Until recently, the U.S. has declined to negotiate with foreign countries over its immigration policy, insisting that decisions about who to admit should be sovereign. However, the Biden administration, which led negotiations over the agreement, has argued it is impossible to deter all migration and that countries across the region are better off offering legal immigration pathways so that inevitable migration can be better managed.
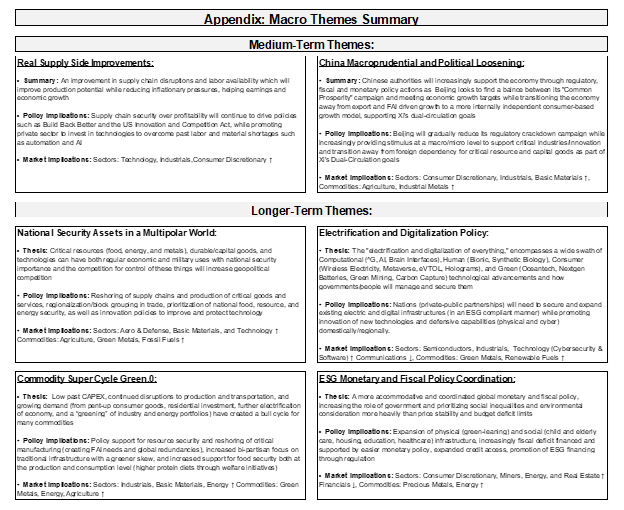
Current Macro Theme Summaries:
VIEWS EXPRESSED IN "CONTENT" ON THIS WEBSITE OR POSTED IN SOCIAL MEDIA AND OTHER PLATFORMS (COLLECTIVELY, "CONTENT DISTRIBUTION OUTLETS") ARE MY OWN. THE POSTS ARE NOT DIRECTED TO ANY INVESTORS OR POTENTIAL INVESTORS, AND DO NOT CONSTITUTE AN OFFER TO SELL -- OR A SOLICITATION OF AN OFFER TO BUY -- ANY SECURITIES, AND MAY NOT BE USED OR RELIED UPON IN EVALUATING THE MERITS OF ANY INVESTMENT.
THE CONTENT SHOULD NOT BE CONSTRUED AS OR RELIED UPON IN ANY MANNER AS INVESTMENT, LEGAL, TAX, OR OTHER ADVICE. YOU SHOULD CONSULT YOUR OWN ADVISERS AS TO LEGAL, BUSINESS, TAX, AND OTHER RELATED MATTERS CONCERNING ANY INVESTMENT. ANY PROJECTIONS, ESTIMATES, FORECASTS, TARGETS, PROSPECTS AND/OR OPINIONS EXPRESSED IN THESE MATERIALS ARE SUBJECT TO CHANGE WITHOUT NOTICE AND MAY DIFFER OR BE CONTRARY TO OPINIONS EXPRESSED BY OTHERS. ANY CHARTS PROVIDED HERE ARE FOR INFORMATIONAL PURPOSES ONLY, AND SHOULD NOT BE RELIED UPON WHEN MAKING ANY INVESTMENT DECISION. CERTAIN INFORMATION CONTAINED IN HERE HAS BEEN OBTAINED FROM THIRD-PARTY SOURCES. WHILE TAKEN FROM SOURCES BELIEVED TO BE RELIABLE, I HAVE NOT INDEPENDENTLY VERIFIED SUCH INFORMATION AND MAKES NO REPRESENTATIONS ABOUT THE ENDURING ACCURACY OF THE INFORMATION


