Midday Macro - Bi-weekly Color – 6/1/2022
Overnight and Morning Market Recap:
Price Action and Headlines:
Equities are lower, as an overnight rally quickly reversed after the NY-open due to better economic data increasing Fed tightening expectations
Treasuries are lower, with the increased tightening expectations hitting the front-end of the curve hardest, leading to a significant flattening
WTI is higher, also off overnight highs but maintaining its positive price momentum due to formalized Russian sanctions by the EU and China’s reopening so far continuing
Narrative Analysis:
Equities are lower, as the better than expected ISM Manufacturing PMI and persistent high level of job openings are being seen as negative, given better growth and a tighter job market will keep inflation going for longer, increasing the odds the Fed continues raising rates by 50bps at September’s FOMC meeting and beyond. Risk assets were already generally cooling/consolidating after last week's significant gains due to rising yields brought on by increases in energy prices as inflation worries persist, capping sentiment and reducing the likelihood of a more sustained rally. The Treasury curve is again meaningfully flattening today due to rising expectations the Fed will not be able to pause in Q4 to reassess, with the JOLTs data leading the two-year yields to rise by close to 10bps. Oil continues to be well bid while the agg complex is again under pressure due to Ukrainian wheat exports improving while U.S. planting is better than expected. Finally, the dollar is higher on the day thanks to the rise in yields, with the Euro and Yen both down close to -1% each.
The S&P is outperforming the Nasdaq and Russell with Momentum, Growth, and Low Volatility factors, and Energy, Technology, and Utilities sectors are outperforming.
@KoyfinCharts
S&P optionality strike levels have the Zero-Gamma Level at 4209 while the Call Wall is 4200. Calls continue to fill into the 4150-4250, which adds to overhead resistance, and a reduction in volatility. The market's optionality dynamics change below 4100, which likely opens up a test of 4000 and brings a general theme of higher volatility trading and wider trading ranges back.
@spotgamma
S&P technical levels have support at 4035-40, then 3985, and resistance at 4090, then 4025. The S&P went from what looked like a healthy consolidation yesterday to now breaking below key support levels, opening up the path lower. The bias is that there is still a run to 4300; but today’s price action casts doubts, given that 4090 was lost and now needs to be recaptured and held (potentially happening now), otherwise last week's +6% rally was just another short-covering bounce.
@AdamMancini4
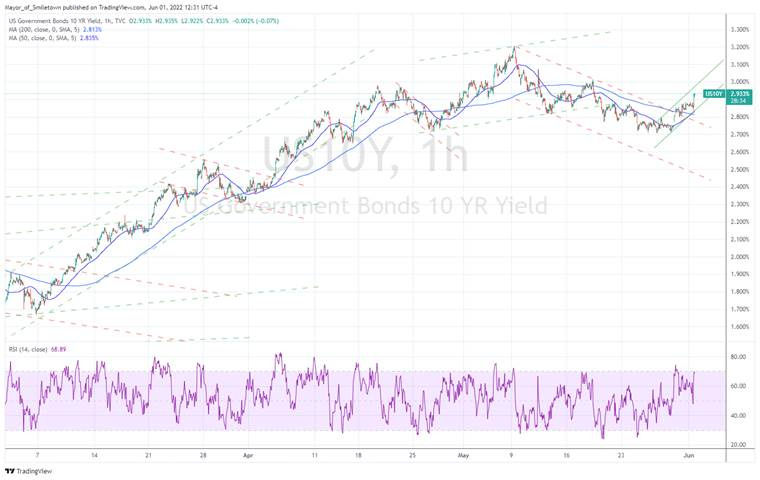
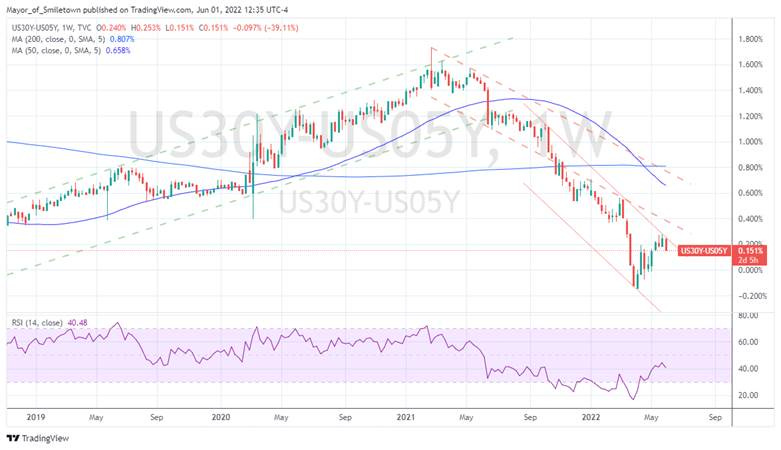
Treasuries are lower, with the 10yr yield at 2.93%, higher by around 8.3bps on the session, while the 5s30s curve is flatter by 7.5bps to 15bps.
Deeper Dive:
There is no big deeper dive today with last week’s rally now cooling as persistently high levels of job openings and quits seen in today’s JOLTs data have markets increasing the number of hikes expected this year. We see marginal signs that inflation is peaking in this week's data (so far), and subsequently, we continue to believe the Fed will not need to over-tighten and drive the economy into a recession. However, the threshold of tightening that can be taken by the economy (and by association risk assets) remains highly questionable, leaving us with a low conviction that our belief a soft landing is achievable will be widely accepted by market participants until later in Q3. The bottom line is there is a lot of negativity priced in, enticing us to be more bullish (given our outlook), but we also see few catalysts on the horizon to change that negative sentiment, keeping us cautious. With that said, we are taking today’s pullback to add to our Nasdaq long ($QQQ), increasing it to 10% from 5%. We believe growth will outperform value as Fed policy expectations, and hence future economic growth, as well as the ultimate level of financial condition tightening being targeted, further stabilizes into the fall. We are also initiating a small short on the agriculture space through the Invesco DB Agriculture Fund ($DBA). We will do a deeper dive specific to the agriculture space soon but want to enter a -5% short position today already, given our belief that an overly negative outlook there has been priced in.
*Low levels of positioning continue to insulate our portfolio from the current high level of volatility; however, it also means we missed out on last week's rally in equities
Econ Data:
The ISM Manufacturing PMI rose to 56.1 in May from 55.4 in April, beating market forecasts of 54.5. Faster increases were seen for New Orders (+1.6), Production (+0.6), and Inventories (+4.3). Price pressures eased for a second month (-2.4) while employment contracted (-1.3). Supplier Delivery Times (-1.5) also fell while New Export Orders (+0.2) were stable and Imports (-2.7) fell.
Why it Matters: A relatively positive report that showed demand increased while supply-side impairments marginally improved. As seen in lower delivery times and falling price sub-indexes, the improvement in logistics and material shortages were not echoed in the respondent comment section. “The U.S. manufacturing sector remains in a demand-driven, supply chain-constrained environment. Despite the Employment Index contracting in May, companies improved their progress in addressing moderate-term labor shortages at all tiers of the supply chain, according to Business Survey Committee respondents’ comments. Panelists reported slightly lower rates of quits compared to April. May was a second straight month of a slight easing of price expansion. Surcharge increase activity appears to be stabilizing across all industry sectors. Sentiment remained strongly optimistic regarding demand, with five positive growth comments for every cautious comment. Panelists continue to note supply chain and pricing issues as their biggest concern,” said Timothy Fiore, Chair of the Institute for Supply Management.
*Current demand continues to increase with inventory sentiment also improving, while supply-side focused sub-indexes (Prices, Supplier Delivery, and Employment) all cooled
*Comments regarding demand continued to be overwhelmingly positive, but logistical issues and shortages (exacerbated by Covid lockdowns in China) did not meaningfully improve based on the comments alone
The number of job openings in the U.S. was 11.4 million in April, down from a revised record high of 11.855 million in March, and matching market expectations. The largest decreases in job openings were in health care and social assistance (-266K), retail trade (-162K), and accommodation and food services (-113K). The largest increases were in transportation, warehousing, and utilities (+97K), nondurable goods manufacturing (+67K), and durable goods manufacturing (+53K). Some 4.4 million Americans quit their jobs in April, little changed from the prior month, leaving the quits rate unchanged at 2.9%.Layoff and discharge rates declined to tie December 2021 for a record low reading on involuntary separations.
Why it Matters: Not much change from last month, with a decrease of 400K job openings being less than what we would have liked to see. The labor market remains extremely tight, with 1.92 job openings per unemployed person at the end of April. Given the Fed’s goal of reducing labor market tightness, we see the level of job openings as a more important FOMC policy indicator than NFP, wage increases, or other labor market measures. As a result, bad is good here, with larger decreases reducing future inflationary pressure expectations as wage-spiral fears fall. We expect that to occur throughout the rest of the year based on the current demand destruction due to price increases and a weaker elasticity of demand for persistent openings, given firms learn to do more with less. This makes many openings, in our opinion, likely to never be filled. However, the JOLTs data has yet to confirm this despite increases in Challenger Job cuts and increasing announcements of corporate layoffs.
*The level of people quitting their job remains elevated, which continues to pressure wages higher, although we expect this turnover activity to slow in the second half of the year
Construction spending increased 0.2% in April, after an upwardly revised 0.3% gain in March and missing market expectations of a 0.5% advance. Spending on private construction rose 0.5%, mainly due to higher expenditure for new single-family residential construction (0.5%) and manufacturing (1.6%). Spending fell for power orientated builds (-1.5%) and commercial construction (-0.2%). Public construction outlays fell 0.7% from the previous month.
Why it Matters: Single-unit housing activity remains the primary driver of construction activity, although manufacturing-orientated construction activity continues to be strong. Elsewhere, non-residential activity slowed in April, made worse by public construction activity.
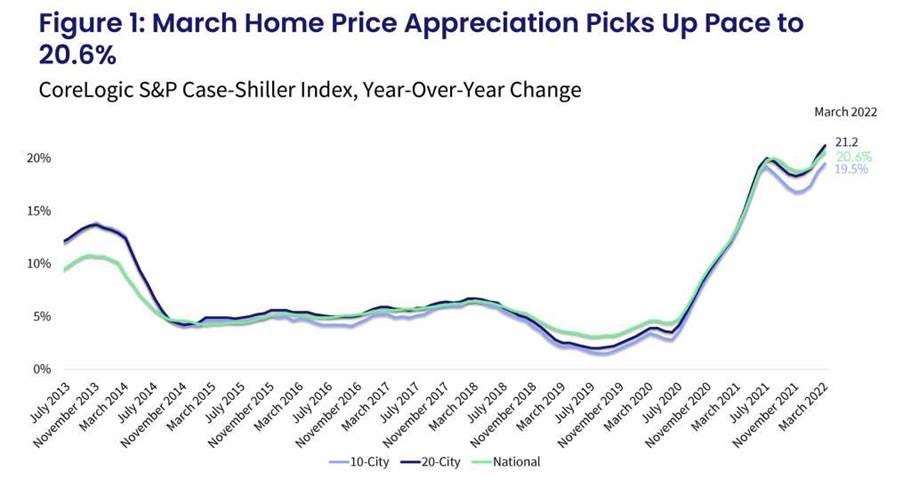
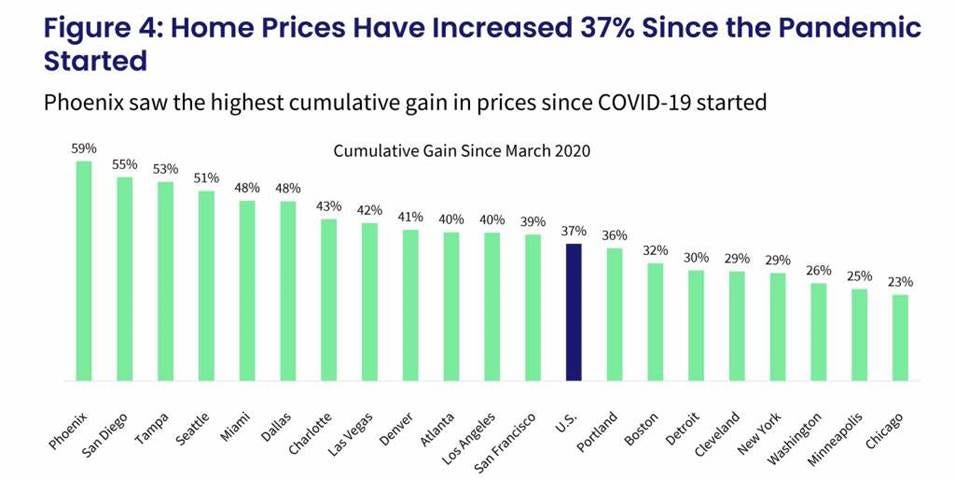
The S&P CoreLogic Case-Shiller 20-city home price index increased 3.1% in March, driving the annual increase to 21.2%, a new record high, above market forecasts of 20% and following a 20.3% rise in February. All 20 cities saw double-digit price increases for the 12 months ended in March, and price growth in 17 cities accelerated relative to February's report. For the first time in nearly three years, prices in Tampa (34.8%) grew quicker than in Phoenix (32.4%) and Miami (32%).
Why it Matters: The March monthly housing price appreciation is likely the peak as house buying activity in more recent data is showing a deceleration. Higher mortgage rates, rising inventories, and reduced urgency on the part of buyers while sellers are lowering asks (as they sense a change in the environment) should all pressure prices moving forward. "Mortgages are becoming more expensive as the Federal Reserve has begun to ratchet up interest rates, suggesting that the macroeconomic environment may not support extraordinary home price growth for much longer. Although one can safely predict that price gains will begin to decelerate, the timing of the deceleration is a more difficult call.", said Craig J. Lazzara, Managing Director at S&P DJI.
*The gains remained higher in the 20-city index as buyers with larger budgets continue to flock to smaller and more affordable areas, particularly those in the Southeast and Florida.
*Home prices are higher by 37% since March 2020, when the pandemic started. The Phoenix housing market is now up by 59%, the highest among the 20 metro areas tracked.
The Dallas Fed’s Manufacturing Index fell to -7.3 in May from 1.1 in April, the lowest reading since May of 2020. The level of New Orders (-9) and the Growth Rate of Orders (-18) fell significantly, with both readings now at their lowest levels in about two years. Meanwhile, Production (+8) and Capacity Utilization (+5.5) rose. Labor market measures cooled slightly, and prices Paid (+0.3) and Received (-1.7) were little changed. Finally, Delivery Times (-16.9) fell notably while Capital Expenditures (-9.8) also dropped. Future Company Outlook and General Business Activity expectations both fell into negative territory; however, expectations for future New Orders rose. Inflationary and Price expectations all cooled as well.
Why it Matters: There was a significant and broad weakening in manufacturer sentiment in the Texas region in March. Other than demand-focused (New Orders and Growth Rate of Orders) and supply-side impairment orientated sub-indexes (Wages and Delivery Times) rising, the majority of other sub-indexes fell notably. Drops in Production and Capacity Utilization showed that material and labor shortages continue to cap growth, a well-established theme at this point. We take some comfort in the drop in price measures seen elsewhere, indicating that the Chinese lockdowns have yet to add inflationary pressures meaningfully.
*The overall General Business Activity declined to negative territory due to declines in New Orders, Employment, and Delivery Times, while Production, Capacity, and Inventories all increased
*Six-month ahead General Business Activity expectations also moved into negative territory with broad deterioration in the sub-indexes, especially supply-side focused ones, although demand expectations marginally increased
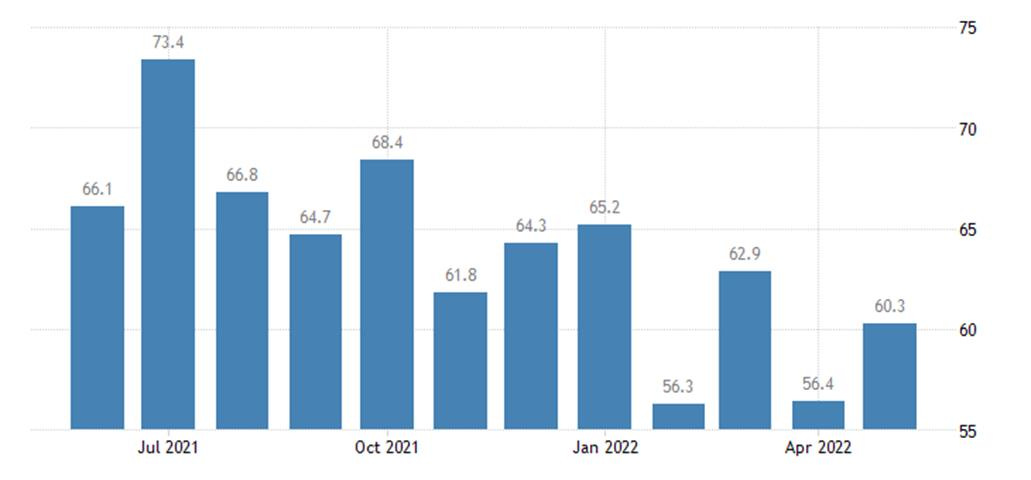
The Chicago PMI increased to 60.3 in May from a downwardly revised 56.4 in April and beating market forecasts of 55. Production (+10) and New Orders (+8.6) all increased notably while Order Backlogs (+1.2) moved to a seven-month high. Employment (46.1) was little changed while Supplier Delivery Times (-5.2) dipped to their lowest level since November 2020. Inventories (+4.5) grew to a nearly 50-year high. Finally, Prices Paid (+2.5) increased with over three-quarters of firms inferring higher prices. The special question for the month asked businesses what the three greatest challenges to currently conducting business are. Increased costs, said 80.9%, followed by 68.1% selecting delivery and lead times. Material shortages followed with 61.7%. Fewer firms struggled with labor shortages (46.8%), declining economic sentiment (21.3%), and increased demand (8.5%).
Why it Matters: The move higher in the overall index was mainly due to improvements in demand and production capacity. Firms generally echoed the (well known by now) supply-side disruptions. China’s lockdowns caused material shortages and lengthened lead times, increasing price pressures. Recruiting in production and distribution remained challenging. However, demand remained strong, and production capacity improved despite increased supply-side challenges. Inventories are also in solid shape, given the index is at a 50-year high, continuing the growing theme of improved stocks more generally there.
*A solid improvement in the overall Chicago PMI Index as all main indicators increased except for supplier deliveries
The Conference Board Consumer Confidence Index decreased slightly in May to 106.4, following a small increase in April to 108.6. The Present Situation Index declined to 149.6 from 152.9 last month. The Expectations Index declined to 77.5 from 79.0. Consumers’ appraisal of current business conditions improved in May, while their views on the labor market were less positive. Looking six months ahead, consumers’ pessimism about the short-term business conditions outlook grew in May, while they were less pessimistic about the short-term labor market outlook.
Why it Matters: There was a less than expected fall in the overall index. However, there remains a clear downward trend. The Present Situation Index decreased mainly due to perceived softening in labor market conditions while the current business conditions improved. The opposite was expected six months ahead, giving us pause on how negative or even clear-headed the consumer currently is. “Overall, the Present Situation Index remains at strong levels, suggesting growth did not contract further in Q2. That said, with the Expectations Index weakening further, consumers also do not foresee the economy picking up steam in the months ahead. They do expect labor market conditions to remain relatively strong, which should continue to support confidence in the short run,” said Lynn Franco, Senior Director of Economic Indicators at The Conference Board. Intentions to purchase big-ticket items cooled further, likely due to increased financing costs and a pivot by consumers to greater spending on services. Inflation remains the top concern for consumers, although inflation expectations were virtually unchanged from April’s level.
*Future expectations continue to be trending the most negative while the Present Situation is more range-bound at a historically high level
Policy Talk:
Governor Christopher Waller gave a speech in Germany Monday regarding his thoughts on the economy and how Fed policy should respond to inflation without causing a recession. He immediately highlighted the tightness in the labor markets and later discussed the implications that it has had on inflation and policy. He notes that the forces driving inflation have been the same over the last year, imbalances in supply and demand, but now inflation expectations are rising, although not yet problematically so but warranting close attention. Waller supports additional 50bp hikes “for several meetings” until he sees inflation coming down. He confirms his plans for rate hikes are in line with market pricing, which has around 2.5 percentage points of tightening this year. He furthers his tightening path preference by seeing the planned $1 trillion balance sheet reduction as worth “a couple of 25bp rate hikes." He concludes his remarks by discussing how bringing down inflation through a tighter policy approach does not necessarily mean detrimentally hurting the job market. He reviews a rather academic approach to understanding the various current dynamics in the labor market and concludes that vacancies should fall, but the unemployment rate should only increase slightly if the Fed tightens (to above neutral) as he expects and inflation falls accordingly.
“Recent data that tries to measure longer-term expectations are mixed. Overall, my assessment is that longer-range inflation expectations have moved up from a level that was consistent with trend inflation below 2 percent to a level that's consistent with underlying inflation a little above 2 percent.”
“I support tightening policy by another 50 basis points for several meetings. In particular, I am not taking 50 basis-point hikes off the table until I see inflation coming down closer to our 2 percent target.”
“To sum up, the relationship between vacancies and unemployment gives me a reason to hope that policy tightening in current circumstances can tame inflation without causing a sharp increase in unemployment.
Technicals and Charts:
Four Key Macro House Charts:
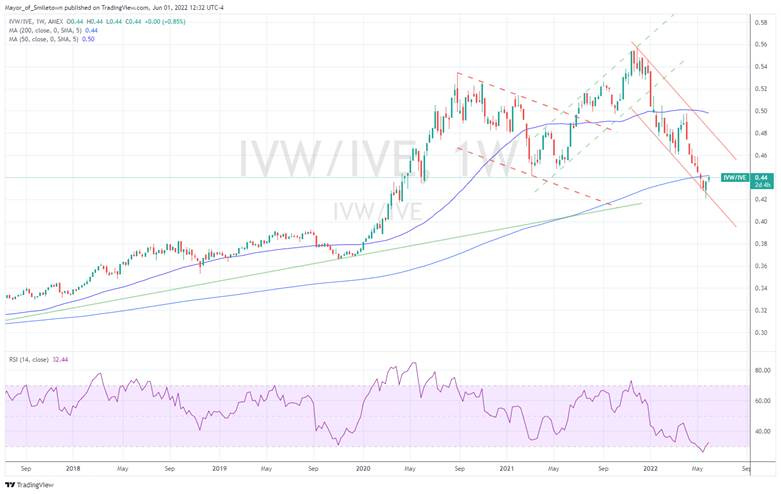
Growth/Value Ratio: Growth is higher on the day and the week. Large-Cap Growth is the best performing size/factor on the day.
Chinese Iron Ore Future Price: Iron Ore futures are higher on the day and week as inventory levels continue to fall due to production falling behind due to lockdowns
5yr-30yr Treasury Spread: The curve is flatter on the day and the week, with today’s positive economic data putting pressure on the front-end and belly due to increased Fed hiking expectations
EUR/JPY FX Cross: The Euro is higher on the day and the week despite a more comprehensive oil embargo on Russia being finalized
Other Charts:
There were many bear market bounces following the bursting of the dot.com bubble and in 2008 into the global financial crisis. Is the current bounce just that? Probably as the macro backdrop is still unsupportive for meaningful growth in earnings and multiple expansion.
The level of net equity purchase by retail investors over the last two years is now flat
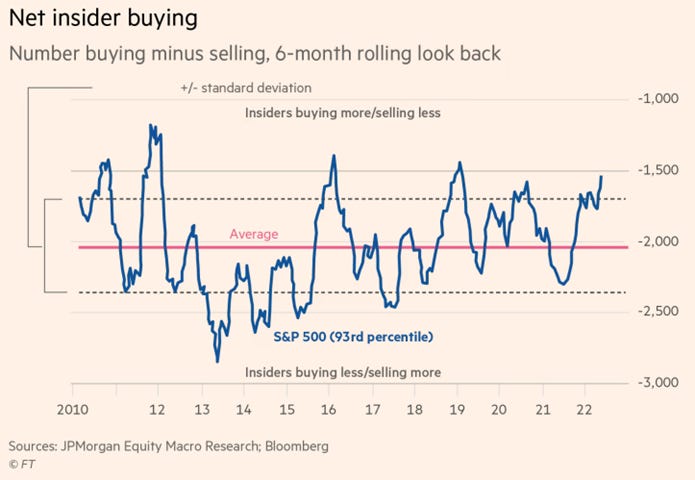
Meanwhile, the opposite is true for corporate insiders. “Corporate executives have this month bought shares in their companies at a rate not seen since the early days of the Covid-19 pandemic in what some Wall Street analysts said was an encouraging sign for the US stock market.” - @FT
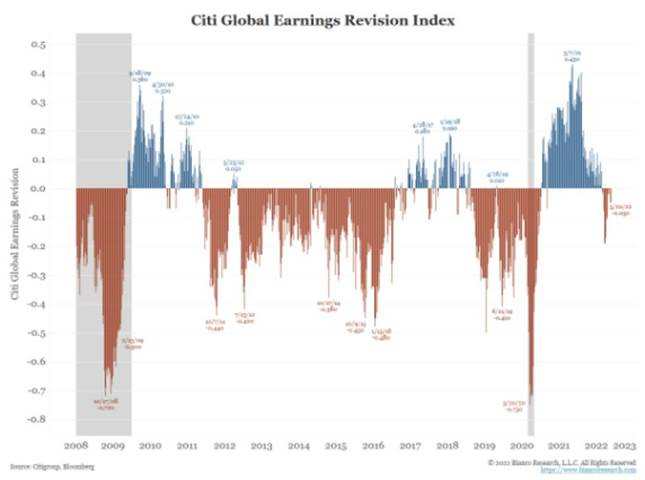
The direction of U.S. earnings revisions is turning negative after an unusually long period when earnings were revised higher. Given the increased uncertainties, it's the natural way of things for earnings estimates to be talked down as companies looking to give themselves a lower bar to clear.
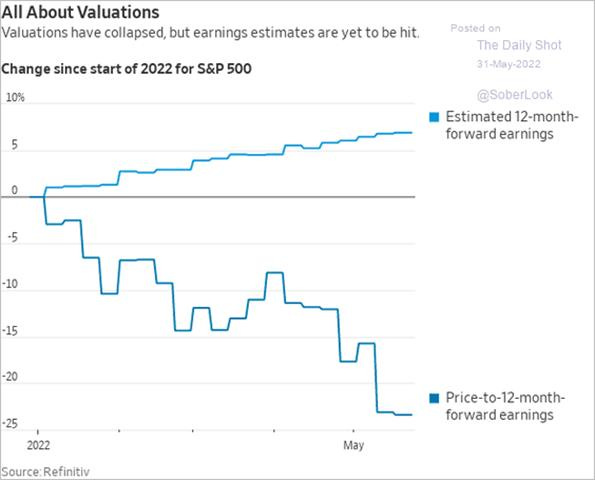
The market isn’t waiting for negative forward earnings revisions by the sell-side to increase, although they have picked up recently; instead, it is already discounting valuations to reflect an expected slowing in growth
Are those discounted valuations now attractive enough given the odds any slowdown/recession will be shallow? The trailing 12-month P/E ratio for the S&P is now 18.8, below the 5-year average (23.1) and 10-year average (20.2).
An analysis of earnings call by the BofA Research Team showed a pickup in mentions of "weak demand" with little difference between the sales in the U.S. or Europe, showing higher prices are leading to demand destruction, especially for discretionary goods.
Yield increases in Treasuries have been primarily driven by rises in real rates as inflation expectations further out the curve has begun to fall
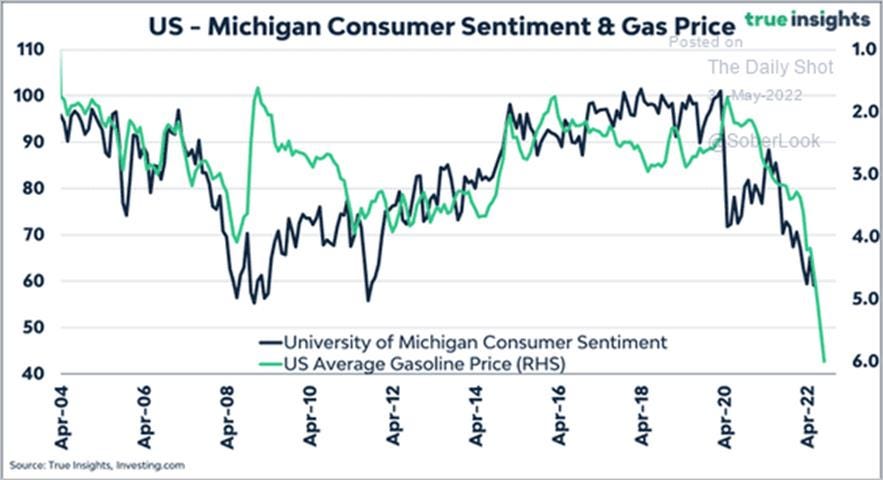
Rising gas prices are the easiest way for the consumer to experience “inflation,” and the increasingly negative consumer sentiment is correlated well to the rising price at the pump
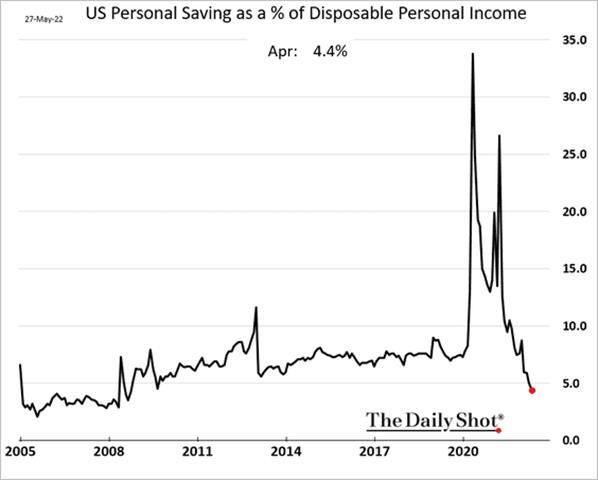
Falling savings rates (as a % of disposable income) and rising revolving credit levels show the U.S. consumer is increasingly stretched to keep up with rising prices as real aggregate income fails to keep up.
The FOMC favorite Dallas Fed’s trimmed-mean PCE measure has yet to peak, reducing the likelihood of a slowdown in the level of hikes in September
Economists aren’t very good at predicting things too far out. It is clear that expectations for inflation to drop from economists surveyed by Bloomberg have been consistently wrong since the beginning of 2021.
Article by Macro Themes:
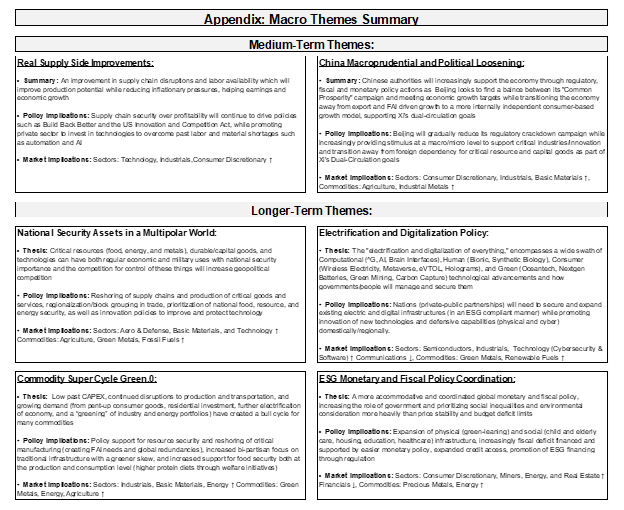
Medium-term Themes:
Real Supply-Side Situation:
Can’t Handle: Shipping Companies Added Capacity, but Now Containers Are Stuck in Port – WSJ
Shipping’s peak season usually starts at the end of June, when importers begin ordering products for the back-to-school and holiday seasons. This year, orders went out in mid-May as companies tried to head off the product shortages that plagued them last year. The early start has added to the challenges of getting the supply chain unclogged. Shipbrokers and consultants estimate about 12% of the world’s boxships are stuck outside congested ports for weeks longer than normal, and inland distribution, especially in the U.S., is still hampered by a lack of trains, truck drivers, and limited warehousing space.
Why it Matters:
Ship operators are trying to add millions of new containers to address a severe capacity crunch, but the boxes are stuck on liners and at ports as shipping moves into its busiest period. “The time a container takes to go on a train is more than six days. It should be two, and the volume of imported boxes designated for rail is up six times since February,” Mr. Seroka said. “During the pandemic, there was crazy demand; now there is too much inventory still coming in.” The bottom line, things are only marginally improving in the logistics world, with a recent step back due to inventory builds occurring earlier in the season.
China Macroprudential and Political Loosening:
Trickle Down: China Unveils Car Tax Cut Details in Bid to Boost Spending - Bloomberg
China will cut the purchase tax levied on some low-emission passenger vehicles by half, according to a statement on the finance ministry’s website. Cui Dongshu, Secretary-General of China’s Passenger Car Association, said last week that sales of traditional combustion engine cars have been severely hit and are in most urgent need of support. Around 4.92 million combustion engine cars were sold between January and April this year, down -18% from the same period a year ago.
Why it Matters:
The lack of confidence and worry over whether future outbreaks could lead to repeated lockdowns has seeped into almost every corner of the economy, with house sales slumping, retail sales and industrial output shrinking, and the jobless rate soaring. “Steadily increasing car consumption will play a significant role in driving the recovery of overall consumption and maintaining the sustainable development of the auto industry,” said Sheng Qiuping, a deputy commerce minister, and we agree. The Chinese consumer and retail investor needs to be enticed back to being greed-driven instead of their current fear-motivated entrenchment.
Longer-term Themes:
National Security Assets in a Multipolar World:
Numero Uno: U.S. Retakes Top Spot in Supercomputer Race - NYT
Frontier, the name of the massive machine at Oak Ridge National Laboratory, was declared on Monday to be the first to demonstrate the performance of one quintillion operations per second (a billion billion calculations) in a set of standard tests used by researchers to rank supercomputers. Some experts believe that Frontier has been beaten in the exascale race by two systems in China. Operators of those systems have not submitted test results for evaluation by scientists who oversee the so-called Top500 ranking. Experts said they suspect tensions between the United States and China are why the Chinese have not submitted the test results.
Why it Matters:
Supercomputers have long been a flashpoint in international competition. The U.S. Department of Energy several years ago pledged $1.8 billion to build three systems with that “exascale” performance, helping create Frontier, which got the top supercomputer position back from Japan. However, evidence that China broke the exascale barrier emerged in November when 14 Chinese researchers won a prestigious award from the Association for Computing Machinery, the Gordon Bell Prize, for simulating a quantum computing circuit on the new Sunway system running at exascale speeds. As we often write here, quantum computing coupled with AI will alter the cyber playing field for nations and is a true national security asset of the future.
Electrification and Digitalization Policy:
Beijing Placement: China Tops Google, YouTube Results on Covid Origins and Beijing’s Human-Rights Record – WSJ
Content reflecting Beijing’s position on its human-rights record and the origins of Covid-19 now regularly appear among top results on Google, Bing, and YouTube, according to a new report from the Brookings Institution and another Washington think tank, the Alliance for Securing Democracy, which seeks to study and resist the influence of authoritarian governments. Chinese state-controlled outlets tended to account for half of YouTube’s top 10 search results for “Fort Detrick,” a U.S. military bioresearch facility that China has suggested, without evidence, could be where Covid-19 originated. Searches for “Xinjiang” returned content from Chinese state outlets in the top results on YouTube almost daily over the duration of the study, which covered 120 days from November to February, as well as close to 90% of the time on either Google’s or Bing’s news sites.
Why it Matters:
The Chinese government’s ability to influence top search results beyond its borders grows out of Beijing’s heavy investment in building an international network of websites, news agencies, and broadcast channels to champion its positions globally. Whereas Beijing was once known for its softer approach, focused on promoting positive stories about China as a responsible world power, it has recently shifted to a far more aggressive style, quick to counter criticism and shoot barbs at the West. At the same time, it has beefed up its digital influence operations on platforms banned in China by hiring influencers, producing coordinated media campaigns, and launching hundreds of new state-affiliated Twitter accounts to disseminate its views.
Changing Sides: The Mystery of China’s Sudden Warnings About US Hackers - NYT
Since the start of 2022, there has been a marked uptick in China’s Foreign Ministry and the country’s cybersecurity firms calling out alleged US cyberespionage. Until now, these allegations have been a rarity. But the disclosures come with a catch: They appear to rely on years-old technical details, which are already publicly known and don’t contain fresh information. The move may be a strategic change for China as the nation tussles to cement its position as a tech superpower.
Why it Matters:
The potential shift in tactics could play into wider policies around technology use and development. In recent years, China’s policies have focused on positioning itself as a dominant force in technology standards in everything from 5G to quantum computers. A raft of new cybersecurity and privacy laws have detailed how companies should handle data and protect national information. “One explanation is, possibly, that we are engaged in a kind of ideological—or if you want to put it more prosaically, a marketing—battle with China,” says Suzanne Spaulding, a senior adviser at the Center for Strategic and International Studies and previously a senior cybersecurity official in the Obama administration.
ESG Monetary and Fiscal Policy Expansion:
ACA Jump: Democrats Push to Extend Health-Insurance Subsidies Ahead of Midterms – WSJ
The pandemic relief package’s temporary expansion of subsidies to lower the cost of plans sold on the Affordable Care Act exchange ends Jan. 1. Insurers typically begin informing consumers of premium prices for the next year in October, just as early voting for the midterm elections gets underway. With Republican senators opposed to expanding the ACA, Democrats would likely need to go it alone on extending the subsidies.
Why it Matters:
Nearly all of the 13 million people receiving the federal subsidies would see their premiums rise, on average, by 53%, according to nonprofit health advocacy group Families USA, and some who have been receiving free healthcare because of the subsidies might lose coverage altogether because they can’t afford to pay. Mr. Biden has sought to make the ACA more robust and boost the number of people using it to buy health insurance, a campaign goal.
Current Macro Theme Summaries:
VIEWS EXPRESSED IN "CONTENT" ON THIS WEBSITE OR POSTED IN SOCIAL MEDIA AND OTHER PLATFORMS (COLLECTIVELY, "CONTENT DISTRIBUTION OUTLETS") ARE MY OWN. THE POSTS ARE NOT DIRECTED TO ANY INVESTORS OR POTENTIAL INVESTORS, AND DO NOT CONSTITUTE AN OFFER TO SELL -- OR A SOLICITATION OF AN OFFER TO BUY -- ANY SECURITIES, AND MAY NOT BE USED OR RELIED UPON IN EVALUATING THE MERITS OF ANY INVESTMENT.
THE CONTENT SHOULD NOT BE CONSTRUED AS OR RELIED UPON IN ANY MANNER AS INVESTMENT, LEGAL, TAX, OR OTHER ADVICE. YOU SHOULD CONSULT YOUR OWN ADVISERS AS TO LEGAL, BUSINESS, TAX, AND OTHER RELATED MATTERS CONCERNING ANY INVESTMENT. ANY PROJECTIONS, ESTIMATES, FORECASTS, TARGETS, PROSPECTS AND/OR OPINIONS EXPRESSED IN THESE MATERIALS ARE SUBJECT TO CHANGE WITHOUT NOTICE AND MAY DIFFER OR BE CONTRARY TO OPINIONS EXPRESSED BY OTHERS. ANY CHARTS PROVIDED HERE ARE FOR INFORMATIONAL PURPOSES ONLY, AND SHOULD NOT BE RELIED UPON WHEN MAKING ANY INVESTMENT DECISION. CERTAIN INFORMATION CONTAINED IN HERE HAS BEEN OBTAINED FROM THIRD-PARTY SOURCES. WHILE TAKEN FROM SOURCES BELIEVED TO BE RELIABLE, I HAVE NOT INDEPENDENTLY VERIFIED SUCH INFORMATION AND MAKES NO REPRESENTATIONS ABOUT THE ENDURING ACCURACY OF THE INFORMATION


