MIDDAY MACRO - DAILY COLOR – 2/17/2022
OVERNIGHT-MORNING RECAP / MARKET WRAP
Price Action and Headlines:
Equities are lower, with mixed but negative headlines regarding Russia/Ukraine again driving a more risk-off tone globally as the “fog of war” continues to thicken
Treasuries are higher, helped by yesterday’s more dovishly perceived FOMC minutes and the flight to safety currently underway due to increased geopolitical risks
WTI is lower, as expectations for an Iran deal is trumping worries over any Russian invasion and increasingly supportive fundamentals
Narrative Analysis:
Equities are lower as markets seem to be stuck in a little bit of a “Groundhog Day” situation with either positive or negative headlines regarding the situation between Russia and Ukraine taking center stage. Outside of geopolitics, domestic data continues to surprise to the upside, earnings are generally coming in above expectations, and the Fed’s January FOMC minutes showed a committee still looking to be somewhat patient. Treasuries have been the primary beneficiary today, with the curve little changed as a flight to safety due to the continued uncertainty reversing recent yield rises. Oil is not indicating the same level of geopolitical fear as equities, primarily due to positive developments in Iranian negotiations, while the $DXY is little changed.
The S&P is outperforming the Nasdaq and Russell with Low Vol, High Dividend Yield, and Value factors, and Consumer Staples, Utilities, and Real Estate sectors all outperforming.
S&P optionality strike levels have the Zero-Gamma Level at 4550 while the Call Wall has fallen to 4500. There is a reduction in negative gamma due to tomorrow’s OPEX that should be supportive of markets. However, the continual barrage of Russia/Ukraine headlines is making it hard for implied vol to fall, while the call wall at 4500 will create strong resistance against any rally.
S&P technical levels have support at 4400-4395, then 4280, and resistance is at 4435, then 4450ish (220dma). Since late January, the S&P has been in a triangle consolidation regime/pattern. This means there is no clear very short-term trend, bulls and bears get trapped, and energy is building for a breakout/down.
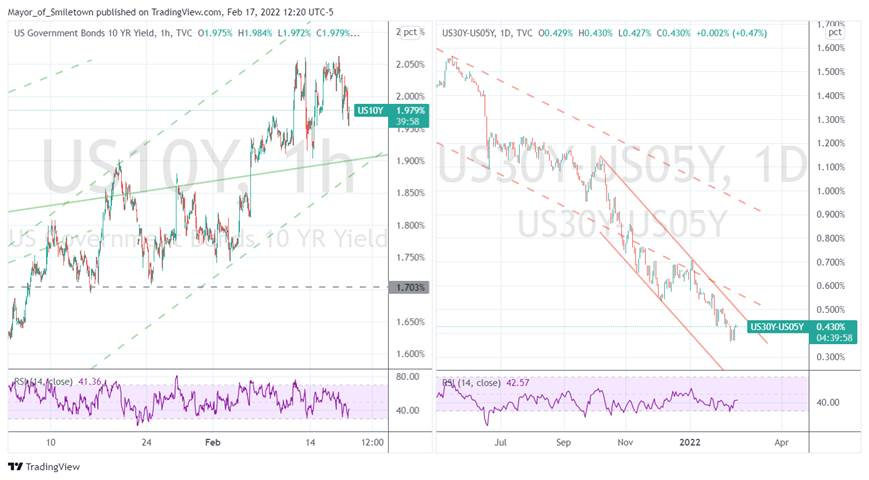
Treasuries are higher, with the 10yr yield now at 1.97%, falling 6bps today, while the 5s30s curve is little changed at 43bps.
Econ Data:
Housing starts fell -4.1% in January, to an annual rate of 1.638 million, well below forecasts of 1.7 million. Starts for single-family units declined -5.6%, while multi-unit decreased by -2.1%. Starts plunged -37.7% in the Midwest and declined 2% in the South, but increased 2.6% in the Northeast and 17.7% in the West. Building permits rose 0.7% MoM to a seasonally adjusted annual rate of 1.899 million, above market expectations of 1.760 million. Single-family authorizations jumped 6.8%, while those for multi-units dropped -8.8%. Permits increased significantly in the West (13.9%) and the South (11.4%).
Why it Matters: January brought us the highest monthly increase in building permits since May of 2006. The increase in housing and rental prices have many worried a more structural inflationary pulse is upon us. However, we take comfort in the fact that home builders will be bringing a lot of new supply to the market this year despite all the supply-side impairments that are still lingering. This should reduce price appreciation, furthered by rising mortgage rates and the ebbing of behavioral changes due to the pandemic that will reduce demand.
*No shortage of new homes, either single or multi, on the horizon as materials and worker shortages due little to stop demand
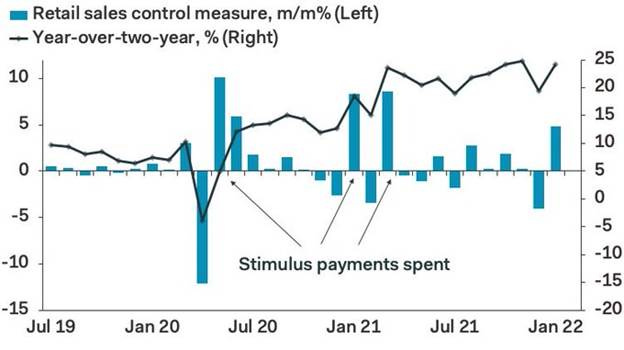
Retail sales rose 3.8% MoM in January, from an upwardly revised -2.5% drop in December, and more than market forecasts of a 2% rise. Eight of the 13 retail categories rose in the month. The most significant gains were seen in online retailers (14.5%), furniture stores (7.2%), auto dealers (5.9%), and building materials and garden equipment (4.1%). On the other hand, sales declined at gasoline stations (-1.3%), sporting goods, hobbies, musical instruments, and book stores (-3%), and restaurants and bars (-0.9%). Excluding autos, retail sales were up 3.3%, and excluding autos and gas were higher by 3.8%
Why it Matters: It was the biggest increase in retail sales in ten months. As a reminder, retail sales do not adjust for inflation. Nonetheless, the report was better than expected when adjusted for inflation and will now contribute to Q1 GDP estimates being revised higher. The slowdown in December sales is now largely being seen as a counter-trend occurrence, as people pulled holiday purchases forward, fearing shortages of popular items. Receipts at restaurants and bars, the report’s only services-oriented category, fell -0.9%, likely reflecting the record surge in Omicron cases seen in January. Higher-frequency data is showing activity there already bouncing as Omicron cases continue to drop sharply.
*That marked the strongest monthly gain in retail spending since last March when the pandemic-related stimulus was being distributed to households.
*Online activity rebounded nicely after a weaker December as shortages or fears over delays no longer derailed spending intentions
Prices for US exports went up 2.9% in January, rebounding from an upwardly revised -1.6% drop in December and beating market expectations of a 1.3% rise. Export prices soared 15.1% on an annual basis. The price index for agricultural exports rose 3%, while non-agricultural prices rose 2.9%. The price index for imports rose 2% MoM, rebounding from a revised -0.4% drop in December and above market expectations of 1.3%. The price index for import fuel rose 9.3%, driven by higher petroleum (9.5%) and natural gas (10.5%) prices. On a yearly basis, US import prices are higher by 10.8%.
Why it Matters: This was the largest one-month rise for export prices on record, while imports rose the most since April 2011. The increases in both imports and exports were broad-based. Regarding exports, numerous multi-year highs were seen. Capital goods prices rose 0.7%, the largest monthly increase since January 2013. Prices for consumer goods advanced 1%, the largest 1-month rise since June 2011. We continue to be surprised by the level and scope of price increases. We also continue to expect demand destruction from past increases and the transition to a more historic goods/service spending ratio by consumers to reduce inflationary pressures. Still, We have yet to see it meaningfully occur.
*Significant reversal in January after both import and export prices declined in December
Manufacturers’ and trade inventories rose 2.1% in December, after an upwardly revised 1.5% increase in the prior month and in line with market expectations. Stocks went up at retailers (4.2% vs. 2% in November), merchant wholesalers (2.2% vs. 1.7%) but builds slowed at manufacturers (0.3% vs 0.8%). Year on year, business inventories climbed 10.5% in December. The total business inventories/sales ratio based on seasonally adjusted data at the end of December was 1.29. The December 2020 ratio was 1.35.
Why it Matters: It was the strongest increase in business inventories since available records began in February of 1992. This continued strong restocking, which cannot be attributed to the post-holiday season given how poorly inventory levels were going into the season, is a significant contributor to the current inflationary pulse in goods. The inventory/sales ratio is still near historic lows, indicating that more inventory building will need to occur for some time. However, price increases are chipping away at end demand, and the passage of the holiday season may reduce the urgency and hence inelasticity of demand by retailers and wholesalers. It also shows the availability of goods may be improving as logistical impairments abate.
*Largest monthly increase since the survey started, showing just how understocked many wholesalers and retailers are and potentially better availability of goods
Industrial production increased 1.4% in January, recovering from a 0.1% fall in December and beating market expectations of a 0.4% increase. Output from Utilities jumped 9.9%, mostly because of a surge in heating demand. Manufacturing output rose 0.2% as gains in machinery and electrical equipment more than offset a decline in production of motor vehicles and petroleum products. Also, sizable increases were recorded in textile and product mills, food, beverage, tobacco products, and paper production. Meanwhile, mining output rose 1%. Finally, the third component of the index, mining production, was up 1.0%. Capacity utilization for the industrial sector increased 1% to 77.6%, a rate that is 1.9 percentage points below its long-run (1972–2021) average.
Why it Matters: There was a large monthly increase in consumer goods production, complementing the strong demand seen in retail sales and rebuilding of inventory builds by retailers and wholesalers. The output of utilities saw the largest increase in the history of the index (up 9.9%). Manufacturing increased 0.2% but would have been higher if vehicle assemblies didn’t decrease by -1.3% MoM due to the shortage of needed parts. There looks to be a slowdown in business equipment production after stronger gains in October and November, underlying the fact that most Capex currently occurring continues to be more digital and IT-related than in physical assets.
*Warm weather helped utilities record a historically large monthly gain
TECHNICALS / CHARTS
Four Key Macro House Charts:
Growth/Value Ratio: Value is higher on the day and Growth is higher on the week. Large-Cap Value is the best performing size/factor on the day.
Chinese Iron Ore Future Price: Iron Ore futures are lower on the day and week. Beijing continues to push back on price increases through various measures/tactics
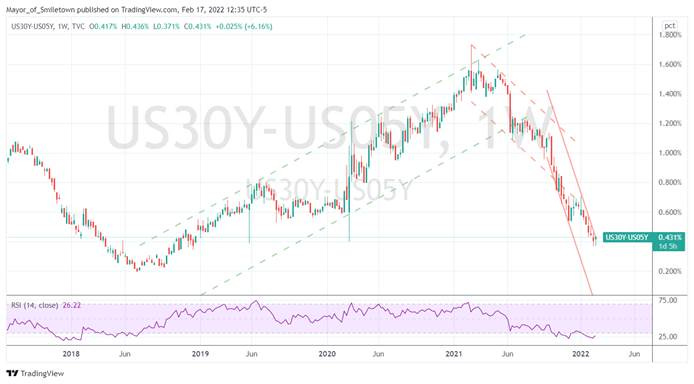
5yr-30yr Treasury Spread: The curve is slightly steeper on the day and week, with the curve generally well bid due to the flight to safety tone in markets currently
EUR/JPY FX Cross: The Yen is higher on the day, and the Euro is slightly higher on the week, as increased fears over Russia/Ukraine have the two retracing moves earlier in the week
Other Charts:
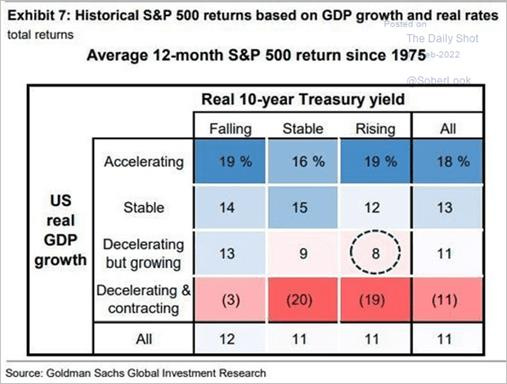
GDP growth slowing and real rates rising have still resulted in positive S&P returns
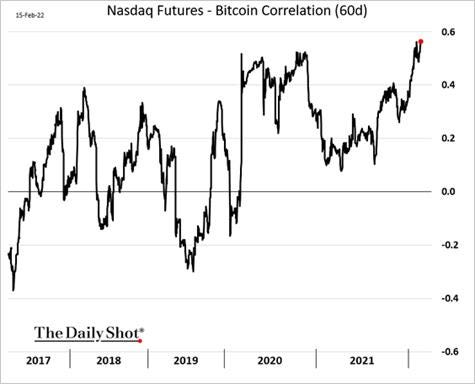
As financial conditions have tightened and (nominal and real) rates have risen, Bitcoin has become more correlated with equities, showing its speculative nature
Fed is certainly right to be concerned about shelter costs increasing with large increases in two leading indicators of future rent inflation—asking rent inflation and house price inflation pointing to upside risks
However, the car price pressures are likely to increasingly subside and become a drag on headline/core inflation
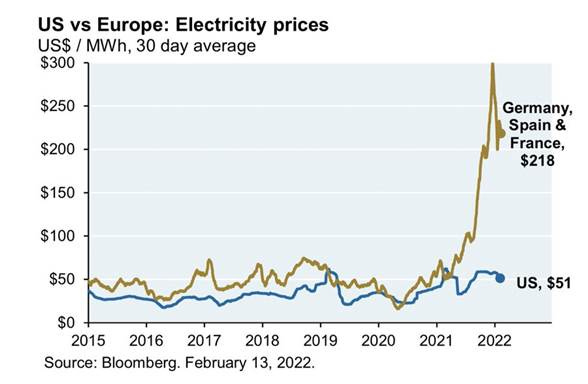
Europe imports roughly the same amount of oil and gas from Russia as it produces for itself.
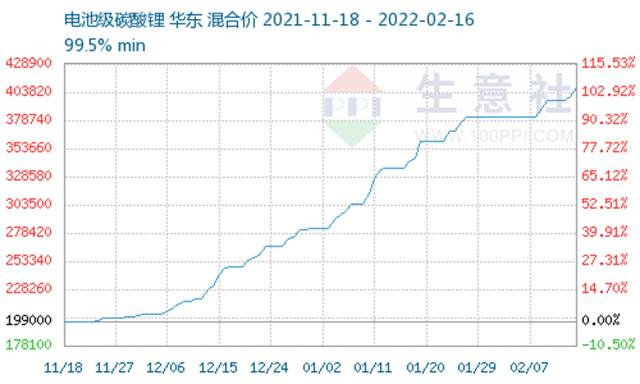
Lithium prices are bucking the trend in China as other commodities such as coal and iron have pulled back under pressure from Beijing
ARTICLES BY MACRO THEMES
MEDIUM-TERM THEMES:
China Macroprudential and Political Loosening:
Inflation?: China Stops Coal Price Reporting to Crack Down on Rally – Bloomberg
Two major Chinese coal data providers halted their price indexes after Beijing intensified a campaign to tame down rallies in the mainstay fuel and iron ore to rein in inflation. Physical trades in major northern ports have been constrained after Beijing warned it would punish hoarders and price manipulators. The National Development and Reform Commission, China’s top planning agency, asked major coal miners to reduce prices last week, a day after futures surged to the highest level in more than two months.
Why it Matters:
What inflation? It must be nice to just stop reporting data when you don’t like it and tell people to lower their prices if you think it's too high. No matter how it is happening, falling inflation “data” increases the belief that more policy support for the economy is coming. Regarding commodity markets, the government’s rhetoric on cracking down on prices is expected to drive trading for the near term as traders await more specific longer-term measures.
LONGER-TERM THEMES:
Electrification and Digitalization Policy:
Now Google: Google Plans Privacy Changes, but Promises to Not Be Disruptive - NYT
Google is working on privacy measures meant to limit the sharing of data on smartphones running its Android software. But the company promised those changes would not be as disruptive to advertisers as a similar move by Apple last year. It is too early to gauge the potential impact of Google’s changes, which are meant to limit the sharing of data across apps and with third parties, but the company’s goal is to find a more private option for users while also allowing developers to continue to make advertising revenue.
Why it Matters:
The changes from Google and Apple are significant because digital advertising based on the accumulation of data about users has underpinned the internet for the last 20 years. But that business model is facing more challenges as users have grown more suspicious about far-reaching data collection amid a general distrust of technology giants.
Multi-Meta: Microsoft to remove AltspaceVR social hubs and tighten up safety and moderation – The Verge
Microsoft is removing all social hubs hosted in AltspaceVR and requiring users to log into the virtual reality app using a Microsoft account. The changes are designed to improve safety and moderation on AltspaceVR, and Microsoft will also turn its existing safety bubble feature on by default and mute attendees joining meetings in AltspaceVR by default.
Why it Matters:
Although what Microsoft is doing in their VR “metaverse” is relatively mundane, we want to start highlighting corporate policies towards metaverse spaces. There will likely be various metaverses sponsored by corporations or private collectives with differing rules and purposes, and first-mover advantage will be crucial. As a result, we wanted to show how Microsoft, one of the major players in the space, has started to build rules and boundaries in their metaverse.
Commodity Super Cycle Green.0:
Evolution: NextEra to Help Power Proposed Natural Gas-to-Fuel Plant in Texas - Bloomberg
NextEra Energy, the renewable-energy giant, will supply 1,000 gigawatt-hours annually to closely-held Nacero Inc.'s proposed fuel-making plant in the Permian Basin of West Texas, the companies said in a joint statement on Wednesday. NextEra’s deliveries of wind power will complement electricity supplies from a 200-megawatt solar array that Nacero plans to locate adjacent to the plant. Construction is scheduled to begin this year
Why it Matters:
The fact that renewable energy sources will help make gasoline from natural gas from the world’s biggest shale field seemed worth highlighting. The partnership of green and fossil fuels underscores how diverse and complicated the energy market has become. Developments like this also cloud the ESG scoring companies like NextEra seek to get. It also shows that natural gas will continue to be an important part of the U.S. energy portfolio, now increasingly affecting the price at the pump.
ESG Monetary and Fiscal Policy Expansion:
Choices: Biden’s petrol problem: president eyes gas tax cut as pump prices soar - FT
On Tuesday, the White House said it could scrap federal gasoline taxes in a bid to bring immediate relief to drivers. The average price for a gallon of gasoline across the US is now $3.50, a rise of almost 50 percent since Biden entered the Oval Office.
Why it Matters:
The mooted gasoline tax relief “underscores how little the US has in its tool chest to influence oil prices,” said Robert Campbell, an analyst at consultancy Energy Aspects. “The fundamental problem for the oil market is that capital has been withdrawn from exploration and production, and demand has come back. Price needs to do the work to get those things back into balance. A pre-election giveaway won’t change that fact,” Campbell said.
Damned: US carbon 'cost' ruling may hit oil lease sales – Argus
Last week, a federal judge in Louisiana issued an injunction blocking the federal government from further use of the calculation, which pegs the cost of releasing CO₂ emissions at $52/metric tonne in any decision-making. But that win has raised new questions about how the federal leasing process will move forward since the Interior Department relied on the carbon cost formula for draft environmental reviews for lease sales in New Mexico, Wyoming, Colorado, and other states scheduled to begin as early as this quarter. The economic cost of carbon also featured prominently in environmental reviews of a planned offshore lease sale in the Cook Inlet off Alaska.
Why it Matters:
Interior is required under its oil and gas lease sale process to first finalize its pending environmental reviews, all of which relied on the social cost of carbon to project climate damages from leasing. Interior officials are "sort of in a 'damned if we do, damned if we don't' scenario," New York-based think tank Institute for Policy Integrity senior attorney Max Sarinsky said. "This insanely overbroad injunction prohibits them from using the best available metric to assess climate impacts of their lease sales. If they do not include that assessment, that of itself could be problematic."
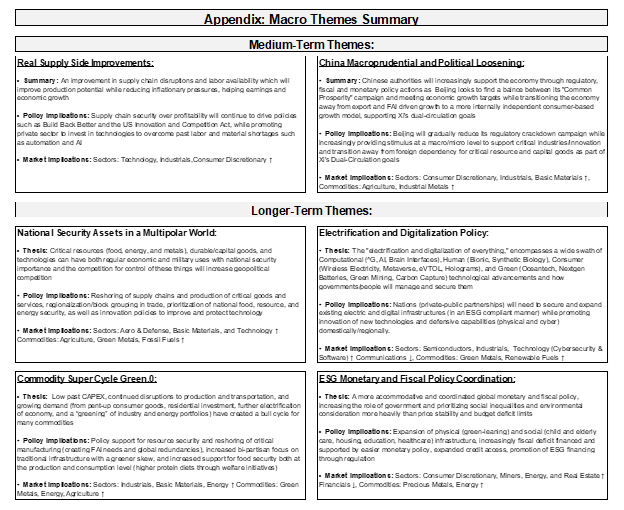
Current Macro Theme Summaries:
VIEWS EXPRESSED IN "CONTENT" ON THIS WEBSITE OR POSTED IN SOCIAL MEDIA AND OTHER PLATFORMS (COLLECTIVELY, "CONTENT DISTRIBUTION OUTLETS") ARE MY OWN. THE POSTS ARE NOT DIRECTED TO ANY INVESTORS OR POTENTIAL INVESTORS, AND DO NOT CONSTITUTE AN OFFER TO SELL -- OR A SOLICITATION OF AN OFFER TO BUY -- ANY SECURITIES, AND MAY NOT BE USED OR RELIED UPON IN EVALUATING THE MERITS OF ANY INVESTMENT.
THE CONTENT SHOULD NOT BE CONSTRUED AS OR RELIED UPON IN ANY MANNER AS INVESTMENT, LEGAL, TAX, OR OTHER ADVICE. YOU SHOULD CONSULT YOUR OWN ADVISERS AS TO LEGAL, BUSINESS, TAX, AND OTHER RELATED MATTERS CONCERNING ANY INVESTMENT. ANY PROJECTIONS, ESTIMATES, FORECASTS, TARGETS, PROSPECTS AND/OR OPINIONS EXPRESSED IN THESE MATERIALS ARE SUBJECT TO CHANGE WITHOUT NOTICE AND MAY DIFFER OR BE CONTRARY TO OPINIONS EXPRESSED BY OTHERS. ANY CHARTS PROVIDED HERE ARE FOR INFORMATIONAL PURPOSES ONLY, AND SHOULD NOT BE RELIED UPON WHEN MAKING ANY INVESTMENT DECISION. CERTAIN INFORMATION CONTAINED IN HERE HAS BEEN OBTAINED FROM THIRD-PARTY SOURCES. WHILE TAKEN FROM SOURCES BELIEVED TO BE RELIABLE, I HAVE NOT INDEPENDENTLY VERIFIED SUCH INFORMATION AND MAKES NO REPRESENTATIONS ABOUT THE ENDURING ACCURACY OF THE INFORMATION OR ITS APPROPRIATENESS FOR A GIVEN SITUATION.


