


MIDDAY MACRO - 11/23/2021
Daily Color on Markets, Policy, and Geopolitics

MIDDAY MACRO - DAILY COLOR – 11/23/2021
OVERNIGHT-MORNING RECAP / MARKET WRAP
Narratives/Price Action:
Equities are lower, although several sectors (energy, financials, REITs) are notably higher as Tech continues to be the biggest drag due to Fed tightening fears
Treasuries are lower, with the curve a little steeper today, driven by the belly getting some relief after sharply underperforming yesterday following Powell’s reconfirmation announcement
WTI is higher, as a coordinated effort to release oil reserves among various nations was countered by OPEC saying they may not increase production next month, helping WTI move back towards $80 after touching below $75 yesterday
Analysis:
The S&P is chopping around after yesterday’s new ATHs quickly reversed, leading it to drop nearly 100 points into the overnight session and sending the VIX above 20. Today’s Markit PMI data continued to support the high demand/high inflation narrative. When coupled with increasing hawkish rhetoric from Fed officials, the more rate-sensitive parts of the market are under the greatest pressure today. The belly of the Treasury curve is seeing some relief after yesterday’s drop while the Dollar continues to hover near recent highs
The S&P is outperforming the Russell and Nasdaq with High Dividend Yield, Value, and Momentum factors, and Energy, Financials, and Real Estate sectors all outperforming.
S&P optionality strike levels have the Zero-Gamma Level moved higher to 4667 while the Call Wall is at 4750. Gamma for the S&P has become more neutral, and implied volatility has risen, increasing the likely daily trading range. There has been an increase in put buying but not to an alarming level.
The technical levels have support at 4650, then 4630, and resistance at 4690, then 4705 for the S&P. Yesterday is increasingly looking like a fake upside breakout. Choppy conditions are likely to continue into the holiday weekend, with critical support being 4650.
Treasuries are lower, although the belly is little changed, helping the 5s30s curve steepen 3bps to 67bps as traders continue to weigh more hawkish Fed rhetoric with Covid growth fears while a stronger than expected 7yr auction is helping reverse momentum


*Real yields have risen recently as breakevens pulled back from post-CPI highs

*Online searches for consumer credit availability has been increasing as households have generally paid down revolving credit throughout the pandemic

*Consumer spending is expected to remain strong in 2022 after a near-record year this year

*Strong end demand has allowed firms to defend margins, with all S&P sector’s average profit margin above their 5-yr averages.

*Covid cases continue to rise domestically, something increasingly weighing on sentiment
Risk sentiment continues to cool today despite new all-time highs being made on the S&P yesterday, with volatility picking up due to concerns the economy is running too hot, causing inflationary pressures to persist, and forcing the Fed to shorten the tapering process and raise rates earlier and faster than previously expected, tightening financial conditions and neutralizing excess liquidity.
Economic Fundamentals: The 4th quarter economic data continues to paint a strong growth picture despite the persistence of all the supply-side impairments we have discussed to death. As a result, “good data is becoming bad news,” as it increases expectations the Fed will tighten policy at a faster pace.
GDPNow for Q4 is at 8.2%, retail sales have increased an incredible 16.3% YoY, industrial production is higher by 19.8% YoY with national and regional manufacturing business surveys are rising again; likewise, service sector activity continues to expand. Finally, the consumer is sitting on high levels of household wealth, savings, and credit availability while labor markets continue to improve broadly, painting a rosy future outlook.
As a result of the improving economic backdrop, a growing roster of Fed officials recently noted that it might be appropriate to increase the pace of tapering and move forward rate hikes. These increasing expectations of faster rate hikes were furthered yesterday when the reappointment of Powell increased the odds of 4 rate hikes in 2022 to 23%.
Finally, inflationary pressures are peaking as supply-side disruptions slowly abate and energy/commodities markets continue to cool. However, continued strong demand is expected in H1 ’22 supported by higher wages and net wealth, while shelter shortages (housing and rent) and ESG cultural shifts will maintain a persistent structural pulse for some time.

*Powell’s reappointment increased the probability of 3 rate hikes to above 90% yesterday
Market Technicals: The S&P’s technicals became more negative in the last 24 hrs as yesterday’s breakout quickly reversed and dropped to key resistance overnight, all foreshadowing a more negative shift in momentum.
Yesterday brought us a fake upside breakout, with the S&P briefly reaching a new ATH of 4740 after the initial Fed pick announcement, which quickly reversed, briefly battled to hold support around 4705 and then dropped sharply into the cash close following comments by officials that brought into question the duration of the Fed’s tapering timeline.
The critical support level of 4650 was reached overnight and again retested post-NY-open. Below 4650, there is support at 4630, but a break below that would see selling meaningfully intensify.
For the Santa Clause rally to stay intact, the S&P has to reclaim the 4705 area relatively quickly as seasonals are again becoming positive while RSI for 1hr and 4hr have reset to more neutral levels.

*S&P has bounced off the critical support of 4650 twice now. It needs to move above the critical 4700ish level to recapture the longer-term up-channel
Market Optionality: The optionality backdrop for the S&P is still modestly positive, while the Nasdaq holds a more negative gamma position, implying higher volatility there.
There has been an increase in realized volatility, while implied volatility has increased following last Friday’s November options expiration with the VIX now above 20 and the VIX futures term structure shifting higher.
Despite increased recent put buying and more volatile price action, the Put Wall remained at 4400 while the Vol Trigger level, where dealer hedging flow turns negative, did not meaningfully change.
The bottom line, despite more erratic price action, there is still no “fear trade” occurring. Still, higher implied volatility has increased the daily trading range. The S&P will regain a more bullish stance above 4700, while moves below 4670 may initiate a spike in volatility and exacerbate a move further down.

*The SpotGamma Vanna Model setup is more neutral for the S&P but tilted for QQQ, indicating dealer activity will be more sensitive to moves in volatility for the Nasdaq
The Bottom Line: A further melt-up in the S&P into year-end is still our base case view but increased volatility and growing policy tightening concerns do not support entering new long positions here.
The economy is running hot, something the Fed wanted, and at this pace, the “full employment” mandate will be reached mid-summer while we are already at inflation target, even with AIT.
The Board of Governors will likely shift to a more dovish composition next year as the White House further fills the remaining open seats in December (although confirmation is far from assured), leading us to believe that despite the dual mandates potentially being reached mid-summer, there will still be a patient approach to tightening policy.
Technicals and optionality in the market indicate greater volatility due to a broader trading channel developing, more neutral gamma positioning, and higher implied volatility. This will increasingly reduce participation by more vol-focused strategies and create somewhat of a negative feedback loop.
However, overall seasonals are positive, and in conjunction with the improving data and still, highly accommodative policy, which has supported easy financial conditions, lead us to maintain our long bias into year-end, although we would not be entering new positions currently.

*Price action is still in line with seasonals, which have been closely followed this year
Econ Data:
The IHS Markit US Composite PMI declined to 56.5 in November from 57.6 in the previous month. The manufacturing PMI increased to 59.1 from a 10-month low of 58.4 in October, beating market forecasts of 59. The services PMI dropped to 57 from 58.7 in the previous month and below the market consensus of 59. New business and employment continued to increase at solid rates, and the level of outstanding business rose at the second-sharpest pace on record. On the price front, the inflation rates of both input costs and output charges hit new peaks. Finally, business confidence improved in November, helped by a sustained period of strong client demand, further easing of COVID-19 restrictions, and the acquisition of new customers.
Why it Matters: The pace of growth, although still high in November, slowed due to a decrease in service activity from continued pressure on capacity. Capacity continued to be capped due to labor shortages, causing backlogs of work to rise at the second-fastest rate on record. More generally, the latest report continues to highlight output growth being capped due to rising prices, poor input availability and challenges finding suitable candidates for vacancies. “The US economy continues to run hot. Despite a slower rate of expansion of business activity in November, growth remains above the survey’s long-run pre-pandemic average as companies continue to focus on boosting capacity to meet rising demand,” said Chris Williamson, Chief Economist for IHS Markit. He further stated, “Although supplier delivery delays eased to the lowest for six months, the lengthening of lead times remains far greater than anything seen prior to the pandemic, restricting output relative to demand and once again causing prices to rise sharply.”

*Supply-side impairments continue to cap growth, but there were some signs things are stabilizing
Existing home sales increased 0.8% MoM to an annualized 6.34 million units in October, the highest since January and above market forecasts of 6.2 million. Sales were up in the Midwest and the South while the Northeast reported a drop, and the West held steady. Total housing inventory amounted to 1.25 million units, down 0.8% from September. Unsold inventory sits at a 2.4-month supply at the current sales pace, the same as in September. The median existing-home price was $353,900, up 13.1% from October 2020, as prices climbed in each region. Properties typically remained on the market for 18 days in October, up from 17 days in September, and down from 21 days in October 2020. Eighty-two percent of homes sold in October 2021 were on the market for less than a month. First-time buyers were responsible for 29% of sales, up from 28% in September and down from 32% in October 2020. Cash sales increased to 17% of homes, from 13% in September, showing purchases for investment purposes or second-home buying increased.
Why it Matters: The housing market is on pace for its strongest year of sales in 15 years. The “frenzied” activity from a year ago has stabilized. However, activity across housing is still higher than pre-pandemic levels due to the continued/growing reality of “working from home” and higher levels of household wealth due to rising wages and appreciating (financial) assets. "Home sales remain resilient, despite low inventory and increasing affordability challenges. Inflationary pressures, such as fast-rising rents and increasing consumer prices, may have some prospective buyers seeking the protection of a fixed, consistent mortgage payment", said Lawrence Yun, NAR's chief economist. This newer inflation hedge bid is helping keep the market well bid, with many homes still selling above the listing price and the typical time on the market remaining low, at 18 days. This is especially true with lower to mid-level houses as there are some signs the higher-end is beginning to see less demand.

*Existing home sales increased +0.8% MoM vs -1.4% est after rising +7% in Sept

*Available supply did not improve as supply-side impairments and land availability continue to weigh on inventory growth

*All Cash Deals and Investor related purchases increased again in October
TECHNICALS / CHARTS
Four Key Macro House Charts:
Growth/Value Ratio: Value is higher on the week and again today as big tech and more duration sensitive factors are under increased pressure as the Fed’s tightening timeline moves forward

Chinese Iron Ore Future Price: Iron Ore futures are higher on the week and the day, with a potential base forming as sentiment towards the property market in China continues to improve

5yr-30yr Treasury Spread: The curve is flatter on the week but steeper today, with the belly recovering after sharp losses yesterday

EUR/JPY FX Cross: The Euro is stronger on the week and the day as the cross continues to bounce off the lows of its current range

ARTICLES BY MACRO THEMES
MEDIUM-TERM THEMES:
Real Supply-Side Improvements:
EZ Logistics: Supply Woes Start to Ease in Europe, but Businesses’ Costs Surge – WSJ
A monthly survey of European businesses by data firm IHS showed there were some easing of delays during November, but not enough to rein in rising costs and remove the threat of a further rise in consumer prices. IHS Markit’s measure of the time taken for parts ordered by factories to be delivered to them rose to 21.5 in November from 19.4 in October. A reading below 50.0 indicates that delivery times are getting longer, so the November reading indicates that delays are building at a slower pace.
Why it Matters:
Despite persistent shortages, European manufacturers reported a pickup in output during November, contributing to an acceleration in economic growth as activity in the services sector also strengthened. “We are seeing the first signs of increasing availability for some raw materials, but it is still too early to speak of a trend reversal here,” said a spokeswoman for German chemical giant BASF SE. “It is currently not foreseeable to what extent this development will stabilize and what influence this will have on prices.”

China Macroprudential and Political Loosening:
180: China’s Central Bank Signals Easing as Economic Risks Mount - Bloomberg
In its latest quarterly monetary policy report published Friday, the People’s Bank of China removed from its policy outlook a few key phrases cited in previous reports, including sticking with “normal monetary policy.” The report dropped previous phrases to “control the valve on money supply” and vowed not to “flood the economy with stimulus,” signaling more credit support in coming months.
Why it Matters:
We started believing China hit peak “crackdown” a month or so ago, and we will now increasingly see monetary and fiscal policy become more supportive. The Politburo meeting in December and Communist Party’s Central Economic Work Conference due in the same month will provide further clues on whether we will go from a more neutral stance (between the two types of policy) or become more accommodative.

LONGER-TERM THEMES:
National Security Assets in a Multipolar World:
Lost Ground: How the U.S. Lost Ground to China in the Contest for Clean Energy – NYT
The NYT revealed a hidden history of cobalt acquisitions in which the U.S. surrendered resources to China, failing to safeguard decades of diplomatic and financial investments in the Congo. The sale of two mines, also flush with copper, highlights the shifting geography and politics of the clean energy revolution, with countries rich in cobalt, lithium, and other raw materials needed for batteries suddenly playing the role of oil giants. The article elaborates on how China Molybdenum has acquired critical mines in the Congo due to U.S. inaction.
China’s pursuit of Congo’s cobalt wealth is part of a disciplined playbook that has given it an enormous head start over the United States in the race to dominate the electrification of the auto industry. On the other hand, a lack of a formal industrial policy for minerals and metals is now costing the United States. The Congo mines' loss complicates Biden’s push to make electric vehicles a central pillar of his climate change agenda. The bottom line, securing needed critical minerals will only grow in importance as economies become more electrified and digital while nations further commit to fighting climate change.

Everything is Bigger: Samsung to build U.S. chip plant amid global supply crunch – NikkeiAsia
Samsung Electronics will invest $17 billion to build a new foundry chip factory in Texas, as the Biden administration pushes to bring more semiconductor manufacturing onshore. The South Korean chipmaker will establish new production lines for foundry chips in Taylor, northeast of Austin, as Samsung already runs a foundry chip factory in Austin.
Why it Matters:
The development comes just days after Samsung Vice Chairman Lee Jae-yong made a weeklong visit to the U.S., meeting high-ranking White House officials, lawmakers, and business leaders, including Microsoft CEO Satya Nadella. While Lee was in the U.S., Katherine Tai, U.S. trade representative, visited Seoul last week, meeting executives from Samsung and other South Korean companies. She emphasized supply chain resilience in a meeting with South Korean Trade Minister Yeo Han-Koo on Friday and strongly urged the country to join U.S.-led global supply chain networks.

Electrification and Digitalization Policy:
Wearable Trends: Wear OS Share Surges on Samsung’s Highest Quarterly Smartwatch Shipments in Q3 2021 – Counterpoint
Global smartwatch shipments in the third quarter of this year increased 16% compared to the same period last year, continuing their double-digit growth following the previous quarter. Apple still held the No. 1 spot in Q3 2021, but its share fell 10% YoY as its Watch Series 7 launch was delayed to the fourth quarter. Thanks to the launch of the Galaxy Watch 4 series, Samsung achieved its highest quarterly shipments, narrowing the gap with Apple and reclaiming second place from Huawei. Amazfit ranked third due to its growing popularity in Europe.
Why it Matters:
We want to highlight the continued strong growth in wearables, furthering the importance of our digitalization and electrification theme. Two separate but interesting points from the report. First, there was a rapid growth in sales by Indian brands. Noise and boAt, which ranked first and second in the Indian smartwatch market, shipped more than double the volume from the previous quarter. Second, Google, through its partnership with Samsung, is increasingly taking market share from others.

Commodity Super Cycle Green.0:
Green Chickens: Whole Foods' Animal Welfare Certifier to Cut 90% of U.S. Chicken From Approved Supplies – Bloomberg
The Global Animal Partnership, an animal welfare certifier whose five-step method is championed by Amazon’s Whole Foods, is set to lower the number of breeds that meets its standards. According to people familiar with the process, it’s virtually impossible for any conventional chicken breeds, which make up more than 90% of U.S. production, to make the cut due to their performance in a study that informed the results.
Why it Matters:
While the new rules don’t go into effect until 2026, the move could drive changes in the industry, with over 200 companies, including Popeyes and Chipotle promising to transition to breeds that meet GAP’s standards. Consumers have become increasingly interested in animal welfare, and more than ever, are willing to pay for food with ethical claims. But because the costs of producing slow-growing birds are substantially higher than industrial chickens, breed changes on a large scale could lead to more expensive meat across the board.

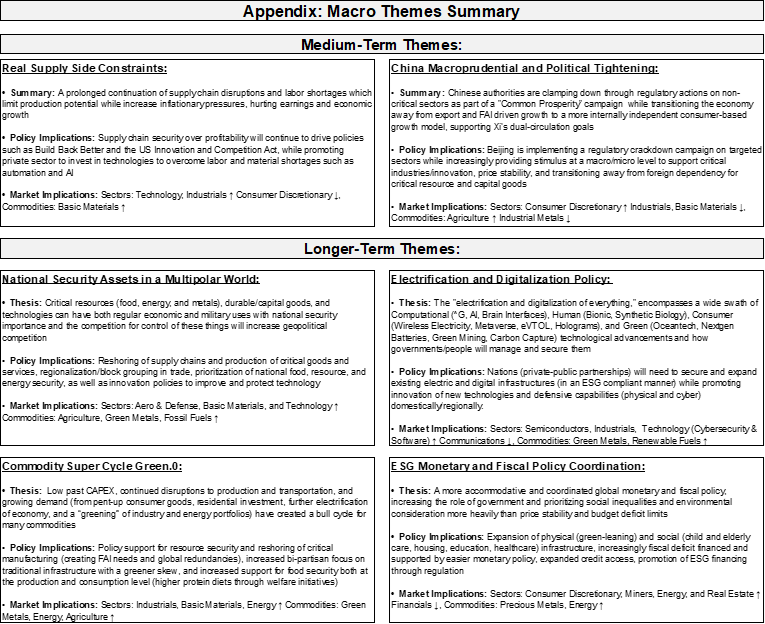
Current Macro Theme Summaries:
VIEWS EXPRESSED IN "CONTENT" ON THIS WEBSITE OR POSTED IN SOCIAL MEDIA AND OTHER PLATFORMS (COLLECTIVELY, "CONTENT DISTRIBUTION OUTLETS") ARE MY OWN. THE POSTS ARE NOT DIRECTED TO ANY INVESTORS OR POTENTIAL INVESTORS, AND DO NOT CONSTITUTE AN OFFER TO SELL -- OR A SOLICITATION OF AN OFFER TO BUY -- ANY SECURITIES, AND MAY NOT BE USED OR RELIED UPON IN EVALUATING THE MERITS OF ANY INVESTMENT.
THE CONTENT SHOULD NOT BE CONSTRUED AS OR RELIED UPON IN ANY MANNER AS INVESTMENT, LEGAL, TAX, OR OTHER ADVICE. YOU SHOULD CONSULT YOUR OWN ADVISERS AS TO LEGAL, BUSINESS, TAX, AND OTHER RELATED MATTERS CONCERNING ANY INVESTMENT. ANY PROJECTIONS, ESTIMATES, FORECASTS, TARGETS, PROSPECTS AND/OR OPINIONS EXPRESSED IN THESE MATERIALS ARE SUBJECT TO CHANGE WITHOUT NOTICE AND MAY DIFFER OR BE CONTRARY TO OPINIONS EXPRESSED BY OTHERS. ANY CHARTS PROVIDED HERE ARE FOR INFORMATIONAL PURPOSES ONLY, AND SHOULD NOT BE RELIED UPON WHEN MAKING ANY INVESTMENT DECISION. CERTAIN INFORMATION CONTAINED IN HERE HAS BEEN OBTAINED FROM THIRD-PARTY SOURCES. WHILE TAKEN FROM SOURCES BELIEVED TO BE RELIABLE, I HAVE NOT INDEPENDENTLY VERIFIED SUCH INFORMATION AND MAKES NO REPRESENTATIONS ABOUT THE ENDURING ACCURACY OF THE INFORMATION OR ITS APPROPRIATENESS FOR A GIVEN SITUATION.