


MIDDAY MACRO - 11/16/2021
Daily Color on Markets, Policy, and Geopolitics

MIDDAY MACRO - DAILY COLOR – 11/16/2021
OVERNIGHT-MORNING RECAP / MARKET WRAP
Narratives/Price Action:
Equities are higher, as a flat overnight turned positive following better than expected U.S. econ data, helping sentiment improve
Treasuries are flat, with the positive more risk-on tone not leading to further selling as the recent negative momentum seems stretched
WTI is lower, with the OPEC+ v.s. Biden Administration saga seeing no relief and expectations for an SPR release growing, meanwhile U.S. thermal coal prices are at a 12-year high thanks to strong overnight demand
Analysis:
“It’s all happening” with the underlying economic data today beating expectations and reducing inflationary fears/drags while technicals and optionality remain positive. Treasuries look to be cooling after notable selling pressure over the last few sessions drove yields in the belly to post-pandemic highs. We are increasingly becoming concerned with the move higher in the dollar, something weighing on commodities more than equities currently, but this could change quickly.
The Nasdaq is outperforming the S&P and Russell with Growth, Momentum, and Low Volatility factors, and Consumer Discretionary, Technology, and Health Care sectors all outperforming.
The S&P optionality levels have the Zero-Gamma Level moved higher to 4635 while the Call Wall is at 4700. The S&P is pushing through gamma resistance strikes currently while the vol trigger level (where selling would increase) and put wall (gravity on the downside) all moved higher.
The S&P technical levels have support at 4690, then 4675, and resistance around current levels (4700ish), then 4740. After consolidating for a few days, the S&P is increasingly looking ready to level higher and push to 4740.
Treasuries are flat, cooling after a multi-day sell-off started after the hotter than expected CPI print last week. The 5s30s curve is very slightly steeper to 74.4 bps.


*Supply disruptions are starting to ease, and this will help CPI increases decelerate

*Counterintuitively, higher-yielding sectors have outperformed during the last two tightening cycles

*The continued divergence between the MOVE Index and VIX is raising concerns
Today’s plethora of data gives us further conviction that the U.S. economy will outperform expectations in the fourth quarter thanks to better-than-expected consumer activity, continued inventory builds, and growing levels of business investment leading equities to continue melting higher into year-end despite macro headwinds remaining and valuations being historically high.
Growth (downgraded) and inflation (upgraded) forecasts continue to evolve negatively. We believe this continues to be too backward-looking as supply-side impairments are peaking and potential growth will become uncapped due to reduced shortages of materials and labor moving into the first half of next year while demand stays robust (markets price forward).

*We thinketh these so-called “economists” remain too bearish on capitalism’s ability to overcome problems
As the economy becomes uncapped, ’21 4th qtr and ’22 1st qtr earnings estimates will increasingly rise. Given the already strong pricing power firms have exhibited and our expectations for demand to stay strong while cost increases slow, the skew increasingly favors the overall S&P EPS to beat current expectations.

*S&P EPS are expected to drop in the next two quarters as analysts worry about the continuing effects of supply-side problems
Risk certainly remain, as seen again in today’s energy price increases in Europe, which will further inflationary fears, drive rates higher, and generally act as a tax on consumers, We have yet to see energy prices go parabolic in the U.S., but increases in price at the pump or for home heating would be a growing drag on the consumer and further reduce sentiment.

*After falling in October, energy prices in Europe are back on the rise, putting pressure on the entire global energy complex
Geopolitical tensions seem to be diminishing between the U.S. and China into the Olympics but are still elevated elsewhere. However, given the importance of the U.S.-China relationship on global growth, we see the “optical” improvements there as an important tailwind to risk sentiment currently.

*There is no clear way to quantify the world’s geopolitical risks fully, but the BlackRock Global Indicator has been picking up
Both global fiscal and monetary policy will undoubtedly become less supportive moving into 2022, but if increases in inflation slow (as we expect) while structural changes to labor markets persist, the major central banks will likely remain patient, keeping real rates low and financial conditions easy. The fiscal drag, however, is something we will be closely watching.

*Even if every central bank began to tighten, it would take time before rates/liquidity became meaningfully restrictive to financial conditions and negative for risk-assets
There are certainly more risks worth highlighting, such as the impressive increase in the dollar of late, which will function as a growing weight on S&P earnings, but in the interest of time and space, we believe energy and geopolitics are the two biggest currently.

*The $DXY is about halfway back to its pandemic highs, with technicals favoring further strength
Stepping back and looking at the big picture into year-end, fundamental improvements in the underlying U.S. economy coupled with positive technicals (seasonality, momentum, trend) and optionality in the market, as well as the still highly accommodative policy backdrop, all support staying tactically long U.S. equities.

*We would not be surprised to see an acceleration in the melt-up into year-end
Econ Data:
Retail Sales increased 1.7% MoM in October, above an upwardly revised 0.8% rise in September and beating market forecasts of 1.4%. Sales are now higher by 16.3% from a year ago. Excluding autos, sales were up 1.7%, and excluding gasoline rose 1.5%. Sales at non-store retailers recorded the most significant increase (4%), followed by sales at gasoline stations (3.9%), electronics and appliance stores (3.8%), and miscellaneous store retailers (2.8%).
Why it Matters: It is the strongest gain since March, as consumers spent more on early holiday shopping and gasoline. There were undoubtedly inflationary boosting effects on the top-line number, but when adjusted, the level of sales continued to be well above the pre-pandemic trend. Consumers clearly are concerned about inflation, as seen in sentiment surveys, but they have yet to alter their behavior meaningfully. Sales were flat for food services and drinking places, which will likely reverse in the final months of the year as people travel and gather more for the holidays. We expect momentum to continue to stay strong throughout the holiday period.

*Gains were broader-based than previous months, with a more positive trend in autos developing

*Even when adjusted for inflation, Retail Sales are well above their pre-pandemic trend

*Finally, declines in consumer confidence are becoming increasingly detached from actual consumer activity as the confidence data continues to have a negative partisan skew
The price for imports advanced 1.2% from a month earlier in October, accelerating from a 0.4% increase in September and above market expectations of a 1% rise. It was the largest monthly advance since a 1.3% rise in May. Import fuel cost jumped 8.6%, driven mainly by higher petroleum and natural gas prices. Meanwhile, prices for nonfuel imports went up 0.4% due to higher prices for nonfuel industrial supplies and materials, automotive vehicles, “foods, feeds, and beverages,” and consumer goods. On a yearly basis, import prices are higher by 10.7%. Export prices rose 18% over the last year, the fastest gain on record, going back to 1984.
Why it Matters: No signs of easing inflationary pressures here yet, despite a stronger dollar. The majority of the gains this month came from energy-related factors, but even when excluding those, the 0.5% MoM increase is still historically high. On a year-over-year basis, “foods, feeds, and beverages” rose 11.2%, which was the fastest gain in 10 years. Industrial materials prices picked up to 41.4% from 35.8% on the same basis. The prices of autos rose 2.7% on a 12-month change basis, which was not terrible given the level of shortages.

*Highest monthly increase in import prices since March due to fuel imports
Industrial production rose 1.6% in October 2021, rebounding from a -1.3% drop in September and beating market expectations of a 0.7% increase. Manufacturing output increased 1.2% and excluding a significant gain in the production of motor vehicles (22% MoM) and parts, factory output moved up 0.6%. Consumer goods production was higher by 1.4% MoM and business equipment production up 0.2% MoM. The output of utilities rose 1.2%, and mining output rose notably higher by 4.1% (Gulf Coast energy rebound). Manufacturing capacity utilization up 0.9% to 76.7%, its highest level since January 2019.
Why it Matters: The underlying components of this report were pretty positive. It was the biggest monthly gain in industrial activity since March, with half of the gain reflecting a recovery from the effects of Hurricane Ida. Easing in supply-side constraints were also apparent with motor vehicles and parts accounting for half the gains in manufacturing output. Overall, it looks like the supply-side disruption that capped growth in the third quarter notably improved. Coupled with the final resolution of Ida disruptions to the petro-chemical Gulf sector, industrial activity is gaining momentum. However, given what business surveys are showing, we would have liked to see a greater increase in business equipment spending, but much of the current Capex cycle that is occurring is more software-based.

*Capacity utilization is back above pre-pandemic levels, while momentum is picking up more generally for industrial production activities
Manufacturers’ and trade inventories rose 0.7% from a month earlier in September, following an upwardly revised 0.8% gain in August and in line with market expectations. Stocks rose the most among merchant wholesalers (1.4% vs. 1.3% in August) and manufacturers (0.8% vs. 0.7%), while inventories of retailers shrank (-0.2% vs. 0.2%). Year on year, business inventories is higher by 7.5%.
Why it Matters: All those ships sitting off our coasts are getting unloaded, despite the increasingly negative narrative that they aren’t. The decrease in retail inventories is in line with the Retail Sales data today, as it looks like consumers have increasingly moved forward holiday purchases. As we highlighted in yesterday’s note, with a graph provided by GS, the inventory build will not end following the holiday season, instead likely going well into next year’s summer. However, the urgency of the build should diminish, and manufacturers will become more price sensitive. As a result, we could see continued positive gains to growth (GDP) while not experiencing the current inflationary pressures nearly as much.

*The inventory/sales ratio, although varied among sectors, still has a long way to go before being at a more historical level
The NAHB housing market index increased by three points to 83 in November of 2021, the highest in six months, beating market forecasts of 80. The current single-family sub-index increased to 89 from 86, and the home sales over the next six months sub-index was steady at 84. The gauge for prospective buyers advanced to 68 from 65.
Why it Matters: Low inventories and strong demand pushed builder confidence higher for the third consecutive month even as supply-side challenges remain stubbornly persistent. “In addition to well-publicized concerns over building materials and the national supply chain, labor and building lot access are key constraints for housing supply,” said NAHB Chief Economist Robert Dietz. “Lot availability is at multi-decade lows, and the construction industry currently has more than 330,000 open positions.” As a result, things could get even better if some of these additional problems abate throughout the first half of next year.

*Increases to the overall gauge came from improvements in current sales and increases in prospective buyer foot traffic
TECHNICALS / CHARTS
Four Key Macro House Charts:
Growth/Value Ratio: Growth is higher on the week and today as Large-Cap Growth is outperforming all other Size/Value factors on the day

Chinese Iron Ore Future Price: Iron Ore futures are lower on the week and the day despite several Chinese property developers announcing plans to issue debt, fueling expectation for easing financing for the struggling sector

5yr-30yr Treasury Spread: The curve is steeper on the week and little changed on the day

EUR/JPY FX Cross: The Yen is stronger on the week but the Euro is slightly stronger on the day. The selling pressure the Euro has seen lately is impressive with the EUR/USD cross sitting at 1.134

ARTICLES BY MACRO THEMES
MEDIUM-TERM THEMES:
Real Supply-Side Constraints:
Not All Bad: What Does Inflation Mean for American Businesses? For Some, Bigger Profits – WSJ
Companies are paying higher wages, spending more on materials, and absorbing record freight costs, pushing up economic inflation gauges. They are also reporting some of their best profitability in years. Nearly two out of three of the biggest U.S. publicly traded companies have reported fatter profit margins so far this year than they did over the same stretch of 2019, before the Covid-19 outbreak, data from FactSet show. Nearly 100 of these giants have booked 2021 profit margins at least 50% above 2019 levels.
Why it Matters:
Widespread inflation makes it easier to broach the topic of raising prices with customers. As a result, profit margins often rise with inflation. The risk to the economy is that price hikes not only stick but also convince customers that more increases are inevitable, spurring inflationary demand and sparking a vicious cycle. We continue to believe that the needed criteria for a multi-year longer-lasting inflationary cycle that utilizes demand, supply, and wage dynamics exist, but we are currently due for cooling on price rises as supply-side constraints alleviate.

*GS expects 2022 S&P 500 Profit Margins to marginally improve
China Macroprudential and Political Tightening:
Too Far: China Left in Shock Following Brutal Killing of Corgi During Covid-19 Disinfection – WSJ
The fatal beating of a pet corgi by epidemic prevention workers disinfecting a residential building linked to a Covid-19 outbreak in southeastern China has sparked outrage in China, leading some pet owners and animal rights activists to question the extent of China’s stringent pandemic-control measures. There have been reports of other pet animals being euthanized throughout the pandemic, though some cities are more accommodating. There are special isolation points for pets in Beijing, while in Shanghai, some residents who were sent to quarantine were seen carrying their pet dogs with them.
Why it Matters:
As the zero-tolerance policy becomes increasingly less popular around the world, we believe it will be incidents like this that ultimately lead to changes in that policy. In keeping with our theme from last week, what’s the point of joining the middle-class if everything you have can easily be taken from you with no recourse, including beloved pets. Imagine authorities in America coming into someone’s home and killing their pet because it might have a virus that kills less than 0.5% of people infected. Again we highlight this to show that Beijing/Xi will increasingly have to grapple with the Chinese people wanting more rights and security as their wealth grows given it all rests on them, (unlike in democracies where it’s on the individual).

LONGER-TERM THEMES:
National Security Assets in a Multipolar World:
Space Junk: Russian test blamed for space junk threatening space station – AP
A Russian weapons test created more than 1,500 pieces of space junk now threatening the seven astronauts aboard the International Space Station, according to U.S. officials who called the strike reckless and irresponsible. Once the threat became clear early Monday morning, the four Americans, one German and two Russians onboard the ISS were ordered to immediately seek shelter in their docked capsules.
Why it Matters
The test clearly demonstrates that Russia “despite its claims of opposing the weaponization of outer space, is willing to imperil the exploration and use of outer space by all nations through its reckless and irresponsible behavior,” U.S. Secretary of State Antony Blinken said in a statement. The U.S. Space Command was already tracking some 20,000 pieces of space junk, including old and broken satellites from around the world. We highlight this development to point out that space activities rely on partnerships between the major global powers. When one goes rogue, as Russia did, it has the potential to affect much of space’s infrastructure negatively.
")
Subsidizing: EU Opens Door to More State Aid for Chip-Makers – Bloomberg
The European Commission, the EU’s executive arm, may agree to a new approach to state-aid policies when it meets on Wednesday that could allow governments to subsidize cutting-edge chip plants in Europe. Given the importance and difficulty of securing chip supplies, the commission “may envisage approving public support to fill possible funding gaps in the semiconductor ecosystem for the establishment in particular of European first-of-a-kind facilities.”
Why it Matters:
The shortage of chips hampering European manufacturers this year has highlighted the limits of the bloc’s technological muscle. The supply-chain crisis has also opened up a bitter debate between larger member states led by France calling for more state intervention to help companies compete with the U.S. and China and those who want to stick to the EU’s free-market approach. We continue to believe the longer-term trend is reshoring critical production and more regionalization regarding trading.

Electrification and Digitalization Policy:
Flying Too Low: Fight Over 5G and Aviation Safety Clouds Big Investments by AT&T, Verizon – WSJ
AT&T and Verizon earlier this month said they would delay the launch of some fifth-generation wireless services after the Federal Aviation Administration warned it could restrict U.S. airspace in bad weather if the networks were turned on as planned in December. Almost a year earlier, transportation officials had asked to postpone the government’s auction of the airwaves to wireless operators and warned they could impose flight restrictions if not satisfied.
Why it Matters:
The FCC and FAA have said they are working closely together, and both said they are committed to ensuring public safety while advancing the latest broadband technology. To resolve the impasse, the two agencies must work out a compromise. The FCC has allowed cellular service over the airwaves in question, known as C-band, and only its current leaders have the power to tweak those permissions. But if FAA officials aren’t satisfied, they have their own power to issue safety warnings that could result in significant flight disruptions. There is still some degree of uncertainty about how things will be resolved and we will be following closely.

ESG Monetary and Fiscal Policy Expansion:
Regulated: European Gas Prices Jump on Delay to New Russian Pipeline – Bloomberg
The German regulator said Tuesday it suspended the certification procedure for the Nord Stream 2 project because the operator of the pipeline decided to set up a German subsidiary, which will be the owner of the section of the pipeline in the country. The permitting process has been halted until assets and people are transferred to the new unit.
Why it Matters:
Benchmark European gas prices surged as much as 12% after the announcement as it adds to the uncertainty over how much gas the energy-hungry market will have this winter. Many in Europe expect Russia to significantly increase supplies only when the pipeline is approved. “We haven’t got enough gas at the moment, quite frankly,” Jeremy Weir, chief executive officer of Trafigura Group, said at a conference Tuesday. “There is a real concern potentially. If we have a cold winter, we could have rolling blackouts in Europe.”

*Nat gas prices in Europe are rising again today due to the delay in opening Nord Stream given the amount the EZ depends on Russian gas
Price Sensitive: Rising Natural-Gas Prices Pose Hurdle for Methane Tax – WSJ
Concerns about rising home heating costs are clouding prospects for a proposed tax on methane leaks in the $2 trillion social and climate spending bill backed by President Biden and congressional Democrats. The tax would charge oil-and-gas producers for methane leaks from wellheads, pipelines, storage tanks, and other facilities. The Congressional Budget Office hasn’t weighed in the financial impact, but independent analysts have said it would cost producers between $1 billion and $10 billion annually.
We see this as a great example of idealism vs. reality. Despite pledges by global governments at COP26 to greenify their economies, in reality, the pace and scope more liberal/progressive political parties can implement their energy transition policies will be affected by the current energy costs voters are experiencing. For example, if inflation continues to remain persistent, the Democrats will likely not only lose the House but potentially the Senate. As a result, we expect more moderate forces to craft the social stimulus bill, resulting in less environmentally impactful policies.

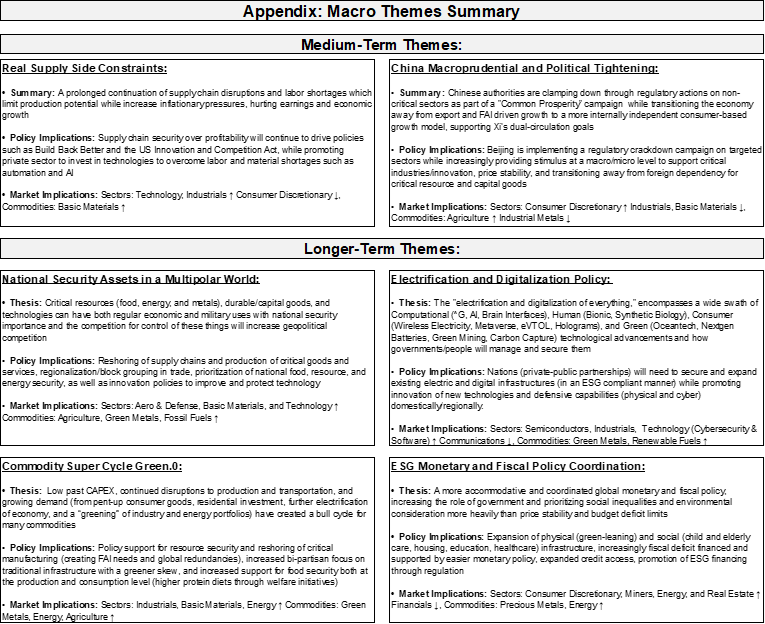
Current Macro Theme Summaries:
VIEWS EXPRESSED IN "CONTENT" ON THIS WEBSITE OR POSTED IN SOCIAL MEDIA AND OTHER PLATFORMS (COLLECTIVELY, "CONTENT DISTRIBUTION OUTLETS") ARE MY OWN. THE POSTS ARE NOT DIRECTED TO ANY INVESTORS OR POTENTIAL INVESTORS, AND DO NOT CONSTITUTE AN OFFER TO SELL -- OR A SOLICITATION OF AN OFFER TO BUY -- ANY SECURITIES, AND MAY NOT BE USED OR RELIED UPON IN EVALUATING THE MERITS OF ANY INVESTMENT.
THE CONTENT SHOULD NOT BE CONSTRUED AS OR RELIED UPON IN ANY MANNER AS INVESTMENT, LEGAL, TAX, OR OTHER ADVICE. YOU SHOULD CONSULT YOUR OWN ADVISERS AS TO LEGAL, BUSINESS, TAX, AND OTHER RELATED MATTERS CONCERNING ANY INVESTMENT. ANY PROJECTIONS, ESTIMATES, FORECASTS, TARGETS, PROSPECTS AND/OR OPINIONS EXPRESSED IN THESE MATERIALS ARE SUBJECT TO CHANGE WITHOUT NOTICE AND MAY DIFFER OR BE CONTRARY TO OPINIONS EXPRESSED BY OTHERS. ANY CHARTS PROVIDED HERE ARE FOR INFORMATIONAL PURPOSES ONLY, AND SHOULD NOT BE RELIED UPON WHEN MAKING ANY INVESTMENT DECISION. CERTAIN INFORMATION CONTAINED IN HERE HAS BEEN OBTAINED FROM THIRD-PARTY SOURCES. WHILE TAKEN FROM SOURCES BELIEVED TO BE RELIABLE, I HAVE NOT INDEPENDENTLY VERIFIED SUCH INFORMATION AND MAKES NO REPRESENTATIONS ABOUT THE ENDURING ACCURACY OF THE INFORMATION OR ITS APPROPRIATENESS FOR A GIVEN SITUATION.