


MIDDAY MACRO - 10/25/2021
Daily Color on Markets, Policy, and Geopolitics

MIDDAY MACRO - DAILY COLOR – 10/25/2021
OVERNIGHT/MORNING RECAP & MARKET ANALYSIS
Narratives/Price Action:
Equities are positive, adding to overnight gains despite NY-open jitters due to worries over tech earnings and supply-chain/inflation warnings as the bulk of Q3 earnings season gets underway this week
Treasuries are higher, with a growing risk on tone not yet moving yields higher, helping the curve bull steepen
WTI is flat, giving back morning gains, as traders weigh the effects of new Covid-lockdowns in China and increasing supply from Saudi Arabia, which is expected to be pumping 10m b/d by December
Analysis:
The S&P is hitting new all-time highs as bullish sentiment continues into the core of Q3 earnings season this week despite growing worries over big-tech and continued comments by CEOs on increasing inflation. Treasuries are generally shrugging off these worries as well as pressures from higher energy costs, with price action there somewhat muted.
The Nasdaq is outperforming the Russell and S&P with Momentum, Small-Cap, and Growth factors, and Consumer Discretionary, Materials, and Energy sectors all outperforming.
S&P optionality strike levels have the Zero-Gamma Level moved higher to 4468 while the Call Wall fell back to 4500. Generally, a shift lower in the Call Wall is a bearish signal as it implies traders are not building call positions overhead (although there is still a sizeable level of positions at 4550). This coincides with a drop in Risk Reversal metrics, which implies traders have come off highly bullish sentiment levels.
The technical levels have support at 4550, then 4525, and resistance at 4585 for the S&P. Clearing the 4550-zone is now key (and currently occurring) as the S&P has been bouncing/consolidating around there since last Thursday.
Treasuries are higher, with the 5s30s curve steeper by 3.4bps. The 10yr yield chart has formed a head-and-shoulders formation (on the hourly) with a drop to the low 1.50s looking possible.


*This is a big week for Q3 earnings, with the trend so far this season being positive regarding top and bottom-line beats

*Retail traders were active buyers of dips last month

*GS highlighted in a recent report that “tentative signs of improvement from supply chain data and commodity prices” are beginning to show in the last two weeks.

*MS believes savings have been more widely distributed among various wealth cohorts, helping explain the continued high levels of demand and labor shortages (verse if it was just higher-income consumers)
With one of the heaviest earnings weeks of the season beginning, it's worth highlighting that the third-quarter S&P earnings reported so far have gone well, leading us to believe firms have been able to navigate supply-side disruptions and shortages, defending margins and still growing top and bottom lines.
23% of S&P firms have reported third-quarter earnings so far, with 84% coming in with earnings-per-share higher than expected, and 75% reported a positive revenue surprise, bringing the current year-over-year earnings growth rate for the S&P to 32.7%, according to FactSet.

Average margins across the S&P are tracking at 12.5%, the third-highest on record, with companies increasing prices however they can while aggressively growing inventories from anywhere possible. The exception being consumer staples and discretionary, which have seen year-over-year margin compression.
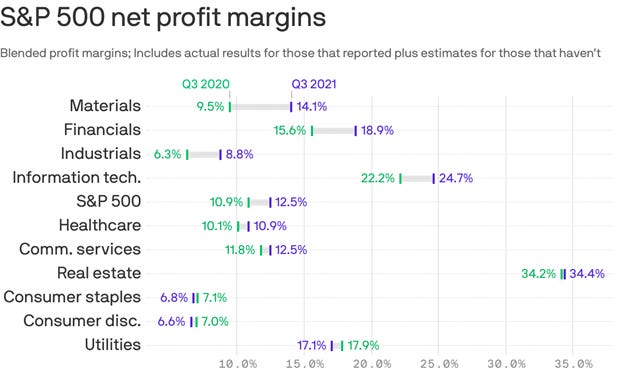
So far, misses have been punished by a historically high level, while beats have not been rewarded (post-pandemic theme). The median company is beating estimates by a more moderate rate of 6.7% and only realizing a 0.1% price gain in the following day.

As a result of the near historical level of beats so far in the third quarter, the consensus estimates for Q4 earnings have risen, primarily driven by upgrades in the energy sector followed by financials. Higher oil prices and rising yields are clearly helping sentiment for both.

*Companies are showing the ability to navigate the supply-side headwinds while yields and energy prices have increased…

*…leading analyst to increase Q4 earning estimates, especially for the energy and financial sectors
Econ Data:
The Dallas Fed Manufacturing Index rose by 10 points to +14.6 in October, up from the previous month's 14-month low of +4.6. Production (-5.9 to 18.3) and Capacity Utilization (-4.4 to 20.1) fell, suggesting a slower pace of still positive activity in the Texas region. However, New Orders (+5.4 to 14.9) and the Growth Rate of New Orders (+11.1 to 13.6) showed solid increases on the month. Supply-chain disruptions continued to plague many manufacturers, and the Unfilled Orders and Delivery Time indexes advanced to +20.9 and +25.9, respectively. There was a decrease in Prices Paid (-4.1 to 76.3) while firms reported an increase in Prices Received (+5.8 to 49.8). Finally, labor market measures indicated robust employment and wage growth with longer workweeks.
Why it Matters: This was a better regional report from the Dallas Fed showing some relief to the known disruptions and shortages. More importantly, the future outlook business indicators improved, with expectations for Delivery Times and Prices paid to drop. Keeping with what we have seen elsewhere, there was no decrease in demand with current and future New Orders and the Growth Rate of New Orders increasing. Although current Wage and Benefits were up only marginally, expectations for what will happen in six months increased significantly, indicating firms may be becoming more comfortable with raising wages in the future to meet growing demand now that uncertainties from the summer’s rise in Delta are passing.

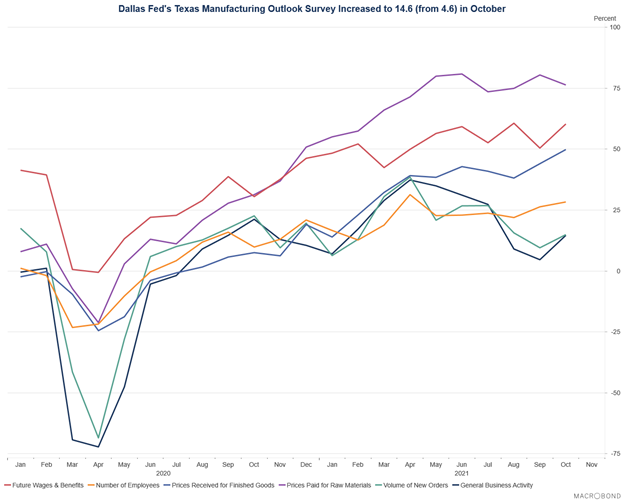
*General Business Activity bounced off recent lows thanks to increases in measures of new orders and labor measures while production and prices paid fell
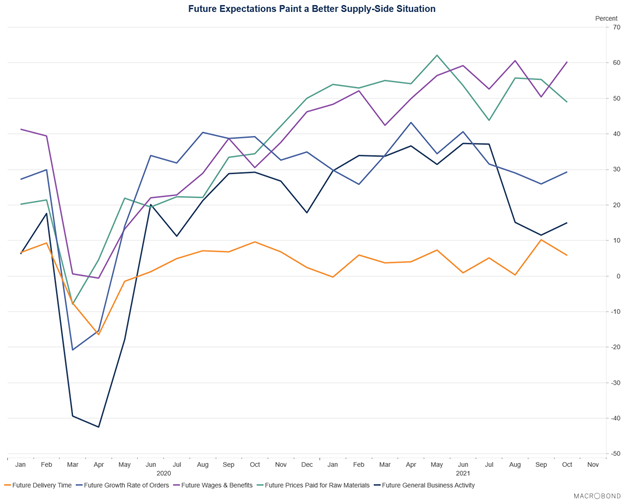
*The Future General Business Activity also increased primarily thanks to expectation that production levels would be uncapped due to improvements in material and labor availability while price and delivery time pressures would subside
The Chicago Fed National Activity Index dropped to -0.13 in September from 0.05 in August, the lowest since April and showing economic growth in the US lost momentum for a second consecutive month. Production-related indicators contributed -0.37, down from -0.08 in August, as industrial production declined 1.3%. The sales, orders, and inventories category contributed +0.07 from +0.01, and employment-related indicators contributed +0.16, up from +0.09. The contribution of the personal consumption and housing category was unchanged at +0.02. Also, the index’s three-month moving average moved down to +0.25 in September from +0.38 in August.
Why it Matters: Despite the headline drop, the underlying components, which summarize what we already know, show demand is not weakening, and growth continued to be capped by shortages of materials and labor. We don’t need to reiterate this known story and simply highlight the Chicago Fed’s NAI as a good summarization of last month's slowdown in production while the consumer remained resilient.

*The consumer side of the data has held up well, with the bulk of September’s drag coming from decreases in production
TECHNICALS / CHARTS
FOUR KEY MACRO HOUSE CHARTS:
Growth/Value Ratio: Growth is higher on the week and the day despite fears (thanks to Facebook) that earnings would be weaker than expected for the tech sector

Chinese Iron Ore Future Price: Iron Ore futures are lower on the week, and the day, as there was a more mixed risk tone in China due to increased Covid lockdowns verse growing expectations for further policy support from Beijing

5yr-30yr Treasury Spread: The curve is steeper on the week, with yields lower today as Treasuries, energy, and equities are a little unhinged from their normal relationships today

EUR/JPY FX Cross: The Yen is higher on the week, but little changed today as Germany’s IFO Business Climate survey was in line with expectations

HOUSE THEMES / ARTICLES
MEDIUM-TERM THEMES:
China Macroprudential and Political Tightening:
Missing Confidence: Covid-19 Sets Back China’s Plans to Rebalance Its Economy – WSJ
Unlike the U.S., which saw a rapid rebound in consumer spending during the pandemic, China has seen consumption stay subdued. Retail sales still aren’t growing as rapidly as they were before Covid-19. The most recent figures, for September, rose by 4.4% from a year earlier, well below the 8% pace in the full year of 2019. Chinese exports, however, have gone gangbusters. As the pandemic has threatened production in manufacturing bases elsewhere in Asia, including Vietnam and Malaysia, China is expected to grab an even bigger share of global exports this year, after reaching a record of 15% in 2020.
Why it Matters:
Chinese leaders have made boosting domestic demand a priority for more than a decade. The push picked up more urgency last year when Chinese leader Xi Jinping laid out a “domestic circulation” plan prioritizing domestic consumption as one of China’s main growth sources while reducing reliance on foreign investments and exports. However, China’s consumers haven’t played along, and it is becoming clear that Covid-19 set China back in its longer-term goal of rebalancing the country’s economy.

LONGER-TERM THEMES:
Electrification and Digitalization Policy:
The Playbook: Russia Is Censoring the Internet, With Coercion and Black Boxes - NYT
The telecom companies had no choice but to step aside as government-approved technicians installed their equipment linked back to a command center in Moscow, giving the authorities startling new powers to block, filter, and slow down websites that they did not want the Russian public to see. The process, underway since 2019, represents the start of perhaps the world’s most ambitious digital censorship effort outside China.
Why it Matters:
The world got its first glimpse of Russia’s new tools in action when Twitter was slowed to a crawl in the country this spring. Other sites have since been blocked, including several linked to the jailed opposition leader Alexei A. Navalny. “This is something the world can copycat,” said Laura Cunningham, a former head of State Department programs on internet freedom. “Russia’s censorship model can quickly and easily be replicated by other authoritarian governments.”

Not Surprising: Four revelations from the Facebook Papers - FT
Thousands of pages of internal documents were released showing the true underbelly of Facebook. Here are four surprising revelations the documents contain:
Facebook is often accused of failing to moderate hate speech on its English-language sites, but the problem is much worse in countries that speak other languages.
Several documents show Facebook stumped by its own algorithms, not fully understanding why it prioritizes men and minorities when sending political content.
Facebook has long said its artificial intelligence programs can spot and take down hate speech and abuse, but the files show it has significant limits.
The documents reveal Facebook’s struggle to contain the explosion of hate speech and misinformation on its platform around the January 6 riot in Washington, prompting turmoil internally.
Why it Matters:
We have frequently covered the greed and fear that drive Facebook. It continues to play a crucial role in spreading disinformation and hate speech. It looks like the world is slowly catching on, and despite Facebook's considerable lobbying efforts, the company will face increasing regulatory hurdles globally moving forward (as well as a changing personal info/advertisement backdrop). Also, younger people are disengaging from the platform, likely due to its growing negative image, leaving us to wonder if our angry-drunk-racist uncle will be the last one using it one day.

Commodity Super Cycle Green.0:
Need Sludge: Supply-Chain Disruptions Encourage Rio Tinto to Mine Its Own Sludge for Critical Minerals – WSJ
Waste produced at Rio Tinto’s Kennecott mine near Salt Lake City contains a clutch of critical minerals that have long been overlooked by global miners. Now, these lesser-known minerals are becoming more valuable as the U.S. and its allies worry about the security of supply amid geopolitical tensions and disruptions in exporting countries due to the pandemic and a power crunch. Rio Tinto is building a plant at Kennecott that will recover tellurium, a critical mineral used in solar panels, from ore that has been dug up for its copper. The U.S. relies on imports of tellurium, including from China, which dominates global production.
Why it Matters:
Recent months have seen worsening shortages of some commodities, including magnesium used by the global automotive industry, resulting in a surge in prices. Earlier this year, President Biden ordered a review of America’s supply chains, including for minerals critical to the economy and national defense. “Suddenly, you see some pretty extreme demand for certain things,” Rio Tinto Chief Executive Jakob Stausholm said in an interview. We expect a continued drive through public/private partnerships to secure rare earth supplies.

ESG Monetary and Fiscal Policy Expansion:
Shrinking: Biden Pares Back Policy Goals in Search of a Deal – WSJ
Eager for an agreement by the end of October, President Biden has been willing to compromise on key planks of his domestic agenda. He told lawmakers Tuesday that Mr. Manchin’s opposition to a clean energy program, a key part of the bill’s climate change provisions, meant it would need to be scrapped. And he noted that Ms. Sinema had opposed raising tax rates on the wealthy and corporations, likely meaning the “pay fors” will be reduced.
Why it Matters:
Polls this month show many voters don’t know much about what Democrats are proposing in the “social infrastructure” bill and don’t believe the legislation will help them personally. Democrats point to other polls showing support for individual pieces of their plan and argue that voters will embrace the package once they see the full picture. At this point, we don’t have a final bill, so as upbeat as Democratic leaders sound, it is still a little unclear what is coming. However, it does look like something is finally coming.

Green for Green: The U.S. Is Turning Green. What Will This Climate Plan Cost and Who Will Pay? – WSJ
The U.S. is joining nearly 200 countries at the United Nations climate conference in Glasgow, Scotland. Washington and the private sector are expected to pledge to spend trillions of dollars to reduce carbon emissions. The total bill could require tens of trillions in investments, though estimates like these are inherently speculative. The highest and most measurable cost would be to generate and deliver all of the country’s electricity using renewable resources. The bill would range from $7.8 trillion to $13.9 trillion over the next 30 years, according to a team of energy researchers at Princeton University.
Why it Matters:
The bill would be shared among the federal and state governments, businesses, and consumers. Banks and investors are committing to shift funding away from fossil-fuel producers and to businesses that will help reduce carbon emissions. There would be job losses and new jobs created. At the same time, the cost of extreme weather, often made worse by climate change, like the wildfires, drought, heatwaves, storms, and floods of this summer, are growing. We highlight all this as nothing new but simply the continuation of a multi-decade transition that the United Nations COP26 Glasgow meeting will bring further attention to next week.


VIEWS EXPRESSED IN "CONTENT" ON THIS WEBSITE OR POSTED IN SOCIAL MEDIA AND OTHER PLATFORMS (COLLECTIVELY, "CONTENT DISTRIBUTION OUTLETS") ARE MY OWN. THE POSTS ARE NOT DIRECTED TO ANY INVESTORS OR POTENTIAL INVESTORS, AND DO NOT CONSTITUTE AN OFFER TO SELL -- OR A SOLICITATION OF AN OFFER TO BUY -- ANY SECURITIES, AND MAY NOT BE USED OR RELIED UPON IN EVALUATING THE MERITS OF ANY INVESTMENT.
THE CONTENT SHOULD NOT BE CONSTRUED AS OR RELIED UPON IN ANY MANNER AS INVESTMENT, LEGAL, TAX, OR OTHER ADVICE. YOU SHOULD CONSULT YOUR OWN ADVISERS AS TO LEGAL, BUSINESS, TAX, AND OTHER RELATED MATTERS CONCERNING ANY INVESTMENT. ANY PROJECTIONS, ESTIMATES, FORECASTS, TARGETS, PROSPECTS AND/OR OPINIONS EXPRESSED IN THESE MATERIALS ARE SUBJECT TO CHANGE WITHOUT NOTICE AND MAY DIFFER OR BE CONTRARY TO OPINIONS EXPRESSED BY OTHERS. ANY CHARTS PROVIDED HERE ARE FOR INFORMATIONAL PURPOSES ONLY, AND SHOULD NOT BE RELIED UPON WHEN MAKING ANY INVESTMENT DECISION. CERTAIN INFORMATION CONTAINED IN HERE HAS BEEN OBTAINED FROM THIRD-PARTY SOURCES. WHILE TAKEN FROM SOURCES BELIEVED TO BE RELIABLE, I HAVE NOT INDEPENDENTLY VERIFIED SUCH INFORMATION AND MAKES NO REPRESENTATIONS ABOUT THE ENDURING ACCURACY OF THE INFORMATION OR ITS APPROPRIATENESS FOR A GIVEN SITUATION.