


MIDDAY MACRO - 10/15/2021
Daily Color on Markets, Policy, and Geo-Politics

MIDDAY MACRO - DAILY COLOR – 10/15/2021
OVERNIGHT/MORNING RECAP & MARKET ANALYSIS
Narratives/Price Action:
Equities are higher, helped by upbeat earnings, better economic data, more accommodative policy rhetoric out of China, and reduced inflationary fears from a more stable energy complex
Treasuries are lower, as a more risk-on tone globally is reversing yesterday’s gains while still keeping the curve near its flattest levels of the year
WTI is higher, helped by the IEA increasing its demand outlook due to rising expectation power generation will increasingly switch to oil from coal and natural gas
Analysis:
U.S. equities continue their multi-day rally, joined increasingly by Asia and Europe last night. The S&P is now above its 50-dma as sentiment continues to improve due to stabilizing inflationary fears, better than expected earnings and economic data today, as well as hope for increased policy support in China. Meanwhile, Treasuries and global fixed income more generally are under increasing pressure due to the more risk-on tone.
The S&P is outperforming the Russell and Nasdaq with Momentum, Value, and Small-Cap factors, and Consumer Discretionary, Financials, and Industrials sectors are all outperforming.
S&P optionality strike levels have the zero-gamma level higher at 4407 while the call wall is still 4500. Following yesterday’s rise, the S&P now has a relatively large positive gamma position centered on the 4450 strike level. This helps reduce volatility, increasing participation, and supporting momentum, but there is little support until 4400 if things stall.
The technical levels have support at 4430 (50-dma area), then 4405, and resistance at 4460, then 4520. There is a “sloppy” inverse head and shoulder formation on the S&Ps daily, which is bullish given a breakthrough of the neckline, conveniently at 4460-70, where momentum is currently stalled and hitting technical (and optionality resistance).
Treasuries are lower, as the weekly rally has stalled/reversed as global fixed income markets sold-off due to the more risk-on tone. The 5s30s curve is slightly flatter by 1.6bps today, moving it to its lowest level of the year at 95 bps.

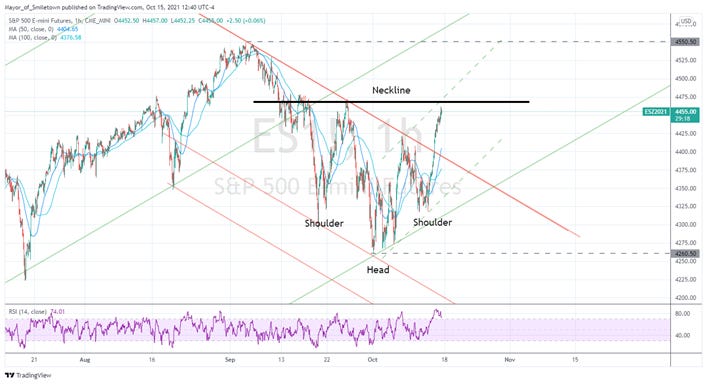
*The S&P has the resemblance of an inverted head and shoulder formation, a bullish technical formation, despite the right shoulder never fully reclaiming the neckline

*Good end-of-year seasonals and reporting period outperformance are both supportive of further gains for the S&P currently

*There is a growing levels of consensus view by market participants
Econ Data:
Retail sales in the US unexpectedly increased 0.7% mom in September on broad-based increases, following an upwardly revised 0.9% increase in August, beating market forecasts of a -0.2% fall. Excluding autos, sales increased 0.8%. Restaurants and bars, the only services-spending category in the report, rose 0.3% after a 0.2% increase in the prior month. Motor vehicle and parts dealer sales rose 0.5% in September after a 3.3% decline a month earlier.
Why it Matters: The rise in Delta again promoted the purchase of goods (staying-in) over services (going-out), something that is better captured by Retail Sales data. It is also important to note that the data captured not only a persistent consumer but also rising prices. This was clear in motor vehicle sales, which had declining volumes but higher average sales prices due to the supply chain constraints. So an inflationary environment will always buffer a decline in transaction volume. However, and to be clear, we see this report as positive, reflecting robust back-to-school purchases while also signaling a greater potential for a strong holiday buying season as the re-opening continues and consumers regain confidence lost due to the summer’s Delta uptick.
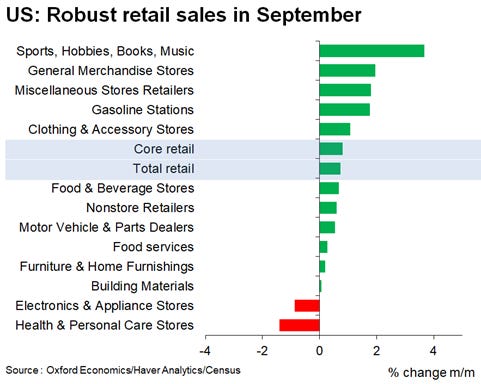
*A broad-based increase across the majority of categories with a stay-at-home and supply-chain disruption tilt

*Retail spending continues to be above its pre-pandemic trend
The University of Michigan's consumer sentiment fell to 71.4 in October from 72.8 in September, below market forecasts of 73.1. The gauge of Current Conditions dropped to 77.9 from 80.1, while the Expectations sub-index went down to 67.2 from 68.1. Meanwhile, inflation expectations for the year-ahead edged up to 4.8% from 4.6%, while the 5-year outlook eased to 2.8% from 3%.
Why it matters: The survey’s summary spent a lot of time going into the drag that current events in D.C. are having on confidence. The report highlighted that confidence in government economic policies has significantly declined during the past six months. When respondents were asked about their confidence in economic policies, favorable evaluations fell to 19% in early October from Biden's initial high of 31% in April, while unfavorable policy evaluations rose to 48% in early October from 32% in April. The decline in confidence in economic policies was recorded across all age, income, and education subgroups as well as among Democrats, Independents, and Republicans. However, we continue to see Republican respondents increasingly negative in their general responses (and likely significantly skewing views on government economic policy down). The spread between Republican and Democratic respondents increased again after shrinking in August. We believe the more negative tilt from Republican respondents was due to more significant increases in Delta cases in areas they are the demographic majority. As a result, despite growing worries about economic policy in D.C., we should see improvements in outlooks there.

* It's hard to believe consumer sentiment is as bad now as it was during the initial days of the pandemic (but it is)

*Confidence in government economic policy is falling further, likely increasingly driven by Republican respondents.
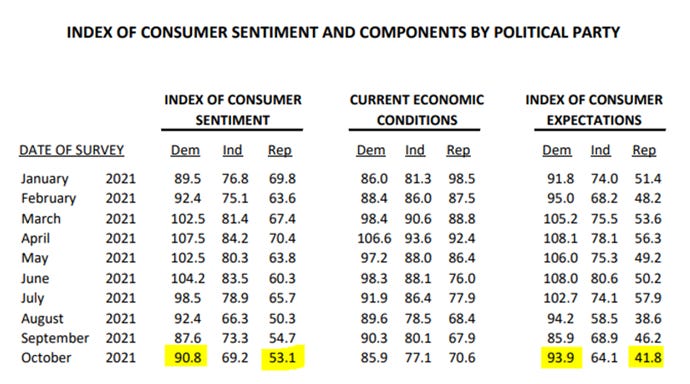
*Self-identified Republican and Independent respondents are responsible for declines at the headline level in Consumer Sentiment and Consumer Expectation indexes
The US import prices increased 0.4% in September, lower than market expectations of a 0.6% increase, moving the year-over-year price increase to 9.2% from 8.9%. Import fuel cost rose 3.7%, after decreasing 3% the previous month, driven by higher petroleum and natural gas prices. Excluding fuels, imports were unchanged, after edging down 0.1%, as a drop in cost for non-fuel industrial supplies and materials offset gains in prices for foods, feeds, and beverages, consumer goods, and automotive vehicles. Prices for US exports edged up 0.1% MoM, slowing from a 0.4% increase in August and missing market expectations of a 0.6% increase. It was the 16th straight monthly rise in export prices, although at the softest pace in the current sequence.
Why it Matter: A positive report showing that the stronger dollar is helping offset some inflationary pressures from imports. Also, The U.S.’s reduced dependence on foreign-sourced fossil fuels means the unchanged non-fuel index holds more importance and slightly reduces inflationary fears as a mosaic with other things.
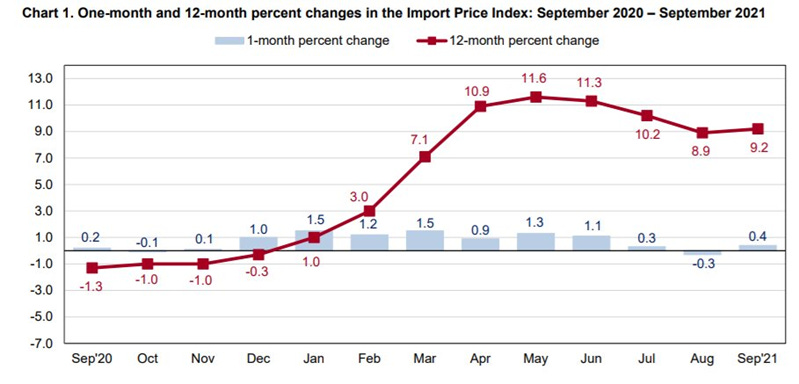
*Slight uptick in headline import prices due to increases in gas and oil imports
The New York Fed’s Empire State Manufacturing Index fell fifteen points to 19.8 in October from 34.3 in September, below market forecasts of 27. New orders and shipments increased slower than last month, while labor market indicators pointed to ongoing growth in employment and the average workweek at a reduced rate. Meanwhile, the delivery times index hit a record high, and both the prices paid and prices received indexes held near record highs. Looking ahead, firms were still historically optimistic that general business conditions would improve over the next six months, although supply-side disruptions are expected to continue.
Why it Matters: A lukewarm report at best, taking the headline index back near lows of the year. Clearly, there is yet to be any meaningful improvement in supply-side disruptions, something we continue to speak to daily. The persistence of a more positive outlook despite the increasing expectation that disruption will continue into the middle of next year is an interesting development, encapsulating the strong demand verse weak supply dilemma facing firms well. We expect logistical and labor troubles to improve post-holiday season, and as a result, sentiment/outlook could improve quickly in the first half of 2022.

*Future outlook still remains strong; however, changes in sub-indexes reflected a belief that supply-side disruptions will continue into mid-2022

*The Current Condition subindexes did not show any improvement in current supply-side disruptions.
TECHNICALS / CHARTS
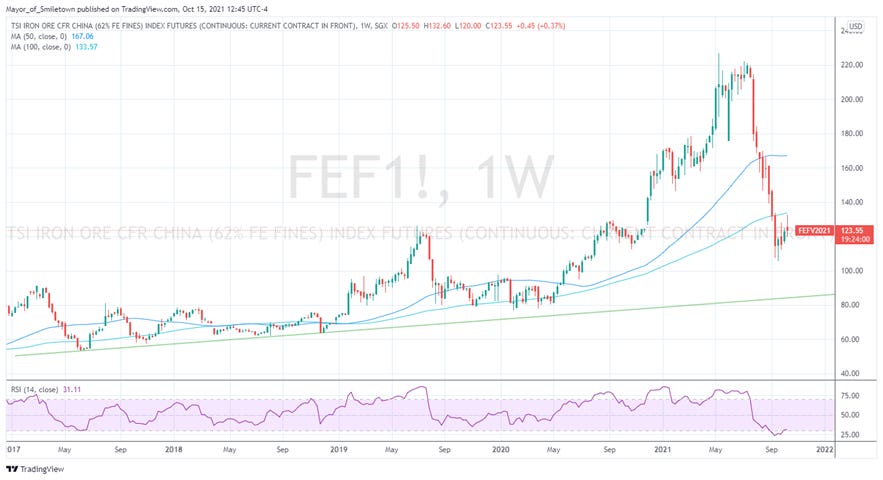
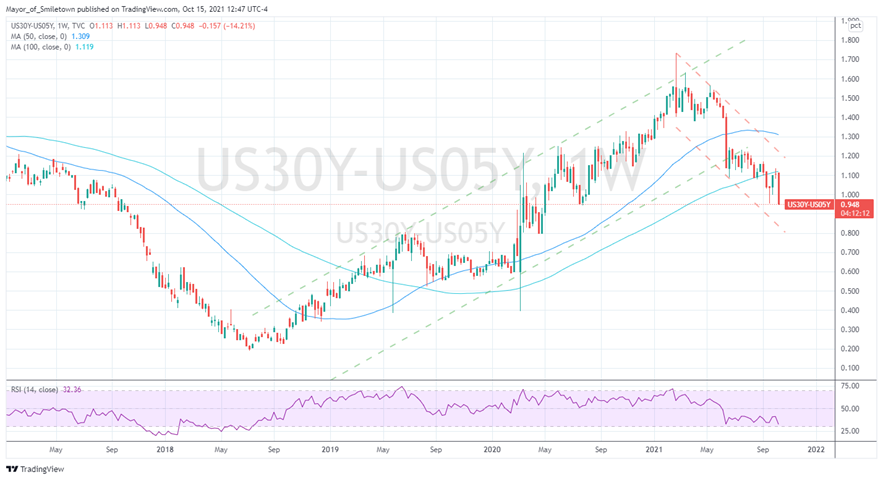
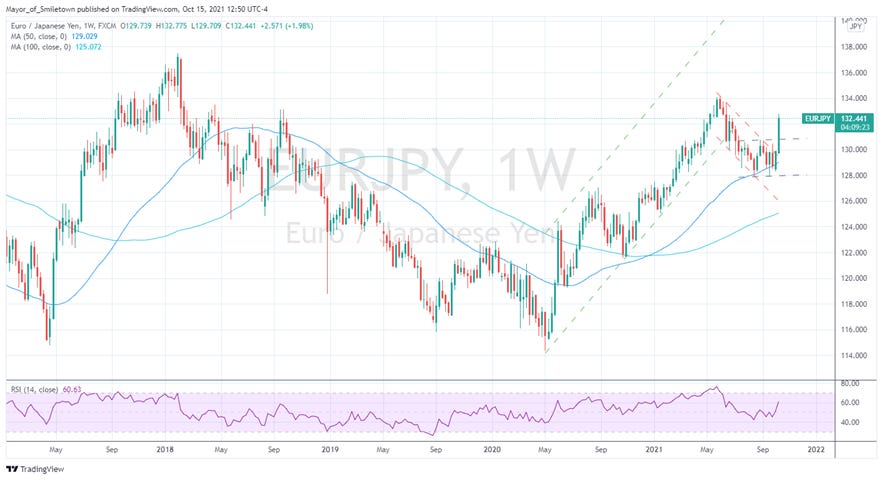
FOUR KEY MACRO HOUSE CHARTS:
Growth/Value Ratio: Growth is higher on the week, although slightly lower today as small-caps outperformed overnight and are giving back some of their morning gains currently

Chinese Iron Ore Future Price: Iron Ore futures are lower on the week, down again today despite a more positive tone in commodities more generally and industrial metals s (zinc, aluminum, and copper) specifically over the last few days due to worries over shortages
5yr-30yr Treasury Spread: The curve is flatter on the week, now at its flattest levels of the year as better Retail Sales data today continued expectations for quicker monetary policy tightening at the end of 2022 and throughout 2023
EUR/JPY FX Cross: The euro is higher on the week, as the Yen is in full breakdown mode, with the cross quickly approaching its highs of the year
HOUSE THEMES / ARTICLES
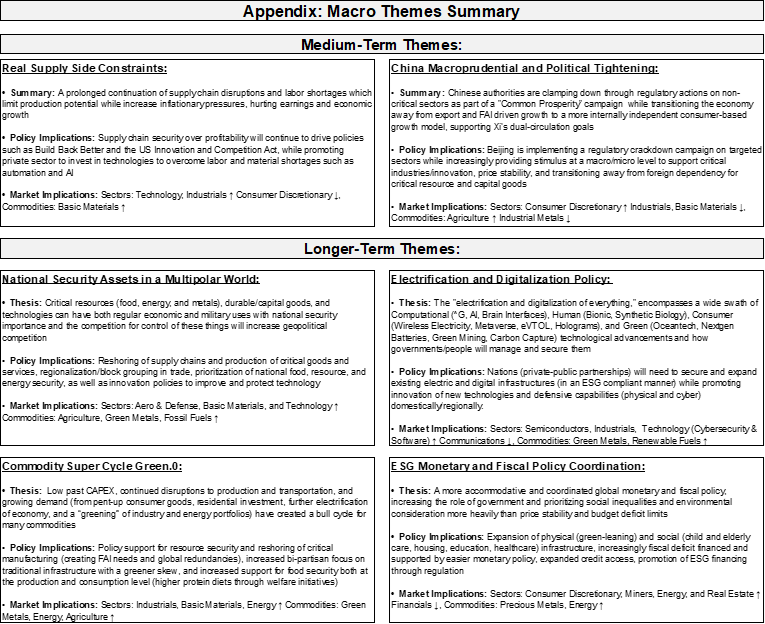
MEDIUM-TERM THEMES:
Real Supply Side Constraints:
Slowing Sales/Higher Prices: Average New Car Sells for Over $45,000 in September – Kelley Blue Book
In September, the average new car in America sold for $45,031. That’s the first time the average transaction price has crossed the $45,000 barrier and the sixth consecutive month of record-high prices. The mark comes despite slowing sales nationwide. Americans bought 7.3% fewer cars in September than in August, making September one of the slowest sales months in a decade.
Why it Matters:
How did we get to higher prices even with fewer sales? We bought more expensive types of vehicles. “The record-high prices in September are mostly a result of the mix of vehicles sold,” says Kayla Reynolds, an analyst for Cox Automotive. “Midsize SUV sales jumped in September compared to August, and full-size pickup share moved up as well. Sales of lower-priced compact and midsize cars, which had been commanding more share during the summer, faded in September.” The microchip shortages are forcing dealers to have fewer cars, needing to extract more profits from each sale due to low sales volume.

China Macroprudential and Political Tightening:
Still Strong: China's Sept exports surprisingly robust despite power crunch – Reuters
China's export growth unexpectedly accelerated in September, as solid global demand offset some of the pressures on factories from power shortages, supply bottlenecks, and a resurgence of domestic COVID-19 cases. Outbound shipments in September jumped 28.1% from a year earlier, up from a 25.6% gain in August. Analysts polled by Reuters had forecast growth would ease to 21%.
Why it Matters:
"Exports have continued to outperform and accelerate, even after omitting the impact of base effects," said Erin Xin, Greater China economist at HSBC, adding that earlier shipments of holiday consumer products in light of global supply chain disruptions may be behind the continued strength in exports. Other analysts said power rationing in September may not have affected exports yet, but could constrain production and inflate costs for Chinese manufacturers in the months to come.

!/2: China Developers Account for About Half of World’s Troubled Debt - Bloomberg
Of the $139 billion of U.S. dollar-denominated bonds trading at distressed prices, 46% were issued by companies in China’s real estate sector. Junk-rated dollar bonds from Chinese issuers have reached yields not seen in about a decade following months of weakness on concerns about rising debt-repayment pressure for developers and the sector’s increasing number of defaults.
Why it Matters:
The stress has hit scores of issuers tied to the Chinese property market, leaving a $64 billion pile of troubled debt that dwarfs other sectors. PBOC Head Sun Guofeng said recently they stand ready to use multiple tools, including lending facilities and open market operations, to smooth any volatility in liquidity conditions to meet financial institutions’ needs. This is on top of a meeting that the PBOC and banking regulators held regarding real estate financing at the end of September, where they guided major banks to maintain stable lending to the real estate sector.

LONGER-TERM THEMES:
Electrification and Digitalization Policy:
SCR: Coinbase Pitches Blueprint for Special Crypto Regulator – WSJ
The largest U.S. cryptocurrency exchange wants Congress to block the Securities and Exchange Commission from overseeing the crypto industry and instead create a special regulator for digital assets. Coinbase’s push comes amid a broader clash between the company and SEC Chairman Gensler, who has emerged in recent months as the biggest headache for cryptocurrency companies. He says many crypto exchanges are trading coins that don’t comply with investor-protection laws and has discouraged lawmakers from setting up a separate regulator.
Why it Matters:
Coinbase believes digital assets should have one designated regulator, as opposed to facing the threat of regulation from multiple agencies such as the SEC or Commodity Futures Trading Commission. It is unclear how Coinbase plans to generate support for a law that would regulate cryptocurrencies separately from other assets, as many congress members are skeptical of the industry. We believe their efforts will fail, and multi-tiered regulation at various levels is coming.

Commodity Super Cycle Green.0:
Switching: Gas Shortage Prompts Power Plants to Switch to Oil, Boosting Demand – WSJ
Soaring natural gas and coal prices are pressuring power-generation companies and manufacturers to switch to using oil. In its monthly market report, the IEA increased its global oil demand forecasts for this year and the next by 170,000 and 210,000 barrels a day, respectively, but added that the cumulative effect of the energy crisis could be as large as 500,000 barrels a day from September through next year’s first quarter.
Why it Matters:
The shortage of relatively low-carbon but expensive natural gas, which analysts say is two to three times more expensive than the equivalent amount of oil, is increasingly going to promote gas-to-oil switching. In its report, the IEA observed this trend already underway, citing provisional data showing “unseasonably high demand for fuel oil, crude and middle distillates for power plants” across China, Japan, Germany, France, and Brazil. The bottom line is that the greening of the world will have to take a back seat until we can secure power/heat for its citizens at a reasonable price.

Pass-Through: What Wild Natural Gas Prices Mean for Inflation – WSJ
European wholesale gas prices on spot markets have roughly tripled this year, but the average retail consumer gas price is up only about 9%. A UBS economist estimates the impact on the region’s inflation at about 0.4% points. By comparison, a more moderate 50% rise in oil prices added 0.6% points to inflation. However, increased reliance (due to greening initiatives) and structural changes to how companies secure supply (LT contracts vs. spot) are changing the weight natural gas will have on EZ CPI.
Why it Matters:
Inflationary pressures from energy price increases could be a whole lot worse next year, putting pressure on the ECB to tighten policy before they currently want. Energy account for a big chunk of consumer-price indexes: 9.5% in the eurozone and 6% in the U.K. For now, consumers are mostly insulated from the gas market’s gyrations, but the situation doesn’t seem sustainable given the pain utility supplier are feeling (and unable to pass on due to price caps).

VIEWS EXPRESSED IN "CONTENT" ON THIS WEBSITE OR POSTED IN SOCIAL MEDIA AND OTHER PLATFORMS (COLLECTIVELY, "CONTENT DISTRIBUTION OUTLETS") ARE MY OWN. THE POSTS ARE NOT DIRECTED TO ANY INVESTORS OR POTENTIAL INVESTORS, AND DO NOT CONSTITUTE AN OFFER TO SELL -- OR A SOLICITATION OF AN OFFER TO BUY -- ANY SECURITIES, AND MAY NOT BE USED OR RELIED UPON IN EVALUATING THE MERITS OF ANY INVESTMENT.
THE CONTENT SHOULD NOT BE CONSTRUED AS OR RELIED UPON IN ANY MANNER AS INVESTMENT, LEGAL, TAX, OR OTHER ADVICE. YOU SHOULD CONSULT YOUR OWN ADVISERS AS TO LEGAL, BUSINESS, TAX, AND OTHER RELATED MATTERS CONCERNING ANY INVESTMENT. ANY PROJECTIONS, ESTIMATES, FORECASTS, TARGETS, PROSPECTS AND/OR OPINIONS EXPRESSED IN THESE MATERIALS ARE SUBJECT TO CHANGE WITHOUT NOTICE AND MAY DIFFER OR BE CONTRARY TO OPINIONS EXPRESSED BY OTHERS. ANY CHARTS PROVIDED HERE ARE FOR INFORMATIONAL PURPOSES ONLY, AND SHOULD NOT BE RELIED UPON WHEN MAKING ANY INVESTMENT DECISION. CERTAIN INFORMATION CONTAINED IN HERE HAS BEEN OBTAINED FROM THIRD-PARTY SOURCES. WHILE TAKEN FROM SOURCES BELIEVED TO BE RELIABLE, I HAVE NOT INDEPENDENTLY VERIFIED SUCH INFORMATION AND MAKES NO REPRESENTATIONS ABOUT THE ENDURING ACCURACY OF THE INFORMATION OR ITS APPROPRIATENESS FOR A GIVEN SITUATION.