


Markets Rally on Short-Covering, Cooling Data, and a More Cautious Fed Tone, But Will It Last? – 3/31/2023
Color on Markets, Economy, Policy, and Geopolitics

Markets Rally on Short-Covering, Cooling Data, and a More Cautious Fed Tone, But Will It Last? – 3/31/2023
Overnight and Morning Recap / Market Wrap:
Price Action and Headlines:
Equities are higher, with today’s lower-than-expected PCE inflation readings and quarter-end buying helping continue a three-day short-covering rally, although financials are still underperforming
Treasuries are higher, with the curve flattening on the week as improving auctions throughout the week, weaker data, and continued uncertainty have seen rate volatility fall and new ranges begin to emerge
WTI is higher, with sharp declines in inventories, higher refinery input demand, and better growth out of China moving prices up almost $10 from last week’s recent lows to end the week above $75

Narrative Analysis:
The S&P is putting in its third green day in a row, rallying over 120 points after dipping below 4000 earlier in the week, supported today by weaker-than-expected inflationary and consumption/income data as well as real money buying into quarter end. Uncertainty over the future effects of the recent financial instability on the real economy remains high, helping keep a lid on Treasury yields, despite the more risk on tone to end the week. Regional Fed surveys showed a manufacturing sector still contracting and greater uncertainty among consumers, who further reduced their inflation expectations, as seen in today's University of Michigan survey and the Conference Board survey earlier in the week. Oil enjoyed a strong rebound after inventory data fell sharply, helping oversold conditions reverse. Industrial metals were more mixed, with copper little changed despite stronger PMIs out of China. The agg complex also rallied to end the week, with today’s USDA numbers helping soy the most. The dollar was weaker on the week, with many crossers stronger, moving the $DXY to 102.5.
Deeper Dive:
This week is ending on a more positive footing, with quarter-end real buying supporting equity and rate markets, helping lower implied volatility measures. However, as we highlighted last week, uncertainty is still high regarding the effects of the recent financial instability on real growth and hence future Fed policy decisions. A more systemic crisis looks to have been averted at the moment, as seen in falling Fed borrowing by the system this week. But this again opens up the path for a “higher for longer” Fed policy, something that front-end rates are not reflecting. Given what we are increasingly hearing from Fed officials post-March FOMC meeting, who continue to voice the opinion that more work is still needed, we believe that at least one further rate hike is coming. The main risk to the current rally is a backup in yields. Of course, seasonalities become more supportive for both equities and Treasuries in Q2. At the same time, we believe the economic data will weaken, increasingly reflecting the growing weight of the cumulative policy actions taken to date while greater uncertainty brought on by the recent banking crisis saga weighs on both consumer and business sentiment. In fact, this week’s PCE data did show a cooling in consumption in February following January's gains, while higher frequency spending data showed an immediate decline in activity following the SVB failure, although it is too early to tell how long-lasting that effect will be. The bottom line is that either the data starts cooling due to the “shock and awe” effects that the recent “banking crisis” should have on consumer/business confidence or through actual tighter credit conditions, all of which will flow through to lower consumption, investing, and hiring, or the rate-cut bets are going to have to change, because, right now, the two are not consistent. As a result, we see the risk-reward of adding additional risk here as poor. Further, we are moving up our stop levels on our current EM, China, and Nasdaq longs. Finally, given no new fundamental changes in our views from last week’s writing, this week's “Deeper Dive” will be much shorter than normal. We await next week's jobs report as the next catalyst to verify if the current rally is sustainable or whether Fed tightening fears will reemerge.

*As a reminder, the effective Fed funds will continue to rise, albeit at a slower pace, even as actual rate hikes end due to the effects of QT

*The rapid decline in M2 is increasingly becoming a headwind to liquidity and, as a result, makes risk assets more susceptible to a pullback

*Along with a shrinking money supply, a negative credit impulse will also weigh on real economic growth and financial assets…

*… but the current cycle saw much less accumulation of debt and leverage, with the pandemic fiscal and monetary policy response helping many households and firms to strengthen their balance sheets
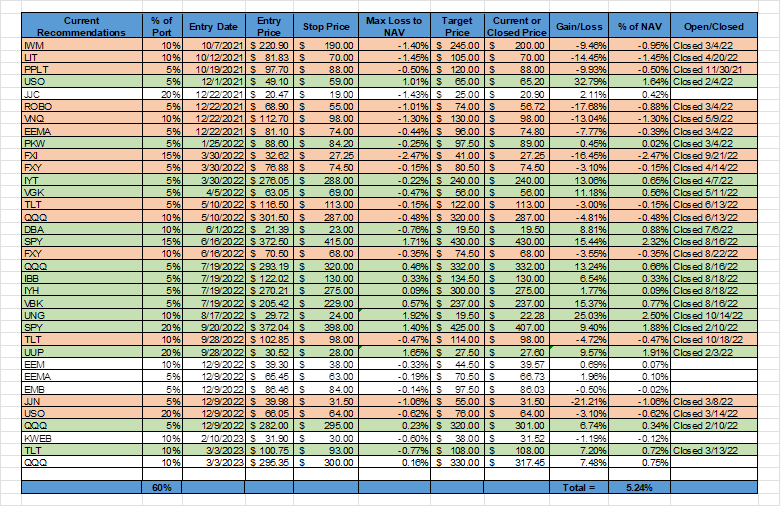
*The mock portfolio is up 5.24% since inception, with the rebound in EM and Chinese Tech equities and continued strength in the Nasdaq helping this week
We will not be writing for two weeks due to a well-needed family vacation.
Policy Talk:
Richmond Fed President Barkin spoke to the Virginia Council of CEOs, delivering a speech titled “The Need to Be Nimble.” In general, the speech highlighted the challenges for policymakers in reconciling the economy's strength versus the “potential” weakness coming from the banking system. Barkin acknowledged that the “broader implications” of recent events in the banking system are not yet clear. He noted that overall deposit flows out of the banking system have slowed, and banks have ample liquidity. However, a pullback in credit access would curtail spending, but again, it was too early to know if that would happen. Further, the effects of this and the lagged effects of cumulative rate moves could bring inflation down quickly, but Barkin noted there are still reasons why it could still take time. First, he highlighted that the effects of the pandemic were still being felt either through the fiscal multiplier or persistent supply-side impairments. Further, firms and workers are still trying to recoup lost ground by expanding margins and increasing real wages, respectively. Finally, inflation has certainly affected behavior, with businesses accepting input cost increases and finding greater inelasticity in demand for their products than they would have in the past. Barkin concluded by stating he was still heavily influenced by the experience of the 70s, leaning towards price stability concerns outweighing the recent financial instability episode in driving his future policy decisions. However, as the title noted, he believes policy will “need to be nimble.”
“It is possible that tightening credit conditions, along with the lagged effect of our rate moves, will bring inflation down relatively quickly. But I still think it could take time for inflation to return to target.”
“The broader implications of these events aren’t yet clear. There are still, to be sure, a few individual banks working through their own issues. But overall, deposit flows appear relatively stable. Banks have worked with intensity to ensure they have adequate liquidity.”
“But now pricing is back in play. Its impact is considerable as success increases flow straight to the bottom line. Businesses have found inelasticity they hadn’t had the courage to test for previously and are looking to find more.”

Boston Fed President Collins gave prepared remarks titled “Outlook, Monetary Policy, and Supporting a Vibrant Economy” at the NABE Economic Policy Conference. She began her remarks with the now standard inflation remains too high and there is more work to do, but immediately went into the safety and soundness of the U.S. banking system. She noted the Fed was monitoring financial conditions closely and stood ready to take further action “in keeping the banking system safe and sound.” Collins moved on to her views on monetary policy, recounting stories she heard from constituents in the New England area on how high inflation levels were hurting them. She believes the current inflation continues to represent an imbalance “ between demand and supply, resulting in pressures that fuel wage and price increases.” She believes there are initial signs that labor markets are loosening as a “catching up” process ends, leading her to believe more wage moderation is coming. However, she also stated a rise in unemployment was needed to lower wages further. She indicated that more time is generally needed to confirm whether inflation is truly trending back to target, especially in regard to core-service ex-shelter inflationary pressures. This is especially true given the heightened uncertainty recent banking turmoil has caused, something she noted “may partially offset the need for additional rate increases” and ultimately led her not to raise her Fed Funds SEPs projection. However, she concluded her policy-focused remarks by agreeing with the SEPs Fed funds projection, indicating she may be supportive of a further 25 bps hike, although she noted it was too soon to say what actions were needed at the next FOMC meeting.
“But special factors may also have limited the impact of policy actions thus far, relative to historical norms. On the household side, a sizable amount of “excess” savings accumulated during the pandemic remains – although this is less evident at the lower end of the income distribution, where some signs of stress are emerging. On the firm side, balance sheets also remain quite strong overall, limiting the need for external finance.”
But there are some emerging signs of slowing labor demand. In particular, a large portion of the recent strength in payrolls comes from sectors that were hit especially hard early in the pandemic – such as leisure and accommodation, and health care – and faced significant hiring challenges in the recovery. As this “catching up” process ends, I expect more moderation in hiring, which should help to relieve wage pressures.”

The San Francisco Fed released a research paper focused on the speed at which housing markets react to Fed policy titled “House Prices Respond Promptly to Monetary Policy Surprises.” They found that prices adjust to monetary policy changes over weeks rather than years, faster than previously thought. Research looking at changes in the price of homes for sale from 2000 to 2019 suggests house list prices fall within two weeks after the Federal Reserve announces an unexpected policy tightening. Further, they found house prices respond more strongly to unexpected changes in long-term interest rates than to short-term federal funds rate surprises. As expected, changes in mortgage rates following Fed announcements are vital in explaining this rapid house price reaction. They concluded by saying their findings were contrary to the established research that suggests house prices take years to adjust, and it is their hope these new findings will help policymakers better anticipate the effects of policy actions.

The New York Fed’s SCE Housing Survey, which provides information on consumers' housing-related experiences and expectations annually, showed that households expect home prices to increase over the coming twelve months at 2.6%, verse 7% last year, the slowest pace since the survey began in 2014. However, households expect prices to rise by 2.8% per year on average for the next five years. Expectations about the one-year-ahead change in the cost of rent were considerably higher at 8.2% but have declined from last year's series high of 11.5%. The probability of buying a home “conditional due to a move” over the next three years rose. Most households continue to view housing as a good financial investment, although the share characterizing housing as a good investment declined slightly from last year. Finally, households perceive that mortgage rates will rise further in the future. Households now expect mortgage rates to rise to 8.4% a year from now and 8.8% in three years' time.

*Households expect home prices to fall much faster than rents
The New York Fed’s Liberty Street Blog explored why there has been a persistent “participation gap” in the post-pandemic labor market in a posting titled “What Has Driven the Labor Force Participation Gap since February 2020?” The U.S. labor force participation rate is currently at 62.5%, 0.8 percentage points below its level in February 2020. This “participation gap” translates into 2.1 million workers missing from the labor force. In the post, researchers evaluate three potential drivers of why this is. First, population aging from the baby boomers reaching retirement age puts downward pressure on participation. Second, the share of individuals of retirement age that are actually retired has risen since the onset of the COVID-19 pandemic. Finally, long COVID and disability may induce more people to leave the labor force. They find that nearly all of the participation gap can be explained by population aging, which caused a significant rise in the number of retirements. Higher retirement rates compared to pre-COVID have had only a modest effect, while disability has virtually no effect. As a result, demographic trends, specifically population aging, exert a powerful influence on labor force participation. In other words, the participation gap largely disappears once one controls for population aging, indicating that participation has recovered a great deal since the large shock induced by the pandemic. Population aging will likely continue to exert strong downward pressure on participation in the future as more of the baby boomer generation enters retirement. This means there is a more structural force at work, leaving monetary policy less effective at combating the negative effects a lower population participation rate has on rising wages and inflation.
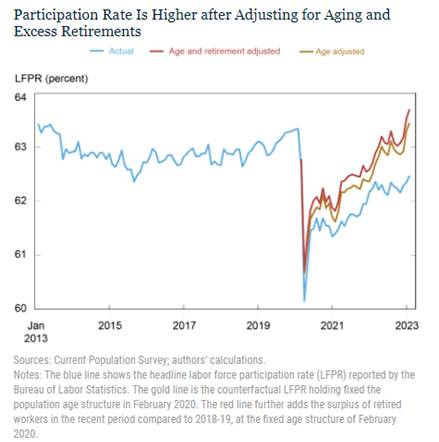
*The bulk of the drop in the participation rate is due to Baby Boomers retiring, a demographic structural force
Econ Data:
The headline personal consumption expenditure price index increased 0.3% in February, easing from a 0.6% rise in January and below market estimates of 0.5% MoM. This moves the annual rate to 5%. Core PCE prices rose by 0.3% MoM, following a downwardly revised 0.5% increase in the previous month and below market estimates of 0.4%. The annual core PCE rate is now 4.6%. The cost of goods rose by 0.2% MoM, slowing from a 0.6% rise in January, while services cost increased 0.3% MoM, also less than a 0.6% increase in the prior month. Food prices rose 0.2% MoM after a 0.4% increase in January, while energy prices declined by -0.4% MoM after surging 2% in the prior month.
Why it Matters: The PCE price data came in lower than expected, indicating the trend in inflation did not get worse in February. However, with the annualized three-month (4.9%) and six-month (4.5%), around the official annual rate of 4.6%, due to the pickup in December and January, it is too early to tell if February’s weaker gains will be the new norm. The so-called “supercore” of services prices, which excludes housing and energy, that Powell is highly focused on is not yet seeing any meaningful deceleration, with three-month (4.8%) and six-month (4.8%), also higher than the official annual rate of 4.6%. As a result, underlying inflation based on the Fed’s preferred indicators is moving sideways.

*Headline PCE is now at 5% YoY, but core services ex shelter remains sticky, indicating inflation is moving sideways for the Fed

*The pickup in inflation over the winter has moved three and six-month annualized averages higher despite February's weaker-than-expected reading
Personal spending rose by 0.2% in February, following an upwardly revised 2% increase in January and slightly missing market forecasts of a 0.3% MoM increase. Spending on goods rose by 0.2% MoM, with durable good spending falling by -0.2% MoM and nondurables rising by 0.3% MoM. Within goods, increases in gasoline and other energy goods, pharmaceuticals, and food and beverages were partly offset by a decrease in motor vehicles and parts, mainly due to weaker sales of new and used light trucks. Services spending rose by 0.3% in February, driven by increased spending on housing and health care but partly offset by decreased demand for food services and accommodations. Personal income rose by 0.3% in February, easing from a 0.6% gain in January and slightly beating market expectations of 0.2% MoM. The increase was led by rises in compensation, mainly from wages and salaries. However, nonfarm proprietors’ income was flat, and real disposable income increased by 0.2% MoM. The personal saving rate rose to 4.6% in February from 4.4% in January.
Why it Matters: The Fed can take some comfort that the strong level of growth in spending and, to a lesser extent, income growth cooled in February after January’s alarming readings. Increases in the savings rate also show a more cautious consumer. However, with real disposable income now clearly positive and higher by 7.7% on a three-month annualized basis, consumers are seeing their purchasing power improve rather drastically on aggregate, leading to the potential for better pricing power by firms in more inelastic areas. Finally, real PCE in the last two months is higher by a 5.5% annualized rate, which is historically a very robust rate given the strongest quarter in the last year and a half has been 3.1%. It is our view this is unlikely to continue as consumers increasingly worry about economic and financial stability despite falling inflationary pressures.

*Lower monthly gains for both personal income and spending bode well for demand and supply adjusting back to a more price-stable scenario
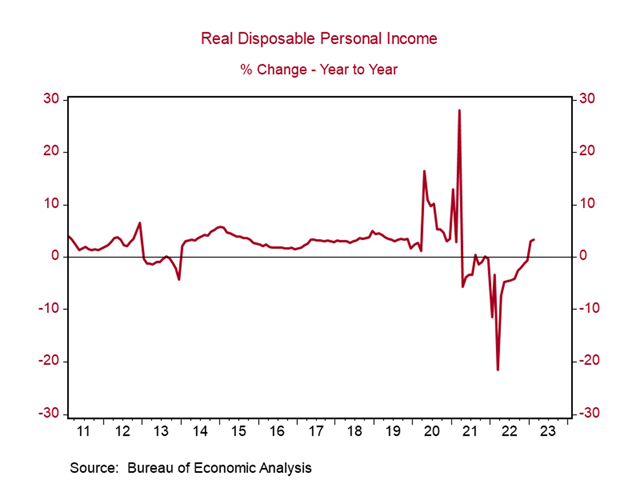
*Real disposable income continues to recover, moving further into positive territory, driven by wage increases and the strong labor market on aggregate

*There was a broad deceleration in inflation, spending, and income readings in February, and this was before the barrage of bank failure headlines hit
The S&P CoreLogic Case-Shiller 20-city Home Price Index declined by -0.6% in January of 2023, moving the annual increase to 2.5% year-on-year, the smallest increase since November of 2019, following a -0.9% MoM decrease in December, and in line with market forecasts. The National Home Price NSA Index decreased by -0.5% MoM, with a 3.8% annualized gain in January, down from 5.6% in the previous month. Nineteen out of the twenty cities registered a decline on an NSA basis, with the greatest weakness on the West Coast. Miami (13.8%), Tampa (10.5%), and Atlanta (8.4%) continue to report the highest year-over-year gains among the 20 cities in January. Elsewhere, the FHFA House Price Index rose by 0.2% in January, following a -0.1% decrease in December, and is now higher by 5.3% annually. Seasonally adjusted monthly changes throughout the nation ranged from -0.6% in the Pacific region to +2% in New England.
Why it Matters: Housing prices are down for a seventh consecutive month, with the National Composite now -5.1% below its peak in June 2022. January’s market weakness was broadly based, but the seasonally adjusted picture was a bit brighter, with only 15 cities declining verse 19 NSA. Further, January’s declines were less severe than those seen in December. "Mortgage financing and the prospect of economic weakness are likely to remain a headwind for housing prices for at least the next several months," according to Craig J. Lazzara, Managing Director at S&P DJI. “U.S. house prices changed slightly in January, continuing the trend of the last few months,” said Dr. Nataliya Polkovnichenko, Supervisory Economist, in FHFA’s Division of Research and Statistics. “Many of the January closings, on which this month’s HPI is constructed, reflect rate locks after mortgage rates declined from their peak in early November. Inventories of available homes for sale remained low.”

*Higher mortgage rates continue to drive prices lower despite still historically low levels of inventory
The international trade deficit was $91.6 billion in February, up $0.5 billion from $91.1 billion in January. Exports of goods for February were $167.8 billion, $6.7 billion less than January's exports due to declines in Industrial Supplies (-4.2%), Capital Goods (-2.5%), and Autos (-11.9%) on a seasonally adjusted basis. Imports of goods for February were $259.5 billion, $6.2 billion less than January imports due to declines in Consumer Goods (-5.6%), Autos (-7.1%), and Foods, Feed, and Beverage (-3.4%). Retail Inventories increased 0.8% MoM, and when excluding autos, increased 0.4% MoM in February, following a flat reading in January. Wholesale inventories increased 0.2% MoM, rebounding from an upwardly revised -0.5% decline in January. Wholesale inventories rose by 0.6% MoM for durables while nondurables decreased by -0.4% MoM. Compared to a year earlier, retail and wholesale inventories were higher by 10.8% and 12.2% on a seasonally adjusted rate, respectively.
Why it Matters: The advance goods trade report for February showed a modest widening in the deficit to $91.6 billion from $91.1b in January on declines in both exports and imports of goods. Wholesale and retail inventories were higher than expected, though there were downward revisions to both in January. Despite the overall decline in imports, businesses restocked goods steadily in February after a weaker January. Looking back to last quarter, a smaller trade deficit and the piling up of unsold goods at businesses were the contributors to the economy's 2.7% annualized growth rate in the fourth quarter. Currently, the report's new data leaves the likely detraction to Q1 GDP from trade at a -¼% to -½%-point drag and a -1%-point subtraction from inventories at this point. The current GDPNow estimate forecasts a 3.2% real GDP gain in Q1 with an estimate of a 1.4%-point drag from inventories but a 0.8%-point add from trade.

*Trade deficit came in higher than expected, with the services surplus on track for a decline this quarter

*Both exports and imports fell on the month after a notable pick up in both on a seasonally adjusted basis in January

*Inventories for both wholesalers and retailers increased due to rises in durable goods and autos
The Conference Board’s Consumer Confidence Index increased slightly in March to 104.2, up from 103.4 in February. The Present Situation Index decreased to 151.1 from 153 last month, while the Expectations Index ticked up to 73 from 70.4 in February. Inflation expectations over the next 12 months rose slightly to 6.3% from 6.2% in the prior month. Consumers’ current assessment of current business conditions and labor markets worsened in March. Consumers became slightly less pessimistic about short-term business conditions and labor market outlook, while income prospects were, on balance, less upbeat.
Why it Matters: Improved expectations drove the overall index higher despite a slight tick higher in respondents’ one-year inflation outlook, with improvements in expected future business conditions and labor markets as the primary driver. “The gain reflects an improved outlook for consumers under 55 years of age and for households earning $50,000 and over,” said Ataman Ozyildirim, Senior Director, Economics at The Conference Board. “While consumers feel a bit more confident about what’s ahead, they are slightly less optimistic about the current landscape. The share of consumers saying jobs are ‘plentiful’ fell, while the share of those saying jobs are ‘not so plentiful’ rose… Overall purchasing plans for appliances continued to soften while automobile purchases saw a slight increase.” Despite the Expectation Index increase, it has spent 12 of the last 13 months below 80, a level which often signals a recession within the next year. Finally, the cutoff date for the survey was March 20th, about ten days after the recent bank failures, which almost certainly weighed on the Present Situation Index.

*The Expectation Index is still trending lower despite this month's uptick, while the Present Situation Index has been more stable and range bound
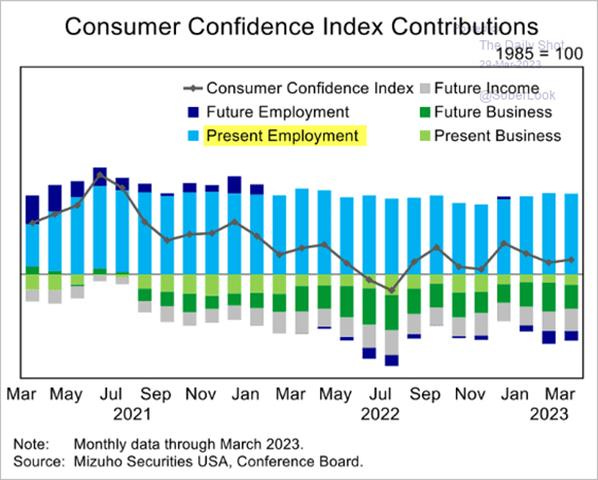
*Present employment continues to be the only positive contributor to the Conference Boards Consumer Confidence Index for the third month in a row

*Survey respondents have had a negative view of the stock market since January 2022
The Dallas Feds Texas Manufacturing Outlook Survey’s general business activity index fell to -15.7 in March from -13.5 in February. Activity measures were mixed, with Production (2.5 vs. -2.8) and Capacity Utilization (2.3 vs. -4.1) moving back into expansionary territory, while Shipments (-10.5 vs. -5) contracted further. Demand also weakened generally, as New Orders (-14.3 vs. -13.2) contracted further while the Growth Rate of Orders (-15.2 vs. -16.9) and Unfilled Orders (-9.4 vs. -13.3) improved but are still negative. Delivery Times (0.6 vs. 3.4) are nearly neutral, changing little, while Finished Good Inventories (6.6 vs. -3) expanded. Labor market measures suggest a resumption of hiring, with the Employment (10.4 vs. -1) index expanding sharply, although workweeks (2.6 vs. 4.8) shortened. Inflationary pressures have fallen when coupling decreases in the rate of growth in Wages and Benefits (30.5 vs. 32.7), Prices Paid (20.3 vs. 25.1), and Prices Received (7 vs. 15.8). The current overall Company Outlook (-13.3 vs. -17.5) index remained negative but rose while the outlook uncertainty index fell slightly, although both still indicate a negative highly uncertain outlook. The future outlook was more pessimistic, with clear expectations for lower activity and demand, which moved the general business activity reading further into contractionary territory. Employment intentions also fell, but labor was expected to cost more. However, both six-month ahead prices paid and received fell but remained well in expansionary territory. Finally, current and expected Capex readings rose notably, contrasting the declines in company outlook readings.
Why it Matters: March’s Texas Manufacturing survey brought a mixed bag that generally painted a still contracting demand picture while the future outlook broadly weakened. There was positive expansion in actual production while inflationary pressures continued to fall, albeit gradually. Comments tilted more positively this month but were highly varied, sometimes even within the same industry. Interestingly, counter to what other regional manufacturing surveys showed, and even future “company outlook” in this survey indicated, capex activity and intentions continue to expand. This may be due to the continued shortage of skilled workers driving firms to invest further in automation to expand capacity and afford higher labor costs for skilled workers.

*A move lower in the general business index due to falling demand but overall subindexes painted an improving manufacturing picture in March verse February in the Texas region

*Current sub-index readings moved more positively than broader declines in the six-month ahead ones, with price pressures falling and capex rising in both
The Richmond Fed’s Manufacturing Survey rose to -5 in March from -16 in February. Local Business Conditions (-12 vs. -13) remain well in negative territory. Activity measures improved with Shipments (2 vs. -15) moving back into expansionary territory, while Capacity Utilization (-10 vs.-17) improved but remained contractionary. Demand measures also improved notably, although they still indicate falling levels, with New Orders (-11 vs. -24) and Backlog of Orders (-14 vs. -24) improving. In a sign that supply chains continued to ease, Vendor Lead Time (-18 vs. -17) despite Finished Goods (15 vs. 13) and Raw Material Inventories (21 vs. 21) continuing to expand. Employment measures eased, with Employees (-5 vs. -7) and Availability of Skills Needed (-3 vs. -2) continuing to contract while Wages (27 vs. 31) cooled slightly. Current inflationary pressures eased for Prices Paid (6.24 vs. 7.9) while Prices Received (5.59 vs. 5.54) were little changed. Finally, regarding current investment measures, Capex (2 vs. -3) and Equipment & Software Spending (-1 vs. -1) remained near unchanged while Service Expenditures (-10 vs. -12) contracted further. Expectations for shipments rose notably while demand measures fell. Future hiring intentions fell, although wages were expected to remain elevated, likely due to a more neutral view on the availability of skilled labor. Capex expectations mirrored changes in current ones. Finally, expected future price pressures moved closer to neutral.
Why it Matters: Although still in contractionary territory, the Fifth District’s manufacturing activity broadly improved in March. The sub-indexes that did decline also indicated reduced supply chain and labor shortage problems, as seen in falling lead times and the availability of skills needed. Price decreases were mild, mirroring the stickiness seen in other regional Fed reports. However, unlike other surveys, inventory expansion is significantly higher. Firms remained pessimistic about local business conditions, and the index for future local business conditions edged down slightly, but future expected business activity rose sharply.

*Price measures (both current and future) continue to trend lower, however, wages remain more sticky despite hiring intentions contracting

*Current sub-indexes broadly improved while expectations were more mixed
Technicals, Positioning, and Charts:
The Russell is outperforming the Nasdaq and S&P with Small-Cap, Growth, and Value factors, as well as Consumer Discretionary, Communication, and Real Estate sectors all outperforming on the day. This week saw all sectors higher, with a relief rally in sectors/factors that had been underperforming the last two weeks outside financials. Energy, Consumer Discretionary, and Materials were the best-performing sectors, while Value, Yield, and Small-Caps were the outperformers on the week. Mid-cap Value was the best-performing size, with large-cap growth the worst.

@KoyfinCharts
S&P optionality strike levels have the Zero-Gamma Level at 4017 while the Call Wall is 4065 and Put Wall is 3800. Implied volatility compression continues, with the SPX now above its Call Wall as of this writing. This means calls need to build at higher strikes to unlock more upside in markets. To this point, today’s SPY Call Wall rolling higher was more of a function of puts being added to the 405 strike level verse calls building. Therefore, we are in a bit of a “wait and see” as to how these positions shift. Further, the IV compression removes the “vanna tailwind” from markets. Through this lens, the market needs to have some “real buyers” to carry markets higher, verse the post-bank-crisis options short covering (negative gamma/vanna hedging).

@spotgamma
S&P technical levels have support at 4105, then 4085, with resistance at 4135 (major), then 4160. This rally started with a failed breakdown setup, with a flush below 4000 on Tuesday ending up being a bear trap, then its recovery that signaled a further move higher was probable. We have now rallied 120 points in the span of three days with every dip bought. This is not sustainable, but the Bulls have control as long as the S&P stays inside the current yellow rising channel with lower support at 4005-10 now and channel resistance is 4160.

@AdamMancini4
Treasuries are higher, with the 10yr yield at 3.50%, lower by 5 bps on the session, while the 5s30s curve is steeper by 1 bps on the session, moving to 6 bps.

Four Key Macro House Charts:
Growth/Value Ratio: Growth is higher on the day but lower on the week, with Mid-Cap Value the best-performing size/factor on the week.

Chinese Iron Ore Future Price: Iron Ore futures are lower on the day and the week.

5yr-30yr Treasury Spread: The curve is steeper on the day but flatter on the week.

EUR/JPY FX Cross: The Euro was stronger on the day and the week.

Other Charts:

Mega-cap stocks have been driving the recent rally over the last week and reversed their underperformance over the last year. However, a JPM desk note warned that “while it feels like we are in full-blown melt-up mode... volumes remain lackluster... mega-cap tech positioning does look extreme with the group’s [long/short] ratio at the 99th %-ile.”
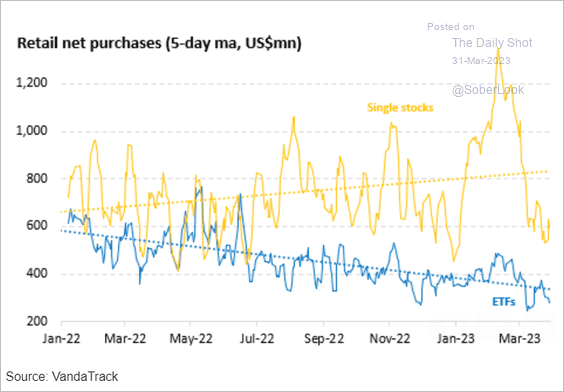
The outperfromance of a few mega-caps is supported by data showing retail investors more focused on single-name purchases/positions verse overall market exposure through ETFs.
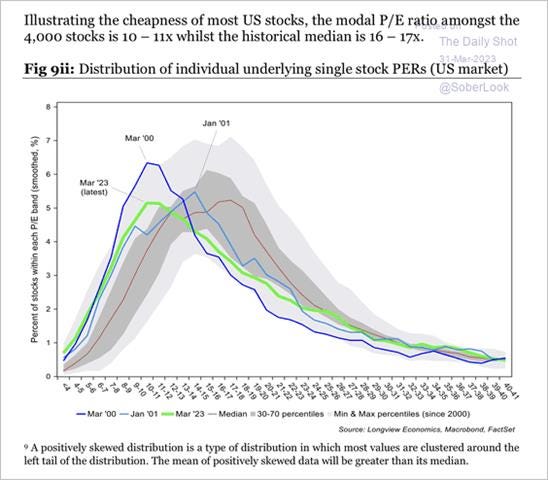
The surge in mega-caps, which have higher P/E multiples, is again leading the overall index to look expensive. However, there are still a large number of single-name stocks that are historically cheap, according to @Lvieweconomics

Expected forward earnings remain above trailing EPS for the S&P, indicating that the recent bounce higher (which may now fade) has EPS growth expectations still slightly positive for the coming year.

Hedge funds are increasing their gross exposure while keeping their net exposure lower and more range bound, indicating a better balance of longs and shorts.
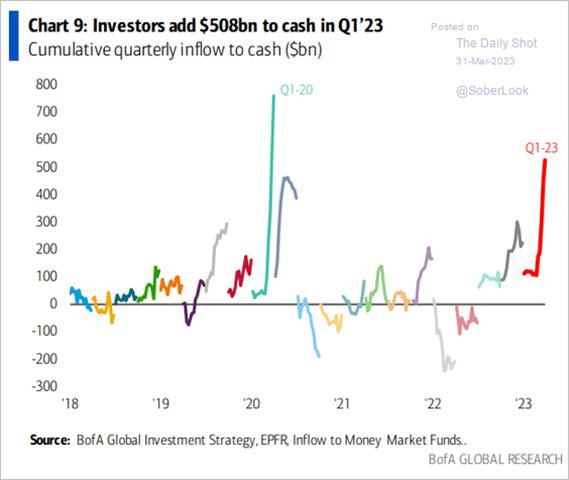
The Fed can take comfort that higher rates are indeed moving money out of banks, where it can be lent and have a multiplier effect on economic growth. Thanks to a $200b surge in the past two weeks, money market mutual fund assets have hit an all-time high of $5.1 trillion, up about $600 billion in the last year and double the level seen five years ago.

The movement of money out of the banking system and from a tighter Fed policy has M2 shrinking at a rate not seen before in modern times, significantly complicating how one should look at liquidity, credit, and risk assets.

Despite the recent uptick in housing activity, falling mortgage applications indicate that a weaker trend should continue.

Postings on private job boards (such as Indeed, as seen above) indicate a falling demand for workers while a falling sample size, leading to quality issues, as well as reports of sticky postings that are not intended to be filled, bringing into question the accuracy of the official JOLTs data.

Transportation costs continue to fall, with declines in trucking rates catching up to decreases seen in shippers. In conjunction with falling delivery times reported in business surveys indicate a return to normal for supply chains continues.
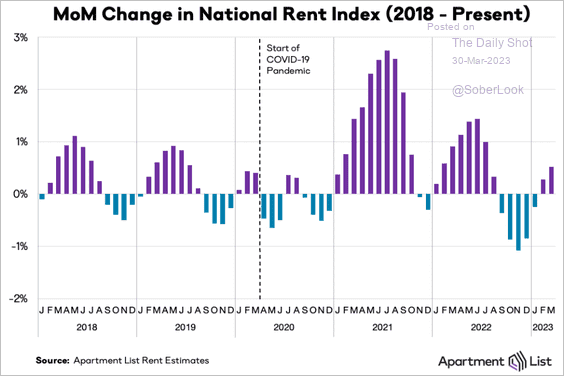
Changes in rental prices look to be reentering a more seasonally normal cycle, as seen prior to the pandemic.
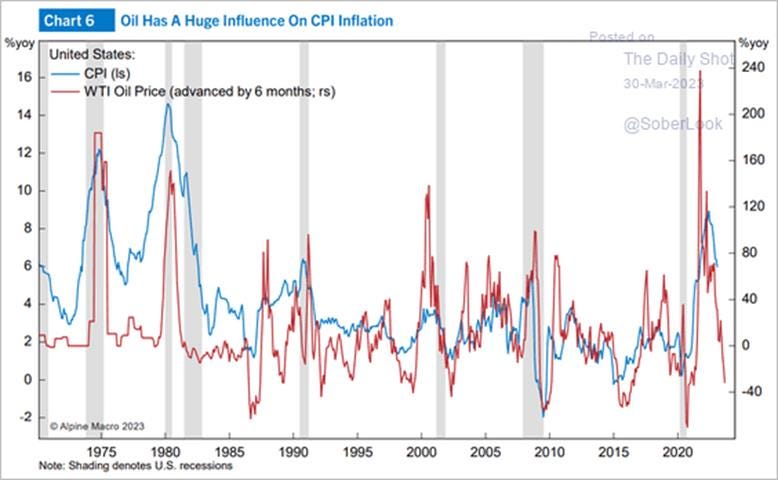
Recent drops in oil bode well for future inflationary pressures falling
Articles by Macro Themes:
Medium-term Themes:
China’s Post-Pandemic Life:
Changing Growth Drivers?: A gauge of activity in China’s services sector reached its highest level in over a decade in March, a sign that Chinese consumers are heading back to stores and restaurants. China’s official PMI for nonmanufacturing sectors rose in March to 58.2 from 56.3 in February, its highest level since May 2011. Though the initial signs are promising, economists are unsure how durable the recovery in Chinese consumption will be. Chinese households are emerging from the pandemic with bulging savings but weak housing and job markets as well as sluggish growth in incomes, raising doubts about whether consumption can take over from exports and government and real-estate investments as the engines of Chinese growth. - China’s Consumers Extend Economic Rebound From Pandemic - WSJ

Stable: China’s economic recovery was mixed in March, with business confidence and the housing market improving but falling car sales and weak global demand were the main drags, leading Bloomberg’s latest aggregate index of eight early indicators to remain at the stable reading of 4. Economists expect consumer spending to underpin China’s growth this year, which is expected to now reach 5.3% this year. Growth in the second quarter is forecast to accelerate to 7.3%, which would be the fastest pace in two years largely due to a lower base of comparison from last year. - China’s Economic Recovery Faces Risks From Global Trade Slump - Bloomberg

Domestic > Exports: Chinese Vice Premier Ding Xuexiang used a speech to global executives to reassure participants that China would continue to open up as international companies increasingly complain of market-access challenges. He also read a message from President Xi, in which the Chinese leader pledged to continue to pursue a mutually beneficial opening up. Beijing is increasingly focused on domestic consumption to counter other risk factors, including falling exports, a still-weak property market, and shrinking government resources for large fiscal stimulus. However, increased emphasis on “wolf warrior” nationalism has hurt demand for foreign products. “A year ago, 60% of companies said China was the top or a top 3 investment priority and this year that’s fallen to 45%,” Michael Hart, president of AmCham in China, said earlier this month. “China is falling in the rankings as a place for people to invest globally. It’s still important but not one of the top destinations for the majority of companies.” - China Vice Premier Pledges Nation Will Continue to Open Up - Bloomberg

Longer-term Themes:
Cyber Life and Digital Rights:
Guardrails: The Biden administration signed an executive order that prohibits U.S. government agencies from using commercial spyware that presents a national security risk to the United States. The new guidelines set long-awaited guardrails on how the U.S. government uses commercial spyware and respond to the growing use of powerful surveillance tools, which allow buyers to remotely hack into electronic devices and extract information without the target’s knowledge. The executive order was issued ahead of the second Summit for Democracy, where the White House plans to release guidance for global partners on limiting spyware. The technology has become increasingly popular with authoritarian regimes targeting dissidents, journalists, and political adversaries, with numerous public accounts of abuse around the globe. - Executive order sets up guardrails for US use of commercial spyware - CyberScoop

Splinternet: Russia’s disconnection from the online services of the West has been abrupt and complete,with Russian authorities blocking Facebook and Twitter. Many other companies have voluntarily withdrawn from the Russian market, including Apple, Microsoft, TikTok, Netflix, and others. But all these are just services that use the internet rather than the technologies or agreements that power it. The moves have raised fears of a “splinternet,” in which instead of the single global internet we have today, we have several national or regional networks that don’t speak to one another and perhaps even operate using incompatible technologies. The article goes on to examine how this splintering could occur. - Russia is risking the creation of a “splinternet”—and it could be irreversible – MIT Review

Energy’s Midlife Crisis:
Less Capital: Clean-energy startups have privately raised about $8 billion in equity in the first quarter, a drop of nearly 40% from a year earlier and the lowest figure since 2020, PitchBook data show. Activity in the market for sustainability-linked bonds and loans has also softened in line with the overall market amid rising interest rates, dragging down the amount of debt larger companies are raising for climate projects to the lowest level in more than two years, according to Dealogic. Companies in the oil-and-gas industry and other sectors are also raising much less cash than they did in recent years. The weakness in climate funding marks a shift from last year, when the sector largely avoided the worst of the market slowdown and got a boost from the Inflation Reduction Act, which promises to inject hundreds of billions of dollars into the industry over the next decade. The recent failure of Silicon Valley Bank, which had some 1,500 clients in the industry, and pressure on other lenders are hurting the sector. - Climate Funding Gets Squeezed by Volatile Markets – WSJ

Ways to Go: More than a quarter of Sweden’s electricity has come from wind power for two consecutive months, but a new report has warned that the country's emissions could still rise. In 2022, Sweden installed 2.4 GW of wind power capacity, and only Germany installed more, at around 2.5 GW (a gigawatt can power around 750K homes). In 2021, the EU deployed 34 GW of wind and solar capacity combined. Sweden has ambitious clean energy targets and is aiming to reach 100% renewable electricity production by 2040, and by 2045 the country aims to have no net greenhouse emissions. The overall EU bloc will need a total of 76 GW of renewable energy by 2026 to reach its targets, but at the predicted rates of deployment, only four out of 27 EU countries (Finland, Croatia, Lithuania, and Sweden) will achieve sufficiently high annual increases in wind capacity increases to meet this goal.- Sweden rebuked for 'backwards' climate policy despite wind power record - EuroNews

Food: Security, Innovations, and Climate Change Implications:
Subsidizing Agg Exports: Argentina is rolling out a temporary subsidized exchange rate for wine and other agriculture products in an elaborate bid to boost exports and foreign reserves as the worst drought in a century exacerbates a looming recession. The policy will give producers a more beneficial exchange rate for 90 days when they sell their products abroad instead of the official peso value that the government has kept artificially high. Starting in April, the government will also allow a 30-day exchange rate for soy exports. “The drought hit us very hard,” Economy Minister Massa told reporters in Washington Thursday after meeting with officials at the International Monetary Fund. The temporary exchange rates aim to “strengthen the central bank’s reserves in the second quarter and continue the stabilization path that Argentina needs to do.” - Argentina Debuts ‘Dollar Malbec’ to Aid Exports Amid Drought - Bloomberg

Sick Cows: Livestock producers around the country are confronting this new and unfamiliar disease, Theileria, which is in the same family as malaria, and is being transmitted mainly through the Asian long-horned tick, an invasive species. Researchers still don’t know how theileria will unfold in the U.S., even as it quickly spreads west across the country. If states can’t get the disease under control, then nationwide production losses from sick cows could significantly damage both individual operations and the entire industry. Theileria can cause cows to abort their fetuses. It can also cause anemia so severe that a cow will die. In Australia, where the disease has been spreading since 2012 and now affects a quarter of the cattle, theileria costs the beef industry an estimated $19.6 million a year in reduced milk and meat yields, according to a 2021 paper. - A new tick-borne disease is killing cattle in the US – MIT Review

Authoritarianism in Trouble?:
Starting to Unravel?: So far, there are no signs the economic difficulties are bad enough to pose a short-term threat to Russia’s ability to wage war. The country’s biggest exports, gas and oil, have lost major customers. Government finances are strained. The ruble is down over 20% since November against the dollar. The labor force has shrunk as young people are sent to the front or flee the country over fears of being drafted. Uncertainty has curbed business investment. “Russia’s economy is entering a long-term regression,” predicted Alexandra Prokopenko, a former Russian Central Bank official who left the country shortly after the invasion. However, the government can still borrow domestically, and the sovereign-wealth fund still has $147 billion, even after shrinking by $28 billion since before the invasion. Russia has found ways to sell its oil to China and India. China has stepped in to provide many parts Russia used to get from the West. In conclusion, it is still unclear how bad things may get or whether the Russian economy can power through all these changes, but the Russian economy is becoming more dependent on the state. - Russia’s Economy Is Starting to Come Undone – WSJ

Name-Calling Disqualification: Rahul Gandhi, India’s most prominent opposition politician, has been disqualified from parliament, sparking criticism that the snap decision represented “a new low” for the country’s constitutional democracy a year ahead of a national election. Gandhi was barred from serving as an MP after he was convicted and sentenced to prison for two years by a court in Prime Minister Narendra Modi’s home state of Gujarat over remarks he made in 2019 asking why people with the surname Modi were “thieves.” Opposition politicians and civil society activists expressed outrage at the ban, saying that both the defamation case and Gandhi’s barring from parliament reflected poorly on India’s democracy.- Rahul Gandhi barred from India’s parliament following conviction over Modi remarks - FT

Asian Tigers 2.0:
Slowing due to Uncertainty: Vietnam’s growth decelerated more than expected this quarter as exports and construction shrank, reflecting the risks that global and domestic challenges pose to one of the region’s fastest-growing economies. Vietnam’s trade-reliant economy is taking a hit as tighter monetary policies globally dampen demand for goods, mirroring a trend of sagging sales in Asian export powerhouses, including South Korea and Taiwan, while China’s reopening lift has yet to be fully felt. At the same time, the impact of government crackdowns reverberating in Vietnam, including the property sector, is already showing strains in an economy that rarely posts below 5% growth pre-pandemic. “But it isn’t just manufacturing. We have weakness in construction due to the fallout of the real estate tightening,” Trinh Nguyen, an economist at Natixis SA said, “moreover, a lack of clarity on policy direction is also taking a toll on domestic investment.” - Vietnam’s GDP Growth Cools Amid Slump in Property, Exports - Bloomberg

Cold Places (Deep Sea, Artic, and Space Colonization):
Star Wars: The Pentagon is gearing up for a future conflict in space as China and Russia deploy missiles and lasers that can take out satellites and disrupt military and civilian communications. The White House this month proposed a $30 billion annual budget for the U.S. Space Force, almost $4 billion more than last year and a more significant jump than for other services, including the Air Force and the Navy. For the first time, the spending request also includes plans for simulators and other equipment to train Guardians, as Space Force members are known, for potential battle. The 16,000 Guardians are charged with running rocket launches, satellites and ground-based communication and sensor equipment. - Pentagon Prepares for Space Warfare as Potential Threats From China, Russia Grow - WSJ

Other Articles of Interest:
Too Concentrated: In the midst of SVB’s collapse, many people are starting to question the wisdom of granting so much leeway to VC leaders, the de facto gatekeepers of innovation in our country. According to the 2022 Pitchbook Venture Monitor report, about 5% of VC managers control 50% of the capital in the U.S. A staggering 75% of these power brokers attended an Ivy League school, Caltech, MIT, or Stanford, and 91% are male. Moreover, these “Big VC” firms tend to cluster geographically, with over 90% based in either Silicon Valley, New York, Boston, or Los Angeles, creating regional imbalances that have historically excluded promising entrepreneurs and investors from outside of these tech hubs. To achieve such a skewed concentration of capital amongst a handful of industry actors, Big VC firms have persuaded themselves, their peers, and the public at large of their superior investment acumen. But the lack of basic financial literacy these VC leaders seemed to demonstrate during the SVB crisis underscores serious concerns about their competence. The article's author argues that unlocking our society's true innovative potential requires diluting the influence of Big VC. Achieving this goal requires breaking up the market power of Big VC funds and investors and reimagining innovation investing from the ground up. - How Venture Capital Can Avoid the Next Silicon Valley Bank Fiasco – Wired

VIEWS EXPRESSED IN "CONTENT" ON THIS WEBSITE OR POSTED IN SOCIAL MEDIA AND OTHER PLATFORMS (COLLECTIVELY, "CONTENT DISTRIBUTION OUTLETS") ARE MY OWN. THE POSTS ARE NOT DIRECTED TO ANY INVESTORS OR POTENTIAL INVESTORS, AND DO NOT CONSTITUTE AN OFFER TO SELL -- OR A SOLICITATION OF AN OFFER TO BUY -- ANY SECURITIES, AND MAY NOT BE USED OR RELIED UPON IN EVALUATING THE MERITS OF ANY INVESTMENT.
THE CONTENT SHOULD NOT BE CONSTRUED AS OR RELIED UPON IN ANY MANNER AS INVESTMENT, LEGAL, TAX, OR OTHER ADVICE. YOU SHOULD CONSULT YOUR OWN ADVISERS AS TO LEGAL, BUSINESS, TAX, AND OTHER RELATED MATTERS CONCERNING ANY INVESTMENT. ANY PROJECTIONS, ESTIMATES, FORECASTS, TARGETS, PROSPECTS AND/OR OPINIONS EXPRESSED IN THESE MATERIALS ARE SUBJECT TO CHANGE WITHOUT NOTICE AND MAY DIFFER OR BE CONTRARY TO OPINIONS EXPRESSED BY OTHERS. ANY CHARTS PROVIDED HERE ARE FOR INFORMATIONAL PURPOSES ONLY, AND SHOULD NOT BE RELIED UPON WHEN MAKING ANY INVESTMENT DECISION. CERTAIN INFORMATION CONTAINED IN HERE HAS BEEN OBTAINED FROM THIRD-PARTY SOURCES. WHILE TAKEN FROM SOURCES BELIEVED TO BE RELIABLE, I HAVE NOT INDEPENDENTLY VERIFIED SUCH INFORMATION AND MAKES NO REPRESENTATIONS ABOUT THE ENDURING ACCURACY OF THE INFORMATION