

Markets Continue to be Hit by Fiscal and Geopolitical Macro Doom Loop - Midday Macro – 10/27/2023
Markets Continue to be Hit by Fiscal and Geopolitical Macro Doom Loop - Midday Macro – 10/27/2023
Color on Markets, Economy, Policy, and Geopolitics

Markets Continue to be Hit by Fiscal and Geopolitical Macro Doom Loop
Midday Macro – 10/27/2023
Market’s Weekly Narrative and Headlines:
Greater geopolitical uncertainty and higher yields continue to weigh on risk appetite this week. Both the S&P and Nasdaq are now squarely below their 200-DMAs with optionality and technicals increasingly negative, while the Russell looks to be in full meltdown mode, down almost -20% from summer highs. This is in light of a notably better-than-expected third-quarter GDP report yesterday and an earning season that continues to be mixed for sure but not overtly raising red flags. The problem is good is bad as stronger growth means a “higher for longer” Fed stance and, hence, tighter financial conditions for longer than originally thought. The focus has also shifted from fundamentals, both in the economy and with earnings, to the U.S. fiscal situation and the growing uncertainty around the global world order following the terrorist attack on Israel. As a result, today’s price action of lower equities, Treasuries moving sideways, and oil and gold rising encapsulated well the current risk sentiment with headline risk rising and cross-asset vol increasing. Further, safe haven assets are now under greater inspection, causing traditional risk-off price action/correlations to fail, adding to the complexity of being an asset manager. However, all is not lost. The ECB successfully convinced markets this week it may be done as it weighs the current slowdown in growth as sufficient to realign supply and demand into a non-inflationary accelerating level. Further, China looks to be taking its economic problems more seriously, increasing stimulus measures, something that will have external growth implications. Oil is lower on the week, despite heightened contagion fears that Iran will be more directly involved in any hot conflict, as inventories rose and gas demand remains weaker. Copper did take notice of Beijing’s more growth-friendly rhetoric and is pushing on its recent downtrend resistance. The agg complex was also firmer. The dollar was higher on the week, with the $DXY around 106.5, thanks to a more dovish ECB and still a risk-off tone that favors dollar safety. Next week’s treasury funding announcement, November FOMC meeting, and jobs report will determine whether or not a relief rally is possible, along with no notable escalation in the Middle East.

Deeper Dive:
The macro narrative has become notably more negative since we last wrote two weeks ago. Higher geopolitical uncertainty is bringing into further question debt sustainability and where inflation is heading. As a result, and despite strong third-quarter readings, future growth looks increasingly structurally impaired. Higher rates, due to a greater term premium brought on by increased government debt supply and a need for the Fed to stay “higher for longer” given the persistence of inflation, mean markets are repricing a future with longer-term tighter financial conditions and lower growth potential. Initially reflected in higher Treasury yields, this new worrying future outlook has quickly and increasingly moved across other asset classes, with equity indexes moving below 200- DMA and near new bear market territory surprisingly quickly. We are now effectively in a negative fiscal feedback loop, with higher yields increasing worries over future interest payment costs and the need to issue more paper to pay those costs, increasing supply further. At the same time, tighter financial conditions are weighing on growth, reducing expected future income and capital gains tax receipts. The persistence of inflation, due to a combination of higher energy costs, which have increased consumer expectations, and the general stickiness in core-services ex-shelter, only complicates the matter further, as it forces the Fed’s hand and limits monetary policy’s optionality. When putting this all in the context of the constantly played “great game,” it is very possible that these fiscal and inflationary problems, which always existed and were worsened by the pandemic, are currently being further stressed purposely by China, Russia, Iran, and others in a hope to challenge the western world order more meaningfully. A fiscally constrained U.S. economy with limited monetary policy options does make for a weaker opponent, all else equal. And that’s to say nothing of the current political divide in our country (which foreign agents helped create.) Given recent events in the Middle East and the potential for a new front in Asia to open up at any moment, markets need to recalibrate what this means to longer-term growth and financial asset valuations.

*Higher rates are notably increasing the cost of servicing the existing deficit

*A resilient consumer and, to a lesser extent, rising energy prices over the summer have resulted in a firming in inflation readings

*Implied vol has risen alongside rate vol, but it is still very low historically
With the gloom and doom analysis out of the way and despite wars, Congressional chaos, persistent inflation, and volatile markets, the U.S. economy still looks to be in pretty good shape. The third quarter GDP report beat expectations, with real final sales to private domestic purchasers notably above trend for a third quarter. This, of course, presents the Fed with a conundrum, as although there will be no rate hike next week at the November FOMC meeting, December and January are still very much in play, as indicated by Powell last week during a hawkish press conference following what was supposed to be a dovish speech. As a result, despite the new focus on tighter financial conditions by Fed officials, the “higher for longer” terminal rate duration level is still a mystery, increasingly uncertain as leading economic indicators and expected lagged effects of tighter cumulative policy to date indicate a period of below trend growth should be here, finally aligning supply and demand of goods, services, and labor to a non-inflation accelerating level. However, as has been the case for some time, the economy's resilience and interest rate insensitivity continue to surprise policymakers and markets alike. As a result, there should continue to be greater levels of volatility in markets. Volatility catalysts should continue to move beyond new economic data as geopolitics and deficit-related developments take precedence as they determine future Treasury supply and the appropriate term premium across the curve. Next week’s Treasury refunding announcement may prove a bigger determinant of where long-end yields go than the October jobs report or future inflation readings. In summary, we imagine yields are near their peak level, but until a credibly fundamental development occurs, allowing a clear topping technical formation to be seen, high rate vol will continue to pull up cross-asset volatility generally, weighing on any tactical risk on rallies and ultimately capping both global and the U.S.’s global growth potential.
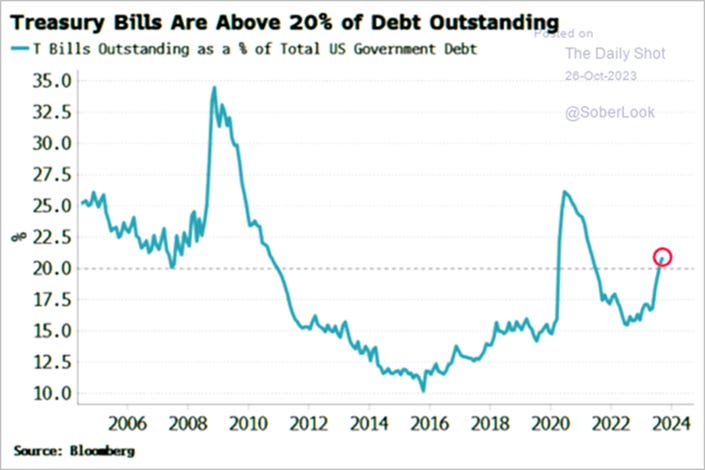
*Markets need to see a greater supply of front-end paper to reset the yields and the curve into a more stable range

*A December or January hike would likely mean the Fed stays at terminal well into the second half of 2024

*Tighter financial conditions (and general credit conditions) will increasingly bite at real growth

*Given the general uncertainties and structural weights to growth, equities are expensive
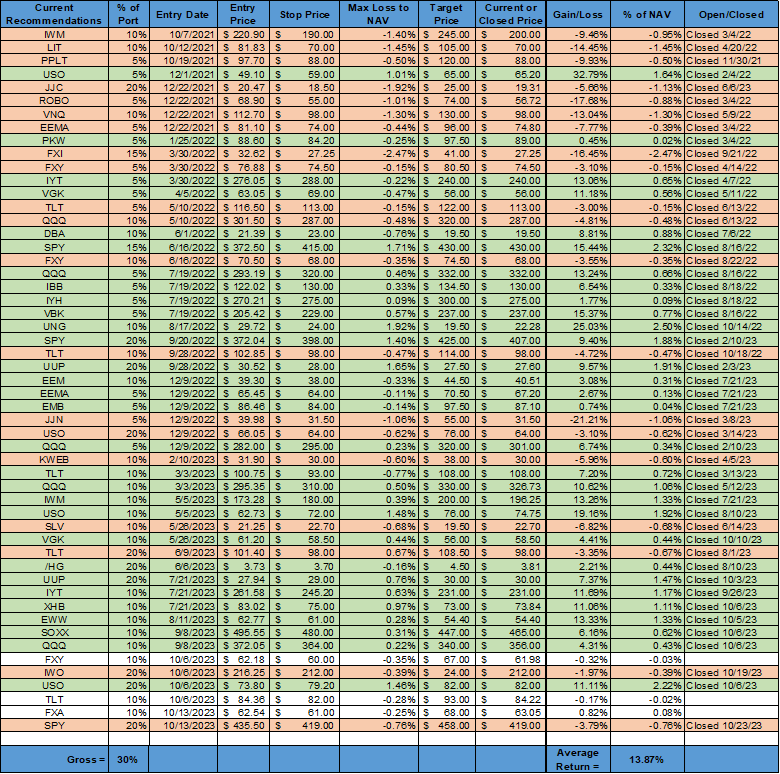
*Things changed quickly in the last few weeks, and as a result, our hope for a year-end rally evaporated. Luckily, we had tight stops on or rather large U.S. equity long positions. We also clipped our oil long target price and closed that position for an 11% gain. We maintain our long AUD and JPY positions for the stated reasons, as well as our belief that long-end treasury yields are near their peak, and we should see a relief rally there based on next week’s refunding announcement, weaker jobs data, and a pause from the Fed.

*Stay tactical and keep tight stops, as things will be bumpy for a few quarters!
As always, thank you for reading, and please share our newsletter. Feel free to reach out with any questions or comments. - Michael Ball, CFA, FRM
Policy Talk:
The Federal Reserves’s October Beige Book “indicated little to no change in economic activity” in most districts since last month. The near-term outlook for the economy was stable to slightly weaker, with views regarding holiday sales being mixed. Respondents noted consumer spending was mixed, with increased differentiation in offerings increasingly affecting demand. Travel remained stable, with some slowing in domestic tourism in certain districts offset by increased international and business travel. There was also a normalization of the balance of spending, with declines in spending on “experiences” offset by increases in spending on goods. However, respondents varied in the level of reported spending at general retailers and on bigger ticket items like autos.

*The overall Beige Book Activity Index reading weakened in the October report
After stabilizing in recent months, conditions in the broad finance sector weakened slightly, with banks reporting a decrease in loan demand across most districts. Consumer credit was cited as “stable or healthy.” However, delinquency rates slightly increased. Commercial real estate markets improved slightly, with vacancy rates falling for the first time since the pandemic began, helping office rents remain flat. Residential real estate conditions continued to have tight supply, with bidding wars reported in some districts. Manufacturing activity was mixed, but contacts across many districts had a more optimistic outlook. Service contacts in consumer-facing retail businesses reported mixed conditions, and more business-orientated sectors reported a softening in activity.

*The number of mentions of labor, parts, capacity and other types of “shortages” in the Federal Reserve’s latest Beige Book report has stabilized close to pre-Covid levels.
Labor markets remained tight, with most districts reporting “slight to moderate” increases in employment, although firms were hiring less urgently. Several districts reported better turnover conditions for firms, while workers had less bargaining power/incentives. As a result, wage growth remained “modest to moderate,” and firms reported renegotiating packages to mitigate higher labor costs. There was no change in price pressures, which continued to increase at a modest pace. Input cost increases have “slowed or stabilized” for manufacturers but continued to rise for the service sector. Sales prices increased at a slower pace than input costs as consumers have grown more sensitive to prices. Firms expect price increases to continue to slow moving forward.
“There were multiple reports of firms modifying their compensation packages to mitigate higher labor costs, including allowing remote work in lieu of higher wages, reducing sign-on bonuses or other wage enhancements, shifting compensation to more performance-based models, and passing on a greater share of healthcare and other benefits costs to employees.” - Summary
“Spending on apparel, interior furnishings, home electronics, and appliances grew at a steady clip after a period of stagnation. Meanwhile, spending on restaurants, travel, and entertainment slowed after a strong summer, in part reflecting seasonal shifts. Auto dealers in upstate New York reported moderate increases in sales, particularly for new cars, as inventory continued to improve. Still, sales remain well below pre-pandemic levels as limited inventory has constrained sales despite solid demand.” – New York District
“Firms reported that wage inflation continued to slowly abate but remained at a modest pace overall – near prepandemic levels. Contacts noted some ongoing wage pressure, particularly from skilled trade workers, as the supply of qualified candidates remained scarce. A contact reported a recent increase in retirements among trade workers but said many returned almost immediately as part-time employees.” – Philadelphia District
Price pressures eased recently, continuing a trend that began at the start of the year. Contacts noted that they were not raising prices because of increased competition and greater resistance from customers to price increases. One retailer said, “We will try our best to hold the line as consumers seem to be tightening their belts.” Several manufacturing and construction contacts noted steadying or reducing prices in accordance with input costs. However, other manufacturers and freight contacts were able to raise prices during contract renewals. -Cleveland District
Business spending increased slightly in late August and September. Capital expenditures moved up a bit, with several contacts reporting purchases of new equipment, software, or expansions of existing facilities. That said, several contacts noted that high interest rates were leading them to delay some acquisitions. In addition, one manufacturing contact said that increases in operating, labor, and materials costs were holding back equipment investment. – Chicago District

*“Rates” were mentioned significantly more in October’s report, while inflation also stabilized after recent declines
U.S. Economic Data:
Real Gross Domestic Product rose by an annualized 4.9% in the third quarter of 2023, the most since Q4 2021, and above market forecasts of 4.3% following a 2.1% expansion in Q2, advanced estimates showed. This increased year-over-year GDP growth to 2.9% from 2.4%. Nominal GDP rose 8.5% YoY as the GDP deflator increased to 3.5%, higher than forecasted. The bulk of the increase came from a 4% rise in consumer spending, driven by broad-based growth across goods (4.8%) and services (3.6%). On the other hand, non-residential investment contracted for the first time in two years, falling by -0.1% (vs. 7.4%) due to a -3.8% fall in equipment spending (vs. 7.7%) and a slowdown in spending on structures to 1.6% (vs. 16.1%) while intellectual property products increased by 2.6% (vs. 2.7%). Residential investment rose for the first time in nearly two years, increasing by 3.9% (vs. -2.2%). Government spending increased by 4.6% (vs. 3.3%), supported by a rise in both defense (8% vs. 2.3%) and nondefense (3.9% vs. -0.4%). Exports significantly increased, rising by 6.2% and rebounding from a -9.3% fall in Q2, while imports also rebounded notably (5.7% vs -7.6%). However, the trade balance subtracted slightly less than 0.1% from real GDP. Private inventories added 1.32 percentage points to the overall GDP number, the first gain in three quarters. The closely watched real private domestic final sales rose by 3.5% in the third quarter. Personal consumption expenditures (PCE) price index increased 2.9%, compared with an increase of 2.5% in the second quarter. However, excluding food and energy prices, the PCE price index declined to 2.4% from 3.7% in Q2. Disposable personal income rose by 1.9%, following a 6.1% increase in the second quarter, but real disposable income decreased by -1%, compared to a 3.5% increase last quarter. Personal saving decreased to $776.9 billion in the third quarter, compared with $1.04 trillion in the second, moving the personal saving rate (personal saving as a percentage of disposable personal income) to 3.8%, compared with 5.2% in the second quarter.
Key Takeaways: The stronger-than-expected increase in real GDP in the third quarter was due to accelerations in consumer spending, private inventory investment, and federal government spending. Residential fixed investment finally made a positive contribution as well. Consumer spending was broad-based, with notable increases in durable and non-durable goods as well as services. Inventory investment picked up sharply (adding 1.3% points to growth), somewhat a payback for previous quarters of negative and flat contributions. Outside the official GDP numbers, it is worth highlighting the decline in real disposable income growth and the drop in personal savings. The Fed may view this as a sign that the strong rate of consumption in Q3 is not sustainable. The Fed will also take some comfort that core PCE fell to 2.4%, although core service sector inflation ex-shelter rose slightly to 3.6%.

*A large increase in consumer spending and a notable payback in inventories helped Q3 GDP beat expectations.

*Real final sales continue to run well above trend, indicating a broad growth pulse in the last three quarters

*Although business investment was flat on the month, after a strong Q2, inventory accumulation compensated for it
The personal consumption expenditure price index increased by 0.4% in September, the same as in August, and above market forecasts of a 0.3% MoM increase. This monthly change moved the annual rate to 3.4%, the same as in the prior month. Core PCE increased by 0.3% MoM, following a 0.1% increase in August, above forecasts of a 0.2% MoM increase. The annual Core PCE rate is now 3.7%, slightly declining from 3.8% in the prior month. Prices for goods increased by 0.2% MoM (vs. 0.8% MoM in August), while service costs rose by 0.5% MoM (vs. 0.2% MoM). Food edged up 0.3% (vs. 0.2% MoM), and energy increased by 1.7% MoM (6.1% MoM).
Key Takeaways: PCE inflation is the Fed's preferred inflation metric, and September figures showed that inflationary pressures continue to slowly moderate, although the recent uptick in monthly readings is now problematic for the Fed, which ideally needs to see flat to 0.2% MoM increases at most to credibly say they are making progress in getting inflation back to target in a timely manner. However, the core measures and the so-called super core measure, shorter-term three and six-month annualized averages, continue to be below the official annual rate, indicating there is some progress. Of course, these inflation measures continue to run too hot for the Fed's comfort, as they often tell us, and while the FOMC is almost certainly on hold next week, the inflation data will keep policymakers leaning toward possibly doing more unless inflation moderates more notably in the coming months, as a December hike is unlikely, but January is still certainly in play.

*The recent firming in monthly inflation readings has kept the annual rate at current levels as comparables are no longer as favorable.

*Three and Six-month annualized rates have picked up at the headline level due to rises in energy over the last few months, as well as stickier core service readings

*Housing is slowly turning over, which will help the overall core fall faster, but it is unlikely core goods will continue to be such a drag
Personal income increased by 0.3% in September, following a 0.4% rise in August and slightly below the market consensus of a 0.4% MoM increase. Compensation for employees increased by 0.4% MoM (vs 0.5% in August), driven by increases in wages and salaries (0.4% MoM vs. 0.5% MoM) and other associated costs (0.4%, the same rate as in August). Personal income receipts from assets recorded a 0.5% MoM advance (vs. 0.5%), while personal interest income rose a strong 1% MoM, while personal dividend income increased by a lesser 0.1% MoM. Rental income for individuals and proprietors' income rose by 0.7% MoM and 0.4% MoM, respectively. However, personal current transfer receipts fell by 0.1% MoM, a fourth consecutive period of decline. Personal spending rose by 0.7% in September, following a 0.4% increase in August and beating the market consensus of a 0.5% MoM increase. Both spending on services and goods rose notably, increasing by 0.8% MoM and 0.7% MoM, respectively.
Key Takeaways: Real personal consumer expenditures ended the third quarter on a strong note due to strong spending on durable goods, particularly vehicles, and no deterioration in service demand. Real disposable income, however, fell for the fourth straight month as tax payments rebounded, and the savings rate dropped to the lowest since December 2022. As covered in our analysis of the GDP report, the sustainability of this strong PCE pulse in Q3 is questionable as it looks to be partially fueled by drawing down savings or taking on additional borrowing. Notably, interest income rose by 1% MoM, supporting overall income, which is likely to see declines in other compensation categories moving forward. Is there a point where higher rates actually support spending among stronger balance sheet consumers?

*Personal Consumption has been outpacing personal income in recent months

*When adjusting for inflation, real disposable income and spending are below trend
New orders for manufactured durable goods rose by 4.7% in September, following a decline of -0.1% in August and beating market expectations of a 1.7% MoM increase. Orders for transportation equipment significantly increased, rising by 12.7% MoM (vs -1.1% in August), driven by increased demand for civilian aircraft (92.5% vs -17.5%). Orders also rose for computers and electronic products (1.0% vs. 1.2%), machinery (0.9% vs. 0.5%), electrical equipment, appliances, and components (0.9% vs. 1.1%), and fabricated metal products (0.9% vs. 0.6%). Orders for non-defense capital goods, excluding aircraft, a proxy for capex, increased by 0.6% in September, following a 1.1% increase in August, surpassing market expectations of a 0.1% MoM rise. Total Shipments decreased by -0.3% MoM after rising 0.5% in August, while Unfilled Orders rose by 1.4% MoM after increasing by 0.3% in the prior month. Inventories rose for a second consecutive month, increasing by 0.1% MoM, following a 0.2% increase in August, helped by a 0.3% increase in the machinery sector.
Key Takeaways: This marked the most substantial monthly increase in durable goods orders since July 2020, primarily driven by strong demand for transportation equipment, although gains were broad-based. New orders have climbed in five of the last seven months, with the data series showing resiliency in what PMI reports are still showing as a softer U.S. manufacturing backdrop.

*Transportation equipment once again played an outsized role in affecting the direction of the overall index, while core capital goods rose again by a more stable amount

*There was a broader increase, again, with only new orders for primary metals lower
Sales of new single-family houses increased by 12.3% to a seasonally adjusted annualized rate of 759K in September, up from a revised 676 thousand in August and surpassing the market expectations of 680K. Sales were higher by 33.9% from September 2022. Year-to-date sales are up 4.5% compared to the same period in 2022. Sales were higher in all regions: the South (14.6% to 456K), the West (7.5% to 187K), the Midwest (4.7% to 67K); and the Northeast (22.5% to 49K). The median price of a new house sold in September was $418.8K, while the average sales price was $503.9K, as opposed to $477.7K and $530.1K a year ago. At the end of September, 435 thousand houses remained for sale, equivalent to 6.9 months of supply at the current sales rate.
Key Takeaways: New home sales reached their highest level since February 2022, as limited supplies of existing homes continue to keep demand for new housing strong. Despite the tighter supply of existing homes, the high level of homes under construction continues to keep the “months of supply” of new homes elevated versus previous years. This continual pipeline of supply and higher mortgage rates have seen the median home price move sideways for the year. Elsewhere, pending home sales grew by 1.1% in September, according to the National Association of Realtors. "Despite the slight gain, pending contracts remain at historically low levels due to the highest mortgage rates in 20 years," said Lawrence Yun, NAR chief economist. "Furthermore, inventory remains tight, which hinders sales but keeps home prices elevated."

*New home sales continue to benefit from low levels of existing homes despite higher mortgage rates

*Median prices are lower on an annual basis due to strong increases last year

*A historically high construction pipeline continues to create new supply every month
The Richmond Fed’s Fifth District Survey of Manufacturing Activity Index decreased to 3 in October from 5 in September. Activity measures improved with Shipments (9 vs. 7 in Sept) rising and Vendor Lead Time (-12 vs. -26) contracting by less, although Capacity Utilization (-6 vs. 6) moved into contractionary territory. New Orders (-4 vs. 3) moved back into a mild contractionary reading, while the Backlog of Orders (-17 vs. -7) decreased further into negative territory. Local Business Conditions (-9 vs. 0) dropped to a negative reading from neutral in September. Employment measures improved on aggregate, with the Number of Employees (7 vs. 7) expanding at an unchanged rate, while Wages (29 vs. 23) rose further and Availability of Skills Needed (-1 vs. -10) moved to a more neutral level. Price trends improved, with Prices Paid (3.02 vs. 4.06) and Prices Received (2.07 vs. 3.06) notably lower. Investment readings were more mixed. Inventory readings for both Finished Goods (23 vs. 14) and Raw Materials (23 vs. 15) jumped higher. Capital Expenditure (4 vs. 1) plans remained near neutral, while Service Expenditures ( -13 vs. -17) contracted further. Measures of future expectations were more downbeat on activity and demand, while price pressures increased, as seen in rises in measures for expected wages and prices paid.
Key Takeaways: Although the headline index reading was little changed, there was a broad cooling in current and future sub-index readings. It is positive that price trends dropped as much as they did, although expectations are for future margin pressures to worsen. Of course, contracting capacity utilization and backlog of orders likely indicate a more price-sensitive backdrop. Further, expansionary employment and capex readings continue to indicate some level of confidence in the future, which is also supported by still positive expectations for new orders and shipments. Overall, the general reading for October indicated a slowing current situation but a still positive outlook.

*The overall index was little changed, with demand measures cooling, inventory readings higher, labor readings little changed, and current price readings dropping notably

*After firming in September, price readings fell in aggregate in October

*Overall, the majority of subindex readings were weaker, especially when excluding inventory readings, which jumped notably
The Richmond Fed’s Fifth District Survey of Service Sector Activity Index declined to -11 in October from 4 in September. Revenues (-11 vs. 4) contracted notably, while Demand (0 vs. 10) fell to a neutral reading. Local Business Conditions (-15 vs. -5) worsened. Capital Expenditures (0 vs. 3) fell to neutral. However, Equipment and Software Spending (10 vs. 5) and Service Expenditures (3 vs. -3) expanded. Employment readings continued to expand, with the Number of Employees (15 vs. 3) and Wages (30 vs. 21) both expanding notably, while the Availability of Skills Needed (2 vs. 4) moved closer to neutral. Price Trends were mixed, with Prices Paid (6.86 vs. 5.72) rising and Prices Received (4.46 vs. 4.87) falling. Expectation readings were broadly negative, falling sharply for revenue, demand, and local business conditions. Future investment plans remained positive, and labor readings expanded by a greater amount. Finally, expected price trends were similar to current readings.
Key Takeaways: October’s report showed a significant contraction in both the overall index and a broad range of underlying sub-indexes, especially regarding expectations, which had notably expansionary readings in September and August. However, current investment and employment readings did expand, somewhat offsetting the weakness seen elsewhere. As seen in other regional surveys, firms reported increased prices paid while weaker prices received, indicating worsening margins. The rapid deterioration in local business conditions in both current and expected readings over the last three months indicates that the service sector, more generally, may be beginning to face increasing headwinds.

*Both current and expected local business conditions readings contracted sharply after a mid-summer recovery from recent lows

*Current readings for revenue also contracted sharply after recovering in the first half of this year

*Investment measures expanded on aggregate, despite capex readings moving to neutral, while employment readings expanded further

*Both current and expectation readings followed a similar theme
The Kansas City Fed’s Manufacturing Index was unchanged at -8 in October. Demand and activity measures were mixed and remained contractionary, with Production (-8 vs. -13) and Shipments (-11 vs. -15) improving slightly, while New Orders (-22 vs. -14) contracted further notably. New Exports (-8) remained unchanged, and the Backlog of Orders (-13 vs. -24) jumped higher but remained contractionary. Labor readings weakened as the Number of Employees (-4 vs. 2) contracted, while the Average Workweek (0) was unchanged at a neutral reading. Inventory readings moved to neutral while Delivery Times (-4 vs. -1) shortened. Price measures fell, with Prices Received (0 vs. 2) now unchanged and Prices Paid (-2 vs. 7) now contracting. Six months ahead, expectations improved for activity measures while demand measures fell. Employment readings were mixed, with headcount growth slowing but workweek expectations rising. Price expectations fell, with readings for prices paid and received near post-pandemic lows. Finally, capex intentions moved closer to neutral after expanding in the summer months.
Key Takeaways: As expected with the negative composite level reading, most of the month-over-month indexes were in the negative range. The production, shipments, and order backlog indexes all experienced moderate contractionary readings, while new orders registered a significant decrease. Durable goods manufacturing saw a more substantial decline compared to non-durable goods, but both sectors contracted at the same rate as the previous month.

*The overall index remains in contractionary territory for the majority of this year, with a notable drop in New Orders offsetting improvements in activity measures

*Current and Expected price measures are now effectively neutral, showing little to no inflationary pressure in the district

*There was a mix of contractions and expansions in sub-index readings, leaving the headline index unchanged on the month
The Chicago Fed National Activity Index rose to +0.02 in September, up from a downwardly revised -0.22 in August. Production-related indicators contributed +0.03 to the CFNAI, up from -0.10 in August, boosted by a rebound in manufacturing activity. In addition, the contribution of the sales, orders, and inventories category moved up to -0.01 in September from -0.06 a month earlier, and employment-related indicators contributed +0.01, up slightly from a neutral contribution in August. The contribution of the personal consumption and housing category to the CFNAI has also moved up to -0.01 from -0.06.
Key Takeaways: The slightly positive reading suggests the US economy expanded at its historical trend (average) rate of growth, supported by an improvement in all four subcategories. The Fed wants to see a below-trend period of growth, and as seen in this week’s Q3 GDP report and the summarization of 85 individual economic indicators captured in the CFNAI, which show an at-trend growth rate, we are clearly not there.

Technicals, Positioning, and Charts:
The Nasdaq outperformed the S&P and Russell on the day. Factor and sector performance on the week favored a more defensive tilt, with lower volatility outperforming and only the Utilities sector higher on the week. Energy was the worst-performing sector, closely followed by Communications, although the majority of sectors were lower by over -1% on the week, given the wide breadth of the current selloff. Large-Cap Value was the best-performing size/style.

@Koyfin
S&P optionality strike levels have the Zero-Gamma Level at 4303 while the Call Wall is 4800 and the Put Wall is 4100.

@spotgamma
S&P technical levels have support at 4125, then 4090, with resistance at 4150, then 4170.

@AdamMancini4
Treasuries are little changed on the day, with the 10yr yield at 4.85%, while the 5s30s curve is steeper by 5bp on the session, sitting at 25 bps.

Four Key Macro House Charts:

Growth/Value Ratio: Value is flat on the day and but higher on the week, with Large-Cap Value the best-performing size/factor on the week.
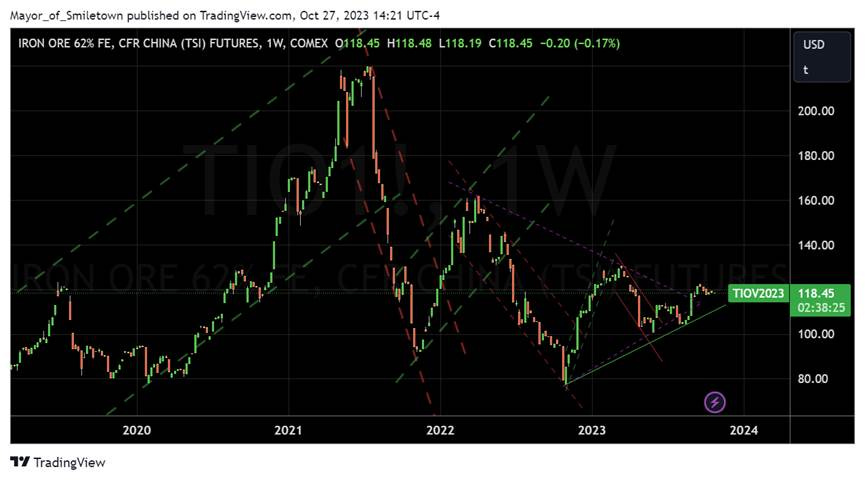
Chinese Iron Ore Future Price: Iron Ore futures are higher on the day and the week.

5yr-30yr Treasury Spread: The curve is steeper on the week.

EUR/JPY FX Cross: The Yen is stronger on the day and the week.
Other Charts:

After a strong seasonal adherence this year, the S&P has now broken down notably from its historical seasonal pattern.

Breadth remains very weak as the average S&P 500 stock is down -21% from its one-year high. - @DavidCoxRJ

“Hedge funds are aggressively shorting single stocks, and have been for much of 2023. Not so much index and ETF products, though. Is it a stock pickers market on the short side as well? These fund managers seem to think so.” - @Mayhem4Markets

Bond yields still likely have more pushing to the upside to go if inflation expectations lead the way

Spending is holding up, according to credit card data from BofA. “Consumer spending has been fairly flat over the last two months. Seasonally adjusted total card spending rose 0.2% month-over-month, reversing the 0.2% decline in August. Total card spending per household was up 0.7% year-over-year in September, compared to 0.4% in August, according to Bank of America internal data.”

May not be a pick up in new initial claims but continuing claims are growing

Student loan payments have been "coming in recently at an annualized rate of around $75bn, an increase of $65bn or so relative to the run rate before the end of forbearance was announced." - JPMorgan

“About 53,000 U.S. home-purchase agreements were canceled in September, which equals 16.3% of homes that went under contract that month … highest percentage since October 2022 per” - @Redfin

"The US remains the most important short-term marginal oil producer." - Goldman Sachs

Inflation is likely to continue lower in the EZ based on leading PMI readings.

However, more sticky PMI output price readings in U.S. PMI are now resulting in inflation readings moving sideways.

One reason that the EZ may be having greater success in slowing its economy and inflation is the notable drop in the money supply and greater reliance on lending versus secondary markets for credit extension there.

Economic data in China has been beating expectations since mid-summer as expectations remain very low.

Air pollution is on the rise again in China, also indicating that economic activity is increasing.

30.7% of global central banks have initiated interest rate cuts, and there is a growing trend of central banks pausing rate hikes. - @MacroMicroMe
Articles by Macro Themes:
Medium-term Themes:
China’s Post-Pandemic Life:
More Targeted and Forceful: Chinese President Xi stepped up support for the Chinese economy, with Beijing issuing additional sovereign debt, raising the budget deficit ratio, and Xi even making an unprecedented visit to the central bank. Beijing approved a plan to raise the fiscal deficit ratio for 2023 to about 3.8% of GDP from the 3% set in March which the government has generally considered a limit for the nation. The plan includes issuing additional sovereign debt worth 1 trillion yuan ($137 billion) in the fourth quarter to support disaster relief and construction. The budget revision underlined concerns among top leadership about the economy’s outlook for next year and the government’s increased focus on shoring up the economy and financial markets. Xi also made his first known visit to the nation’s central bank since he became Chinese president a decade ago. There were a number of other notable developments, including aiding local government debt burdens and calls to “rally” the private sector. - Xi Steps Up Economic Aid With New Debt Issuance, PBOC Visit - Bloomberg

Longer-term Themes:
Cyber Life and Digital Rights:
Kitchen Sink: X (formerly Twitter) is shrinking meaningfully under Elon Musk, according to new data from mobile research firm Apptopia. Since Musk bought the company in October 2022, it’s lost approximately 13% of its app’s daily active users. And its rebranding from Twitter to X accelerated the decline. Under his stewardship, X’s daily user base has declined from an estimated 140 million app users to 121 million, with a widening gap between people who check it daily vs. monthly. X’s remaining daily users are engaged similarly as before. But the pool is shrinking. Meta’s Threads, meanwhile, isn’t taking advantage, with stagnant engagement and little meaningful migration from Twitter. - Exclusive Data: Twitter Is Shrinking Under Elon Musk – Big Technology

New Challenges: Minors and parents suing Facebook and other technology giants for the kids’ social media platform addictions won an important ruling advancing their collection of lawsuits in a California court. A state judge on Friday threw out most of the claims but said she’ll allow the lawsuits to advance based on a claim that the companies were negligent and knew that the design of their platforms would maximize minors’ use and prove harmful. Internet companies have long relied on Section 230 of the Communications Decency Act, a federal statute that has consistently shielded them from liability over comments, ads, pictures, and videos on their platforms. Importantly, Kuhl ruled that laws protecting free speech and Section 230 don’t stop the negligence claim in the collection of California cases from going forward. - Kids Suing Social Media Over Addiction Find a Win Amid Losses - Bloomberg

Too Free: Hamas is barred from most social media platforms. But its following has surged on popular messaging app Telegram since its October 7 terror attack on Israel. One account belonging to the al-Qassam Brigades, the armed wing of the Hamas movement, has seen its following triple, and there has been a ten-fold increase in the number of views of videos and other content posted by the account. Because of its very loose content moderation rules, Telegram has become popular among extremist groups internationally and among far-right groups in the United States. Internet platforms have broad leeway in the United States to moderate what appears on their platforms, and that right is protected legally both by the First Amendment and Section 230 of the Communications Decency Act, the hot-button federal law that has been widely criticized by Republicans and Democrats for letting tech companies off the hook, albeit for different reasons. Telegram could face tougher scrutiny in the European Union, where regulations require platforms to remove terrorist content within one hour of an EU authority notifying them of its existence. - Hamas’ social media following has skyrocketed since its attack. America is powerless to stop it - CNN

New Rules Coming: U.S. Trade Representative Katherine Tai has dropped longstanding U.S. digital trade demands in World Trade Organization talks in order to give Congress room to regulate big tech firms, her office said on Wednesday. The U.S. is withdrawing proposals made in 2019 by the Trump administration, insisting that WTO e-commerce rules allow free cross-border data flows and prohibit national requirements for data localization and reviews of software source code. The official said U.S. policy must take into account regulatory objectives, "balancing the right to regulate in the public interest and the need to address anticompetitive behavior in the digital economy," - US drops digital trade demands at WTO to allow room for stronger tech regulation - Reuters

A.I. All Day:
Dual-Use: President Biden is expected to sign an executive order next week addressing rapid advances in artificial intelligence, laying the groundwork for Washington’s embrace of AI as a tool in the national security arsenal while also pressuring companies to develop the technology safely. The order is aimed at establishing guideposts for federal agencies’ own use of AI while also leveraging the government’s purchasing power to steer companies to what it considers best practices. Security researchers and intelligence officials have said that AI can be an instrument to vastly improve cyber defenses for businesses, critical infrastructure, government agencies, and individuals. But it also could be weaponized by foreign governments and criminal hackers to write malware, more easily automate intrusion attempts, and quickly respond to evolving security defenses. Those scenarios are top areas of concern for senior Biden administration national security officials. - Biden Moves to Embrace AI as National Security Tool in Executive Order – WSJ

Energy’s Midlife Crisis:
No Easy Option: A growing number of companies are setting up programs to create or trade carbon offsets, using tree planting, soil management, and other means to purportedly balance out emissions elsewhere. Meanwhile, numerous corporations and nations are announcing “net zero” emissions plans that rely upon these programs, and rapidly proliferating carbon-removal startups are highlighting what some consider overly rosy projections in their investor pitch decks. The noise, news, and hype are feeding a perception that carbon removal will be cheap, simple, scalable, and reliable, none of which we can count on. There are limited options for large-scale carbon removal. These include direct air capture, the use of various minerals that bind with CO2, reforestation efforts, and what’s known as bioenergy with carbon capture and storage. None of these options can be easily scaled up. Direct air capture is still prohibitively expensive and energy-intensive. Using crops for fuel means snatching land from other uses, such as growing food for a swelling population. The article covers all the other challenges awaiting this growing industry - Carbon removal hype is becoming a dangerous distraction – MIT Technology Review

Food: Security, Innovations, and Climate Change Implications:
Shrinking the Safety Net: An estimated 17 million households reported problems finding enough food in 2022, a sharp jump from 2021 when boosted government aid helped ease the pandemic-induced economic shutdown. A new Department of Agriculture report, released Wednesday, paints a sobering picture of post-pandemic hardship with “statistically significant” increases in food insecurity across multiple categories. Using a representative survey sample of roughly 32,000 American households the report said 12.8% (17 million households) reported occasional problems affording enough food in 2022, up from 10.2% (13.5 million households) in 2021 and 10.5% (13.8 million households) in 2020. The number of households reporting more serious forms of economic hardship also increased. Households experiencing this level of hardship in 2022 rose to 5.1% (6.8 million households), up from 3.8% (5.1 million households) in 2021 and 3.9% (5.1 million households) in 2020. - Food insecurity shot up last year with inflation and the end of pandemic-era aid, a new report says – AP News

Cold Places (Deep Sea, Artic, and Space Colonization):
Crowded Skies: A new generation of satellites is redefining what’s possible in space. They are radically different from what has been the standard for almost the entire history of humans hurling things into orbit. They tantalize potential customers, including governments, businesses, and consumers, with the promise of fast, always-on internet access anywhere on Earth, anytime. As a result, Starlink may soon have plenty of competition as countries and companies race to build their own internet-delivering constellations of satellites using this technology. Efforts to build such networks, often in a public-private partnership, are currently underway in China, Europe, Taiwan, Canada, and Germany. And last week, Amazon launched the first two satellites of what the company has said will ultimately be thousands in a network that will go head-to-head with Musk’s offering. - Sorry, Elon! The Satellites of the Future Are Heading to Space Right Now – WSJ

Other Articles of Interest:
Stomach-Churning: Individual investors are dialing back how much risk they are taking across markets. Some are accumulating cash or stashing it in funds tracking bonds or money markets to take advantage of yields that have soared to 16-year highs. Others are backing away from turbocharged bets on stocks, borrowing less to amplify their positions. Many have pulled money out of U.S. stocks, putting equity exchange-traded and mutual funds on track for the first year of outflows since 2020. Much of the excitement that lighted up online message boards and Discord channels during the pandemic bull market has evaporated. Even Reddit’s WallStreetBets, the online group that became synonymous with YOLO trades, was recently dotted with conversations about interest rates, bond yields, and inflation, alongside brags about riskier trades. - Trading Stocks Loses Its Thrill: ‘I Would Get Burned’ – WSJ

VIEWS EXPRESSED IN "CONTENT" ON THIS WEBSITE OR POSTED IN SOCIAL MEDIA AND OTHER PLATFORMS (COLLECTIVELY, "CONTENT DISTRIBUTION OUTLETS") ARE MY OWN. THE POSTS ARE NOT DIRECTED TO ANY INVESTORS OR POTENTIAL INVESTORS AND DO NOT CONSTITUTE AN OFFER TO SELL -- OR A SOLICITATION OF AN OFFER TO BUY -- ANY SECURITIES AND MAY NOT BE USED OR RELIED UPON IN EVALUATING THE MERITS OF ANY INVESTMENT.
THE CONTENT SHOULD NOT BE CONSTRUED AS OR RELIED UPON IN ANY MANNER AS INVESTMENT, LEGAL, TAX, OR OTHER ADVICE. YOU SHOULD CONSULT YOUR OWN ADVISERS AS TO LEGAL, BUSINESS, TAX, AND OTHER RELATED MATTERS CONCERNING ANY INVESTMENT. ANY PROJECTIONS, ESTIMATES, FORECASTS, TARGETS, PROSPECTS AND/OR OPINIONS EXPRESSED IN THESE MATERIALS ARE SUBJECT TO CHANGE WITHOUT NOTICE AND MAY DIFFER OR BE CONTRARY TO OPINIONS EXPRESSED BY OTHERS. ANY CHARTS PROVIDED HERE ARE FOR INFORMATIONAL PURPOSES ONLY, AND SHOULD NOT BE RELIED UPON WHEN MAKING ANY INVESTMENT DECISION. CERTAIN INFORMATION CONTAINED IN HERE HAS BEEN OBTAINED FROM THIRD-PARTY SOURCES. WHILE TAKEN FROM SOURCES BELIEVED TO BE RELIABLE, I HAVE NOT INDEPENDENTLY VERIFIED SUCH INFORMATION AND MAKE NO REPRESENTATIONS ABOUT THE ENDURING ACCURACY OF THE INFORMATION. I MAY OR MAY NOT HAVE POSITIONS IN ANY STOCKS OR ASSET CLASSES MENTIONED. I HAVE NO AFFILIATION WITH ANY OF THE COMPANIES OTHER THAN EXPLICITLY MENTIONED.