


Less Hawky-Fed-Talky Supported Risk Assets on the Week Despite Rising Real Rates - MIDDAY MACRO WEEKEND READ– 3/3/2023
Color on Markets, Economy, Policy, and Geopolitics

Less Hawky-Fed-Talky Supported Risk Assets on the Week Despite Rising Real Rates - MIDDAY MACRO WEEKEND READ– 3/3/2023
Overnight and Morning Recap / Market Wrap:
Price Action and Headlines:
Equities are higher, ending the week on a positive note despite better-than-expected ISM PMI data as Fed officials sounded less hawkish, helping cyclical and growth-orientated sectors outperform
Treasuries are higher, with today’s positive price action reversing some of the rises in yields on the week, although yesterday, the entire Treasury curve was above 4% for the first time in the current tightening cycle.
WTI is higher, ending the week just under $80, as expected demand increased due to a more optimistic outlook on China’s reopening, moving the futures curve back into steep backwardation while supply may fall if North Sea workers strike as well as from other production closures globally

Narrative Analysis:
The data remained a little “too good” this week, but a lack of Fed speakers pushing the “higher for longer” narrative too loudly allowed equities to finish the week in the green as yields backed off recent highs today. There was also some positive inflation news on the week as the Service ISM PMI price sub-index didn’t rise (which policymakers weigh heavier than the manufacturing one), as seen in other recent business surveys, while home price data continued to show a cooling picture. In general, the macro debate continued to be one of “no-landing” verse a “soft-land,” with the emphasis still on how sticky service inflation remains. Despite the entire Treasury curve rising above 4% yesterday, the week saw an outperformance of cyclical and growth-orientated sectors/factors. In the end, the better start to the year has stabilized earning expectations, while higher real rates weigh on risk sentiment more generally. However, financial conditions were more stable, with the dollar off highs and the VIX lower, allowing the S&P to find support at its 200-dma and keep its October rally somewhat alive. Oil had a strong week as well as data out of China showed the economy regaining momentum while micro supply disruption headlines added up. Industrial metals were also better bid on the week, although copper gave up some gains yesterday after a notable rally earlier in the week. The agg complex on aggregate was little changed, although drought conditions worsened in Europe and India. As stated, the $DXY was down on the week, ending near 104.5 with stronger growth and inflation data elsewhere, reducing rate-differential flows. Please see our “Deeper Dive” section for more in-depth commentary on our current market/economy views.
The Nasdaq is outperforming the S&P and Russell with Growth, Value, and Small-Cap factors, as well as Communications, Consumer Discretionary, and Technology sectors all outperforming on the day. The week had a more cyclical positive tilt with Materials, Energy, and Industrials sectors as well as Growth and Small Caps factors outperforming.

@KoyfinCharts
S&P optionality strike levels have the Zero-Gamma Level at 3993 while the Call Wall is 4200 and Put Wall is 3900. Yesterday's move lower was met with strong positive delta buying at the market open, helped by dovish Fed comments, and today moving the S&P above the critical 4000 level, which is the long-term pivot/equilibrium point and has seen an increase of open-interests/gamma at the level. The rally above 4000 is leading to implied vols to fall, with the VIX now at a two-week low, and the selling of vol is supporting the current rally. 0DTE activity remains a driver of day-to-day price action, and with price and IV at a more neutral level will drive the trend moving forward.

@spotgamma
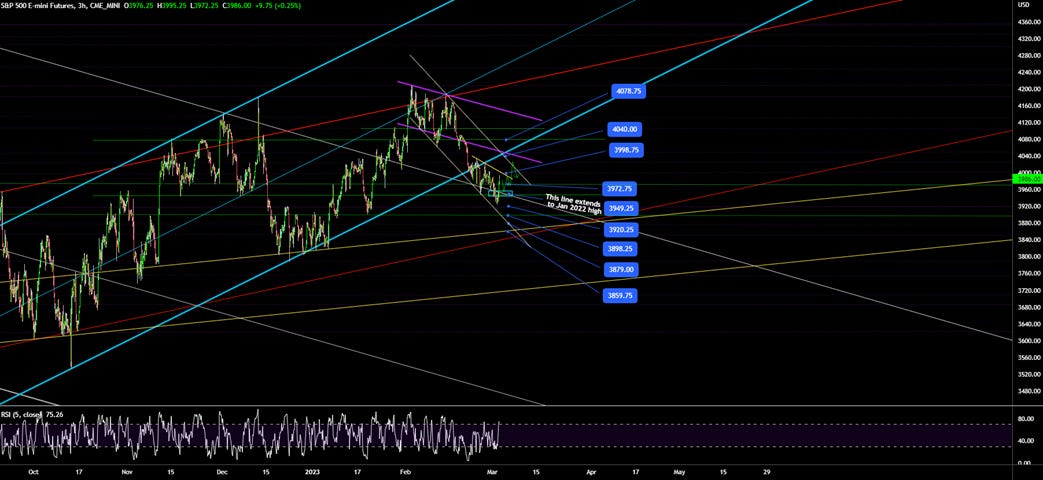
S&P technical levels have support at 4035 (major), then 4005 (major), with resistance at 4050, then 4080 (major). Yesterday’s bounce of 3950 for the S&P, after multiple tests, was a positive bullish signal, given it was the core bear market trendline from Jan ’22 and the 200-dma. As a result of the failed breakdown setup, the S&P is now back above its 50-dma and is hitting key resistance at the top of the February down channel with a highly overbought RSI condition. Some cooling and backtesting will be needed before next week's job report likely dictates the next real move higher or lower.
@AdamMancini4
Treasuries are higher, with the 10yr yield at 3.97%, lower by 10 bps on the session, while the 5s30s curve is more inverse on the session, moving to -37 bps.

Deeper Dive:
This week’s better-than-expected PMI data, both domestically in the U.S. and globally, as well as sticker inflationary reports in Europe, showed that the solid start for the year might continue for a while longer, leading markets to raise central bank tightening expectations further and driving yields higher, both of which are weighing on risk sentiment. However, despite tighter financial conditions and higher real rates, U.S. equities are ending the week on a positive note, putting in their first green week in a month. This is likely due to a lower level of Fed officials putting out a more hawkish message while the data shows a less rate-sensitive real economy than initially feared. We see the current narrative as close to peak “hawkish” on the terminal rate and duration the Fed will hold there. As a result, we believe yields, especially in the long end, can fall from here and support a resumption in the October equity rally into Q2. Still supportive technicals and more neutral positioning and overall sentiment that can turn more bullish if the data cools, which we believe will happen, should see major indexes recapture recent highs in Q2. More positive seasonals also bode well for both rates and equity markets, while the “goldilocks” scenario of cooling data that is supportive of the Fed pausing hikes but not overly detrimental to earnings growth is how we see March and April developing. As a result, we are adding two 10% long positions in $TLT, the long-bond ETF, and $QQQ, the Nasdaq ETF. We also moved our stops lower in our emerging market positions, as we don’t believe the recent pullback is a trend reversal but a tactical pullback that will reverse higher. At the macro level, we believe the recent uptick in growth will not derail the current disinflationary trend, especially as now well-documented shelter deflation increasingly hits the official data, reducing the level and duration markets expect the Fed to stay at the terminal while allowing earnings expectations to improve and multiples to expand (again) as real rates fall and financial conditions don’t tighten further.
With the fourth quarter earnings season nearly complete, the net profit margin of companies in the S&P 500 moved lower to 11.3%, down for the sixth consecutive quarter. Sales are rising, but higher costs for inputs such as labor, materials, and energy are denting profit margins across industries. Recent regional Fed business surveys and comments seen in this week’s ISM PMI reports confirmed this. However, this growing “reduced ability” to pass on cost increases shows that the mentality needed to sustain a more structural shift to a higher inflation regime is lacking. This is also apparent in consumer and business surveys that show inflation expectations continuing to trend lower despite January’s uptick in activity and actual inflation, as well as higher market-implied inflation expectations. When coupled with private firm data showing far fewer job openings than the JOLTs report, wage pressures mainly driven by turnover will increasingly fall and eventually reduce core-service CPI readings. Finally, we know that shelter costs, which have been dropping since last summer, will start to hit CPI/PCE reports in the coming months meaningfully, something even Governor Waller said this week he expected moving forward. Increases in the shelter component have been the primary driver of overall core inflation, sometimes as much as 2/3rds the gain on a monthly basis. As this increasingly becomes a drag, even sticky core-service ex-shelter inflation readings will not be enough to stop the risk-positive optical effect of falling annual changes in Q2 CPI readings, a period of considerably harder comparables, changing market’s Fed expectations from a headwind to more neutral on risk sentiment.

*Profit margins are back at pre-pandemic average levels following Q4 results

*With many Fed officials sticking to their December terminal rate projections despite the uptick in activity and inflation in January, the market may now be pricing in too high a terminal rate

*Inflation swaps and breakevens continue to rise due to the stronger-than-expected data

*Despite market-implied inflation expectations rising, both consumer and business ones are still trending lower, likely due to a more stable energy backdrop
To summarize, it is still all about inflation, as recessionary fears have fallen notably after the strong start to the year. Specific to this, it's really all about shelter and wage pressures cooling for the Fed to pause hiking rates and enter the cycle's next phase, given they have declared victory with goods, expect shelter to fall (and now need to be proven right), and have tied core-services ex-shelter to wage increases. As a result, we believe we are at “peak hawkishness” for the Fed. We know moving forward, shelter deflation will weigh more heavily on overall core inflation readings even as goods deflation slows and core services ex-shelter remains sticky for some time longer. We also see the labor market looser than the official data indicates. This is not just at a job openings level but also due to statistical adjustments to NFP and claims. Further, it is not an outright contraction in hiring the Fed needs to declare victory, just a move back to a level of hiring that aligns with their 2% target, meaning we really need to see turnover/quits fall back to a more historically average level, reducing wage spiral fears.

*Demand-driven inflation is still growing, showing a much less rate-sensitive economy and bringing into question the effects of cumulative policy actions so far, given that forward guidance had many Fed officials expecting a shorter lag

*As highlighted in the Macro-themes section below, private hiring/recruiting firms are seeing opening trending much lower than the official JOLTs report, which looks to have a sampling issue

*The combination of falling house prices and disinflationary new lease contracts for some time now should begin to increasingly be reflected in the shelter component of the CPI report
Given our views expressed above, and as noted earlier, we are adding tactical longs in longer-dated Treasuries and the Nasdaq, looking to capture 8% and 10% gains, respectively. We are far from out of the woods and don’t expect a more structurally positive macro backdrop for some time when solely focused on monetary policy. It is clear the U.S. economy is less rate-sensitive than thought, but we have yet to feel the full weight of the cumulative tighter policy. We also have not delved into numerous other headwinds for risk assets, including a continued negative geopolitical backdrop leading to a higher level of uncertainty over where growth and inflation will go. We take some comfort in how China’s reopening is proceeding, offering a positive growth pulse without too much of a subsequent inflationary demand-pull effect (yet), supporting our soft-landing view. Specific to U.S. equities, the bullish scenarios are the soft-landing and no-landing scenarios if inflation continues to moderate (in both), with a hard landing obviously being negative. Even more bearish would be the no-landing scenario with rebounding inflation. In this scenario, the Fed would be forced to raise interest rates high enough to cause a recession to bring inflation down. Earnings and valuation multiples would be crushed, and stock prices would fall well below last year’s lows. This is not our modal expected outcome, but it remains a sizeable tail risk given the start of the year so far. As a result, we continue to advocate tactical risk-taking with the idea that volatility (and vol of vol) will remain elevated in range-bound yet more positive trending markets.

*Stocks are not cheap, mainly due to large/mega caps, but with earning expectations potentially bottoming as costs stabilize and demand comes in stronger than expected, multiples can expand further if financial conditions ease

*March is usually the beginning of a stronger seasonal period of the year

*Our mock portfolio is up by 5.5% since its inception, with the pullback in EM equities, especially in China, hurting performance recently
Econ Data:
The ISM Manufacturing PMI rose to 47.7 in February from 47.4 in January but was below expectations of 48. Measures of demand, seen in New Orders (47 vs. 42.5), New Export Orders (49.9 vs. 49.4), and Backlogs of Orders (45.1 vs. 43.4), all contracted at a slower pace. Imports (49.9 vs. 47.8) also improved, effectively now at a neutral level. Production (47.3 vs. 48) and Supplier Deliveries (45.2 vs. 45.6) were both little changed, remaining in contractionary territory. Customers’ Inventories (46.9 vs. 47.4) remained at ‘too low’ levels, while general Inventories (50.1 vs. 50.2) remained neutral. Employment (49.1 vs. 50.6) moved back into contractionary territory. Price (51.3 vs. 44.5) readings rose, indicating inflationary pressures increased.
Why it Matters: The reading pointed to a fourth consecutive month of falling factory activity, but there was a marginal improvement over the month. Demand measures continued to ease, but low levels of customer inventories indicate stronger future demand. Output and consumption measures were negative, with production falling further into contractionary territory for a third month while hiring activity turned negative. However, panelists’ companies continue to indicate that they will not substantially reduce head counts, as sentiment is positive about the second half of the year, though slightly less so compared to January. Finally, inputs continue to accommodate future demand growth, with faster delivery times and inventories more neutral as panelist managed their supply chains better. “Of the top six industries, only two industry groups, machinery and transportation equipment, expanded in February. Weak contraction in the Production Index continues to support manufacturing executives’ strategy to extend output during the first half of 2023, as panelists’ companies attempt to retain workers to prepare for better second-half performance. The index reached its lowest level since May 2020 (34.2%),” said Timothy Fiore, CPSM, C.P.M., Chair of the Institute for Supply Management. Fiore went on to say in an interview on Bloomberg that only 10% of industries were below his 45 “red flag” contractionary level, down from 26% in January. Finally, Fiore also highlighted that increases in industrial metals drove the price sub-index higher. Electronic components have also remained in short supply for 29 consecutive months now.

*All five subindex contributors moved into contractionary territory in February

*New Orders moved closer to unchanged while the employment index moved back into contractionary territory.

*Comments were more positive. However, as indicated by comments from Fiore, a minority of industries are seeing activity contract at a notable level
The ISM Services PMI came in at 55.1 in February, coming in little changed from the 55.2 reading in January and above expectations of 54.5. Demand measures improved with increases in New Orders (62.6 vs. 60.4), New Export Orders (61.7 vs. 59), and little change in the level of Backlog of Orders (52.8 vs. 52.9), all of which are in expansionary territory. Business Activity/Production (56.3 vs. 60.4) did cool but also remained well in expansionary territory. Employment (54 vs. 50) moved up from last month's neutral reading. Supplier Deliveries (47.6 vs. 50) moved into contractionary territory, with numerous respondent comments noting improving logistical conditions. Prices (65.6 vs. 67.8) remained elevated, with only a marginal decline in the month. Finally, Inventories (50.6 vs. 49.2) and Inventory Sentiment (55.3 vs. 55.8) were little changed, while Imports (52.6 vs. 53) remained expansionary.
Why it Matters: Overall, a positive report, indicating that the uptick in January’s PMI was not a one-off. Demand measures continue to be strong, with a rising three-month trend of panelists responding they see higher new orders, something also seen in new export orders. The inventories index grew in February after eight consecutive months of contraction, with respondents still adjusting to the new year and having mixed views on future lead times. Prices saw a drop in firms experiencing higher or lower costs, with the amount reporting the same rising to 60% from 53%. This was also similar to responses regarding the level of backlog of orders, with almost 75% seeing no change verse 58% in January. Finally, the comments generally leaned more optimistic, with most respondents saying their activity was growing or at least steady. However, there continued to be worries regarding the ability to reduce costs, and as a result, defending profit margins as passing on price increases had become more challenging. “Business Survey Committee respondents indicated that they are mostly positive about business conditions. Suppliers continue to improve their capacity and logistics, as evidenced by faster deliveries. The employment picture has improved for some industries, despite the tight labor market. Several industries reported continued downsizing,” said Anthony Nieves, Chair of the ISM.

*New orders drove the headline PMI higher despite a cooling in the expansion of production, while the employment index saw a decrease in reduction responses.

*The majority of sub-indexes are well in expansionary territory, with declines in delivery times and prices more generally boding well for reduced inflationary pressures despite increased demand

*Stable to slightly better than expected activity continued in February while firms also grew more nervous about being able to reduce costs
Durable goods orders fell by -4.5% in January, reversing from a downwardly revised 5.1% jump in December, and compared with market forecasts of a -4% MoM decline. Excluding transportation, durable goods orders were up 0.7% MoM. Total shipments were lower by -0.1% MoM, but excluding transportation, were higher by 0.8%. New orders for “Core” non-defense capital goods (excluding aircraft) increased by 0.8% MoM, and shipments increased by 1.1%. Both new orders for Machinery (1.6%) and Computer and Electronic Products (0.5%) were higher in the month.
Why it Matters: The decrease at the headline level was driven by a -13.3% decline in orders for transportation equipment, namely orders for nondefense aircraft and parts (-54.6). Orders also declined for capital goods (-12.8%), mainly in nondefense ones (-15.3%). On the other hand, the increase in new orders for core capital goods showed business spending plans improved after declines in December. The strongest gains in new orders were in computers and machinery, showing an uptick in business investment intentions and confidence.

*Total new orders of durable goods fell due to large declines in transportation equipment orders, while “core” goods rose in January
Construction spending fell by -0.1% month-over-month to $1.826 trillion in January, following an upwardly revised -0.7% contraction in the previous month and missing market forecasts of a 0.2% MoM increase. Public construction sank by -0.6% from the prior month, while private investment was flat. Private residential construction decreased by -0.6% MoM, now down -3.8% YoY, again with a divergence between single family (-1.7%) verse multifamily (0.4% MoM). Total non-residential construction rose 0.3% MoM, driven higher by increases in manufacturing (5.9% MoM), power (0.9% MoM), and office (0.7% MoM).
Why it Matters: Private new multifamily (20.6% YoY) remained positive, while single-family (-18.4% YoY) construction declined further. Also, increases in manufacturing construction show the “onshore” movement continues despite a less optimistic outlook for manufacturing more generally. Finally, public construction, although a much smaller level of activity than private, cooled in January but is still up 11.1% on an annual basis with the expectation for a more steady picture here due to reduced rate sensitivity and passed legislative initiatives that should see transportation and Highway and Street spending increase.

*Non-residential construction continues to trend higher while falling single-family activity has trended residential activity notably off its ’22 peak

*On an annual basis, despite the strong multi-family activity, private residential construction is now negative on an annual basis
Wholesale inventories fell by -0.4% from a month earlier to $929.7 billion in January, following a 0.1% rise in the prior month. It was the first decline in inventories since July 2020, as stocks fell for both durable (-0.1% vs. 0.6% in Dec) and non-durable goods (-0.8% vs. -0.8%). On an annual basis, wholesale inventories grew by 15.9% YoY in January. Retail inventories rose by 0.3% MoM, after a downwardly revised 0.1% increase in the prior month, mainly due to a 0.6% increase in auto and parts.
Why it Matters: The wholesale/retail inventory data confirmed what many business surveys have shown, more and more firms are holding lower inventory levels as demand for goods continues to ease and supply chains normalize, reducing the need to hold more stock in light of greater future demand uncertainty. When combined with the small decline in durable goods inventories, it is increasingly looking like overall inventory activity will be a drag on Q1 GDP, likely around -1 to -1.25 percentage points.

*Inventories continue to normalize as both wholesalers and retailers reduce stock levels after the holiday period and in anticipation of a lower demand environment
Pending home sales rose by 8.1% in January, following a downwardly revised 1.1% rise in December and beating market forecasts of a 1% gain. Year-over-year, pending transactions were lower by -24.1%. The largest regional increase was in the West (10.1% MoM), followed by the South (8.3%), Midwest (7.9%), and finally, the Northeast (6%).
Why it Matters: January saw the largest monthly increase since June of 2020, with contract signings increasing notably in all four major regions, as buyers responded to better affordability from falling mortgage rates in December and January. “Home sales activity looks to be bottoming out in the first quarter of this year before incremental improvements will occur. But an annual gain in home sales will not occur until 2024. Meanwhile, home prices will be steady in most parts of the country with a minor change in the national median home price”, said NAR Chief Economist Lawrence Yun. “An extra bump occurred in the West region because of lower home prices, while gains in the South were due to stronger job growth in that region,” Yun added. With mortgage rates now a half percentage point higher, it is unlikely this outsized momentum will be sustained moving forward, but as noted by Yun, a bottom in activity is forming.

*Despite the uptick in January, pending home sales are still lower than historically normal for this time of year
The S&P/Case-Shiller Home Price Index decreased by -0.9% in December, marking a sixth consecutive month of declines in house prices. The monthly decline in the national index moves the annual rate to 5.8% from 7.6% in November. The S&P CoreLogic Case-Shiller 20-city index fell even further, now at 4.6% year-on-year in December from a 6.8% increase in November and forecasts of 5.8%. On an annual basis, the biggest declines were in San Francisco (-4.2%) and Seattle (-1.8%), while the biggest rises were seen in Miami (15.9%), Tampa (13.9%), and Atlanta (10.4%). Separately, the average price of single-family houses with mortgages guaranteed by Fannie Mae and Freddie Mac fell by -0.1% in December, the same as in November, moving the annual increase to 6.6%, the least since June of 2020.
Why it Matters: House price appreciation slowed for an eighth straight month to book the lowest annual growth since July 2020. “House price appreciation continued to wane in the fourth quarter,” said Dr. Polkovnichenko, Supervisory Economist in FHFA’s Division of Research and Statistics. “The prospect of stable, or higher, interest rates means that mortgage financing remains a headwind for home prices, while economic weakness, including the possibility of a recession, may also constrain potential buyers. Given these prospects for a challenging macroeconomic environment, home prices may well continue to weaken”, says Craig J. Lazzara, Managing Director at S&P DJI.

*The deflationary trend remains intact, with home prices likely to continue to fall, potentially increasingly in areas that saw the strongest price appreciation post-pandemic

*The west coast is seeing the greatest pressures on home prices, with notable differences between 2021 and 2022.
Unit labor costs increased an annualized 3.2% in the fourth quarter of 2022, faster than initial estimates of a 1% gain and compared with market forecasts of a 1.6% rise but slowing from an upwardly revised 6.9% rise in the previous period. It is the smallest increase in labor costs since the first quarter of 2021, reflecting a 4.9% increase in hourly compensation and a 1.7% increase in productivity.
Why it Matters: In 2022, unit labor costs advanced by 6.5%, after a 2.4% increase in 2021. With the Fed linking any future declines in core services ex-shelter inflation to falling labor costs, this report is not good news. Additionally, the price deflator for the nonfarm output was revised up to a 3.2% gain from 3.0%.

*Unit labor costs may have peaked, given what other wage data is showing and expectations for cooling in labor markets, but Q4’s revision higher was a net negative for wage-spiral fears

*A revision higher in hours worked saw productivity fall
The Conference Board’s Consumer Confidence Index decreased to 102.9 in February, down from 106.0 in January (a downward revision). The Present Situation Index increased to 152.8 from 151.1 last month. The Expectations Index fell further to 69.7 from a downwardly revised 76.0 in January. Consumers’ assessment of current business conditions moved lower with an increase in “no change” responses, while views on the labor market were more favorable, as jobs were viewed as more “plentiful.” Consumers became more cautious about their future short-term business conditions and labor market outlooks, while views on future income prospects worsened by more. One-year-ahead inflation expectations improved, falling to 6.3% from 6.7% last month.
Why it Matters: The Expectations Index remains well below 80, the level which often signals a recession within the next year. It has been below this level for 11 of the last 12 months. In contrast, the Present Situation Index moved higher due to a more favorable outlook on the labor market, with the proportion of consumers saying jobs are plentiful climbing to 52%. Interestingly although expectations saw all three categories (business conditions, labor markets, and incomes) fall, it was due more to an increase in “no changes” and less “favorable” views than an increase in “worsening” views. However, consumers may be showing signs of pulling back spending, with fewer consumers planning to purchase homes or autos and also appearing to be scaling back plans to buy major appliances. Vacation intentions also declined in February.

*There is a growing divergence between a more positive assessment of the current situation and gloomier expectations for the future

*Present employment remains the sole positive contributor to the overall consumer confidence index
The Dallas Fed’s Manufacturing Index fell 5.1 points to -13.5 in February, from -8.4 in the previous month. Activity readings, as seen in Production (-2.8 vs. 0.2 in Jan) and Capacity Utilization (-4.1 vs. 6) sub-indexes, moved into contractionary territory, while demand readings, as seen in New Orders (-13.2 vs. -4), Growth Rate of Orders (-16.9 vs. -12.3) and Unfilled Orders (-13.3 vs. -6.7) all moved further into contractionary territory. Shipments (-5 vs. -6.3) and Delivery Times (3.4 vs. -0.2) did marginally improve, and Finished Inventories (-3 vs. -8.9) moved closer to neutral. Labor market measures suggest relatively flat hiring intentions, with Employment (-1 vs. 17.6) falling notably while Hours Worked (4.9 vs. 3.8) remained expansionary. On the price front, Prices Paid ( 25.1 vs. 20.5), Prices Received (15.8 vs. 9.9), and Wages (32.7 vs. 30.5) all rose, showing inflationary pressures intensified in February. Capex (-1.3 vs. 11.6) moved into negative territory. Finally, future general business activity (-2.9 vs. -9.1) expectations moved closer to neutral, despite a worsening in Company Outlook (-0.4 vs. 6) mainly due to improved outlooks for production, shipments, and employment. The expected prices paid and received increased while Capex intentions fell but remained expansionary.
Why it Matters: Perceptions of broader business conditions worsened in February as pessimism increased, with the general manufacturing activity of the Texas region marking its tenth consecutive month of contraction. The report also had a slightly more conflicted message, with production, capacity utilization, and demand measures falling while shipments and hours worked rose slightly. Inflationary readings picked up with price measures and wages rising, while logistical measures, seen in delivery times, moved back into expansionary territory. Outlook uncertainty increased, correlating with notable rises in expectations for price increases in the future. Rising inflationary pressures are again weighing on business confidence after improving slightly at year-end. The special question of the month focused on product demand and operating margins. Compared to last November, when it was last asked, many firms noted a slight improvement in their operating margins in the past six months and expected a further improvement moving forward. Firms also generally expected demand to improve from last year, mainly in the second half of the year, although this outlook was less clear

*Manufacturing activity in the Texas region has remained in contractionary territory for ten months now

*Decreases in New Orders as well as a notable drop in Employment, were the main drivers of the move lower in the overall activity index
The Richmond Fed’s Manufacturing Index decreased to -16 in February from -11 in the previous month, the lowest level since May 2020. Business's negative views on Local Business Conditions (-13 vs. -13 in Jan) were unchanged. Demand measures, as seen in New Orders (-24 vs. -24) and Backlog of Orders (-29 vs. -31), remained negative but did not worsen during the month. Activity measures did worsen, with Shipments (-15 vs. -3) and Capacity Utilization (-17 vs. -7) both moving further into contractionary territory. Inventory readings were little changed, with Raw Materials (13 vs. 14) and Finished Goods (21 vs. 21) both indicating continued growing stock levels despite Vendor Lead Times (-17 vs. -13) contracting further. Employment readings cooled, with the Number of Employees (-7 vs. -3) and Wages (31 vs. 41) falling, although the Availability of Skills Needed (-2 vs. -8) moved closer to neutral after an improvement in January. Price measures on aggregate improved, with Prices Received (5.54 vs. 6.52) falling notably, although Prices Paid (7.9 vs. 7.91) were little changed. Capex (-1 vs. 9) and Service Expenditures (-12 vs. -10) both fell. Future expectations improved significantly more than the current situation readings. Demand and activity measures all moved higher. Inventory intentions moved closer to neutral while future employment readings all cooled, although on aggregate only slightly. Finally, future inflation expectations were in line with changes seen in current conditions, with prices paid rising and received falling.
Why it Matters: Activity and employment-related measures moved the headline reading lower while demand readings remained more stable. There was less of an increase in inflationary pressures than in other regional Fed surveys. The notable decrease in current Capex and service demand, although slightly offset by future service demand increases, as well as the drop in local business condition readings, pointed to a further decline in business confidence in the fifth district. However, the future outlook for demand and activity did notably improve, showing that declines in current readings and a weaker outlook may be due more to a view that the current slowing will not continue or produce a recession

*The Fifth District Manufacturing activity moved further into contractionary territory in February

*There was a stark difference between current and expected conditions, showing a more mixed picture despite the decline in the headline reading
The Chicago PMI fell to 43.6 in February from 44.3 in January, coming in lower than market forecasts of 45. Production fell notably, reversing last month’s rebound, with approximately 40% of businesses flagging slower activity. New Orders increased to the highest level since last August but remained contractive, signaling a ninth successive month of declining orders. Employment weakened for a third month, slipping further into a contractionary territory and reaching the weakest level since June ’20. Prices Paid fell, returning to late 2022 levels after briefly surging in January. Around 39% of firms paid higher prices in February, slowing from 54% in January. Order Backlogs and Supplier Deliveries gained as logistics issues persisted, and deliveries took the same amount of time as the month prior. The inventories subcomponent was little changed.
Why it Matters: Production, Employment, and Prices Paid indicators declined over the month in February, with Production recording the steepest deterioration. New Orders, Order Backlogs, and Supplier Deliveries increased, while the Inventories subcomponent was little changed. All indicators barring Supplier Deliveries and Prices Paid were in contractive territory. The months’ special questions asked if respondents had seen an easing in supply chain blockage, with the majority responding yes or somewhat. Firms also noted that despite labor shortages, most were not or only somewhat looking at automation options. Finally, firms were asked about future demand expectations. Most firms expected no increase in or only somewhat of an increase in new orders.

*After a notable move higher in January, the Chicago PMI again fell in February, mainly due to a large drop in production activity
Policy Talk:
This week was lighter than the last two regarding Fed officials' engagements, with fewer prepared remarks or interviews given. Waller’s and Bostic’s speeches and interviews stuck out, eliciting market price reactions at various points. New Governor Jefferson gave a lecture on inflation to an Econon 101 class at Harvard which was not particularly insightful towards his views on where Fed policy is going. Today sees Logan, Bowman, Barkin, and again Bostic, who is on his fourth appearance of the week, giving speeches. In general, there is a little bit of a split again between those who want to move forward more cautiously with 25 bp hikes verse those who, if the data, which was acknowledged as problematic in January, continued to be “hotter” and hence warranted a resumption of 50 bp hikes. However, despite the uptick in inflation readings, labor market tightness, and consumer activity, the majority of Fed speakers noted they were continuing to stay with the December terminal rate projections (as seen in the SEPs) but emphasized the importance of the coming data before the March FOMC meeting.
Fed Governor Waller prepared remarks titled “February’s Hot Data Releases” for the Mid-Size Bank Coalition of America in Los Angeles, although he was unable to give them via Zoom due to some “technical” issues. He highlighted that the stronger-than-expected data in January challenged his view that the Fed was making significant progress in “moderating economic activity and reducing inflation.” He noted that the tight labor market continues to complicate the Fed's path forward because wages are growing notably faster than average and causing service price pressures. He did express some optimism, given expectations that shelter costs, already falling for some time, would increasingly hit the “official” data. He also noted that the strong January data may have been an anomaly, associated with more favorable weather, and “forthcoming data will show that economic activity and inflation resumed their decline.” He concluded his remarks by saying he would be very pleased if the data received before the March FOMC showed a resumption in the downward path in inflation readings while job creation dropped back down to levels consistent with supporting that downward trajectory. He did not commit to raising rates further by 25 basis points, saying he would be open to going by 50bp. His terminal rate trajectory remained between 5.1% and 5.4%.
“Recent data suggest that consumer spending isn’t slowing that much, that the labor market continues to run unsustainably hot, and that inflation is not coming down as fast as I had thought.”
“I don't want to brush aside the fact that we have made progress in reducing inflation, and there are indications that further improvement is coming. The three-month inflation rate is running below the 12-month rate, which highlights the progress. And there are reasons to be optimistic about continued improvement, including a sharp deceleration in rent increases since the middle of last year, which will start to get captured in inflation statistics only in the coming months.”
“I would be very pleased if the data we receive on inflation and the labor market this month show signs of moderation, which would suggest that the February data releases were just a bump in the road and that progress is continuing.”

Atlanta Fed President Bostic spoke three times this week, giving prepared remarks and two interviews. He continued the Fed’s unified message that the focus was on doing more, not less, to ensure inflation was not becoming more entrenched. However, he believes smaller rate hikes moving forward make sense and stressed that the effects of the cumulative tightening of policy so far will only hit the economy in a lagged manner, increasingly by this spring. As a result, Bostic’s current expected rate path estimate envisions only two quarter-point moves in March and May, expecting to pause hikes after that and not yet revising up his terminal rate projections higher. He focused on improvements in supply chains as giving him comfort despite recently more persistent inflation readings, pointing to declining inflation expectations in business surveys. His focus is now on watching the breadth of inflation, noting that although improving, it will need to narrow considerably from around 50% above 6% currently. Bostic is not a current voter but is seen as a moderate whose views align with the FOMC consensus.
“So, now we must determine when inflation is irrevocably moving lower. We're not there yet, and that is why I think we will need to raise the federal funds rate to between 5 and 5.25 percent and leave it there until well into 2024.”
“I want to be completely clear: There is a case to be made that we need to go higher. Jobs have come in stronger than we expected. Inflation is remaining stubborn at elevated levels. Consumer spending is strong. Labor markets remain quite tight.”
“Right now I’m still very firmly in the quarter-point move pacing, it is appropriate for us to be cautious and carefully calibrate to make sure that we don’t do more than we need to, but we do enough so that inflation gets to the 2% level.”

Technicals and Charts:
Four Key Macro House Charts:
Growth/Value Ratio: Growth is marginally higher on the day and the week, and Small-Cap Growth is the best-performing size/factor on the week.

Chinese Iron Ore Future Price: Iron Ore futures are higher on the day and the week.

5yr-30yr Treasury Spread: The curve further inverted on the day and week.

EUR/JPY FX Cross: The Euro was stronger on the day and the week.

Other Charts:
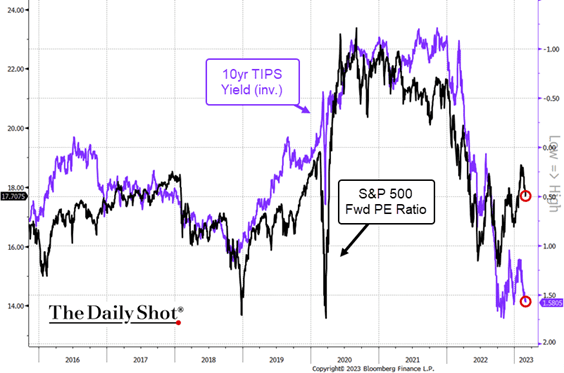
The main story driving markets has been the rise in real rates, weighing on risk assets. This is why the more modest pullback in equities despite much higher nominal yields and real rates is somewhat surprising

Deutsche Bank’s positioning index saw its biggest pullback last week in three months…

However, corporate buybacks, CTAs, and retail traders continue to support equities this week.

February was fairly negative for global assets, with all major global financial asset categories down on the month.

Real disposable income has bottomed out and will likely increase further throughout ’23 as inflation falls and wages remain more sticky.

Manufacturing is expected to improve into the summer based on better activity in China.
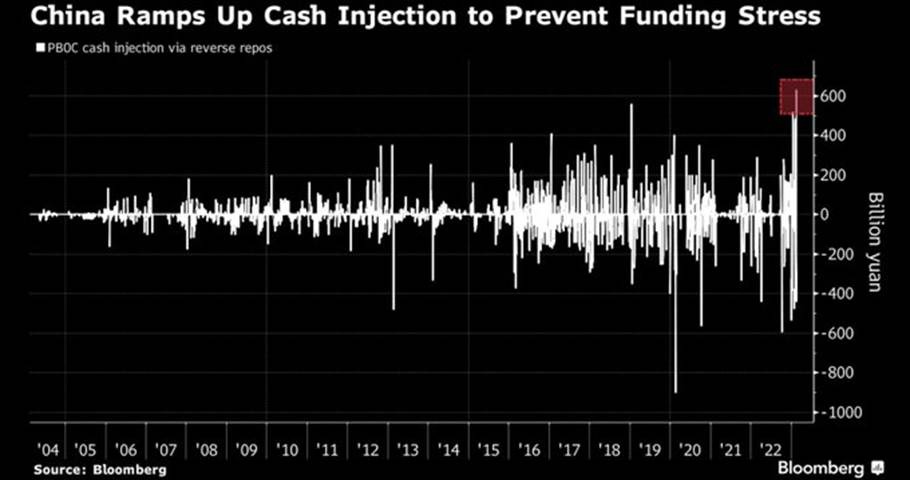
Large cash injections on top of better-than-expected PMI reports and other economic data helped Chinese stocks rebound from their February drawdown.
Articles by Macro Themes:
Medium-term Themes:
Labor Markets Loosening:
Officially Wrong: ZipRecruiter and Recruit Holdings, two large online recruiting companies, say their data show the number of job postings is declining more than Labor Department reports of job openings. Indeed also showed a greater drop than the government figures, though not as stark as ZipRecruiter found. Indeed’s data show that companies are cutting back on sponsored job postings, which they pay for, meaning they have been less willing to invest heavily to fill open positions.Other private data also point to a decline in available jobs. The National Federation of Independent Business, which represents small businesses, and LinkUp, a research firm that tracks job listings that companies place on their own websites, also show a sharper drop in postings than recent government reports on openings. - Long-Robust U.S. Labor Market Shows Signs of Cooling – WSJ

Better Availability: Senior executives across a host of S&P 500 companies gave optimistic updates on the labor market in recent quarterly earnings reports. Their commentary could reassure investors concerned that a tight labor market threatens the Federal Reserve’s efforts to bring down inflation. For many consumer-facing businesses, staffing shortages since the coronavirus pandemic started have driven up costs and hit sales as some struggled to maintain normal operating hours. The improvement has not been limited to lower-paying industries such as restaurants and hotels. Few companies said the challenges had completely lifted even after the recent improvement, and some industries were still suffering from shortages of specific skilled workers, such as airline pilots. - U.S. companies say it is easier to hire despite low jobless rate - FT

Less than 35hrs: The number of Americans working part-time rose by 1.2 million in December and January compared with the preceding months. Most of that increase of 857,000 workers was driven by people who worked part-time by choice, not because they were unable to find full-time work or their hours were cut. The total number of people working part-time voluntarily, 22.1 million in January, is now almost six times the 4.1 million who are working part-time but would prefer full-time hours. That is the highest ratio in two decades. In total, 16.3% of the 160 million Americans who were employed in January worked part-time hours. The rise is a combination of burnout of prime-aged workers and retirees reentering the workforce due to higher costs from the current inflation pulse. Longstanding reasons for choosing part-time work, such as caregiving responsibilities, health issues, and school commitments, also remain at play for millions of Americans. - Burned Out, More Americans Are Turning to Part-Time Jobs – WSJ

China’s Pandemic:
New Normal: Congestion in major cities last week was the worst since at least the start of 2022. The number of people riding the subways in Beijing, Shanghai, Chongqing, and other major cities was back to or above pre-pandemic levels. UBS Group AG’s latest China consumer survey, released Tuesday, showed an increase in dining out, shopping in stores, and offline entertainment. Yet the rebound is proving to be lopsided. Sales of big-ticket items, like cars and homes, continue to decline, reducing demand for commodities like steel, and exports are likely to slump further. That suggests China’s post-Covid recovery is being led by industries like retail and services, and the industrial sector will remain subdued.- China’s Clogged Roads Show Economic Recovery Gathering Pace - Bloomberg

Lots of Savings: Chinese families, constrained by Covid lockdowns, hoarded cash and pushed up the country’s household saving rate to a multiyear high of 33% in 2022, up three percentage points from the pre-pandemic trend in 2019. Large industrial companies and exporters also socked away money. From 2020 to 2022, big industrial companies, many state-owned, added $1.1 trillion in liquid assets on average each year since 2020, more than double the annual average amount before Covid hit.Economists say the end of China’s strict zero-Covid policies will, at minimum, fuel a strong recovery in services spending, lifting consumption growth to at least its pre-pandemic rate of around 8% a year. Initial data from China’s recent Lunar New Year holiday suggest some Chinese consumers are eager to dine out and visit cinemas again. - Covid-Era Savings Are Crucial to China’s Economic Recovery – WSJ

Longer-term Themes:
Cyber Life and Digital Rights:
Pay-to-Play: Social media companies can’t make as much money off their free users as they used to. A weaker advertising market, privacy restrictions imposed by Apple that make it harder to track users and their preferences, and the perpetual threat of regulation have made it harder for social media apps to sell ads. As a result, a pay-to-play model has come forth from Twitter and now Meta. Meta announced a paid version of its products with the “Meta Verified” program. Facebook and Instagram will each charge users $12 a month for a blue verification badge, more protection against account impersonation, access to “a real person” in customer support to help with common account issues, and — most importantly — “increased reach and visibility.”- Social media used to be free. Not anymore. – Vox

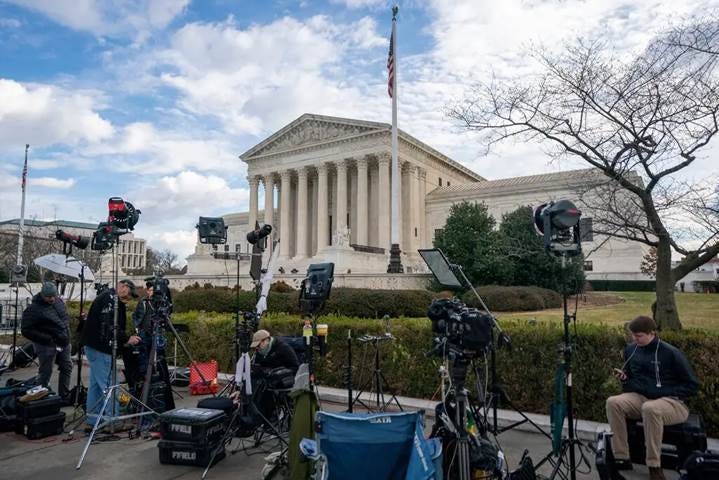
Complicated: In a case with the potential to alter the very structure of the internet, the Supreme Court did not appear ready during initial arguments to limit a law that protects social media platforms from lawsuits over their users’ posts. The federal law at issue in the case, Section 230 of the Communications Decency Act, shields online platforms from lawsuits over what their users post and the platforms’ decisions to take content down. Limiting the sweep of the law could expose the platforms to lawsuits claiming they had steered people to posts and videos that promote extremism, advocate violence, harm reputations, and cause emotional distress. The justices expressed doubt they were equipt to rule properly given a limited knowledge of the internet and AI, and this was better suited for Congress. - Supreme Court Seems Wary of Limiting Protections for Social Media Platforms - NYT
Meeting the Challenge: The Biden administration released its long-awaited national cybersecurity strategy Thursday, setting out in broad terms how the U.S. government should approach cybercrime, its own defenses, and the private sector’s responsibility for security over the next several years.The administration said it would pursue laws to establish liability for software companies that sell technology that lacks cybersecurity protections, concluding that market forces alone aren’t sufficient to guard consumers and the nation. The updated strategy, cohesive across federal agencies, is necessary due to the growing importance of digital services. At the same time, the White House says, malicious cyber activity has evolved from a criminal nuisance to a threat to national security, conducted by criminal gangs and nation-states. - How the U.S. National Cyber Strategy Reaches Beyond Government Agencies – WSJ

Energy’s Midlife Crisis:
Cooling Costs: In the past few months, previously red-hot cobalt and lithium prices have cooled dramatically. The chill is coming from both sides: supply and demand. Supply bottlenecks are easing while China’s demand for electric vehicles, and global demand for many consumer electronics, have ebbed as well. China’s EV subsidy cut in December is a big factor: Chinese new energy vehicle sales represented 64% of global sales of such vehicles in 2022, according to S&P Global. That hit to demand has seeped back up the supply chain with remarkable speed. Chinese lithium demand is now 52% below its three-month moving average, according to Goldman Sachs. The stage looks set for a further fall in prices unless growth in all three of the world’s major economic engines, the U.S., Europe and China, surprises on the upside this year. - Battery Metal Prices Fall Back to Earth – WSJ

Reviving Production: As the West has shunned most Russian energy, unleashing a pressure campaign against the Kremlin’s petroleum revenues, record U.S. crude exports have helped fill the gap in Europe with the oil needed to produce gasoline, diesel, and jet fuel. Since February 2022, when Russia invaded Ukraine, average monthly seaborne cargoes to the continent jumped 38% compared with the previous 12-month period, according to ship-tracking firm Kpler. The pull of oil shipments from the Gulf Coast to Europe, which Kpler pegged at 1.53 million barrels a day in January, has in recent months made the continent a larger destination for U.S. crude than Asia. The growth in exports marks the latest milestone in the revival of U.S. oil production after years of dwindling market clout. - War in Ukraine Drives New Surge of U.S. Oil Exports to Europe – WSJ

Food: Security, Innovations, and Climate Change Implications:
Uneven Access: Much of the world relies on just a few nations for most of its fertilizers, notably Russia, its ally Belarus and China. That’s pushed fertilizers and who controls them to the forefront of the political agenda around the world.Even though prices have fallen more than 50% from last year’s peak, farmers in Southeast Asia and Africa remain more exposed than their counterparts in North America, China, or India. The African Development Bank has warned that curtailed use is likely to mean a 20% drop in food production, while the WFP sees smallholders in the developing world at risk of “a major food availability crisis as the fertilizer crunch, climate shocks, and conflict upend food production.” - Russia and China Have a Stranglehold on the World’s Food Security - Bloomberg

Authoritarianism in Trouble?:
“Find” More Votes: The foreperson of a Georgia grand jury that investigated former U.S. President Donald Trump's attempts to overturn his 2020 election defeat in the state told media on Tuesday that the panel recommended multiple criminal indictments. The foreperson of the recently concluded Fulton County, Georgia, special grand jury, Emily Kohrs, did not discuss specific charges that the grand jury recommended. "There may be some names on that list that you wouldn't expect. But the big name that everyone keeps asking me about – I don't think you will be shocked," Kohrs told CNN. - Georgia grand jury probe of Trump bid to overturn vote recommended charges - Reuters

Reform?: Mexicans marched Sunday against President Andres Manuel Lopez Obrador’s overhaul of the electoral system, with demonstrators nationwide criticizing the reforms ahead of next year’s elections.AMLO’s changes seek to reduce funding for the INE, as the electoral body is known, and trim its workforce. The regulator and electoral court are untrustworthy, the president has said. The Senate passed the electoral bill on Feb. 22 after the government failed to achieve a broader overhaul that required changing the constitution. The original proposal included changes to how electoral authorities are chosen. - Mexicans March En Masse Against President’s Electoral Reform - Bloomberg

ESG versus the World:
Frustrating: The Net-Zero Banking Alliance, which is a sub-unit of the Glasgow Financial Alliance for Net Zero, faces a potentially embarrassing mutiny from some of the world’s most climate-conscious lenders after it decided against imposing binding restrictions on fossil-fuel financing. Compromises made by NZBA to keep Wall Street firms on board are “disappointing and discouraging,” said Jeroen Rijpkema, chief executive officer of Triodos Bank, a green lender from the Netherlands. Gareth Griffiths, CEO of the UK’s Ecology Building Society, described as “frustrating” the fact that major NZBA members continue to finance new fossil-fuel exploration, which is “incompatible with net zero.” NZBA is due to revise its target-setting guidelines by April 2024 as part of a periodic review of its criteria. - Wall Street Clashes With Green Bankers Fed Up With Oil Agenda - Bloomberg

Pushing Back: An increasing number of U.S. states are starting to push back against the anti-ESG rhetoric emanating from the Republican Party and a few of its high-profile governors. Some are moving ahead with their own rules to address sustainability concerns and lower greenhouse gas emissions. Despite the attempts in some quarters to politicize environmental, social, and governance concerns, momentum at the state level to further incorporate ESG is growing. - More States Push Back Against GOP’s Anti-ESG Campaign – Bloomberg

Green Standard: European Union negotiators reached a deal to establish a green bond standard, giving investors long-awaited clarity that their money is aligned with the region’s climate ambitions. A key aspect of the agreement is the legal onus it places on issuers to meet the green promises they make. If a bond doesn’t manage to fulfill its commitments under the standard, its issuer will be liable for any damages suffered by investors through the EU’s prospectus regulation. The long-awaited deal has been plagued by disagreements over how strict the rulebook needs to be and whether all issuers marketing green bonds in Europe should be required to comply. - EU Strikes Landmark Deal to Fight Greenwashing in Bond Market - Bloomberg

Asian Tigers 2.0:
Rebounding: Asia’s manufacturing activity showed signs of revival as China’s reopening provided a lift to the sluggish global economy, although a divergence continued to widen in the region’s factories in February, with Southeast Asia’s more domestically-driven economies forging on ahead with their expansion and North Asia’s export-oriented hubs lagging, data from S&P Global manufacturing purchasing managers’ indexes showed Wednesday. Thailand posted the region’s best PMI reading of 54.8 last month as it ramped up manufacturing production and output. Vietnam’s gauge jumped sharply to 51.2 from 47.4 in January, crossing the 50-mark that separates expansion from contraction. Philippines, Indonesia, and Myanmar likewise posted positive PMI prints, coinciding with China’s manufacturing activity recording the highest monthly improvement in over a decade. - Asia’s Factories Gather Some Speed on China Reopening Boost - Bloomberg

Cold Places (Deep Sea, Artic, and Space Colonization):
Save the Ocean Planet: Manufacturing enough electric vehicles to replace their fossil-fueled counterparts will require billions of tons of cobalt, lithium, copper, and other metals, causing miners to scour the earth further. What might be the richest source of all, the ocean floor, remains untapped. The U.S. Geological Survey estimates that 21 billion tons of polymetallic nodules lie in a single region of the Pacific, containing more of some metals (such as nickel and cobalt) than can be found in all the world’s dryland deposits. However, international law prohibits deep-ocean mining, but this may be changing. As a result, environmental interests are also mobilizing to try and stop deep-ocean exploration. In general, the game is afoot. - The Mining Industry’s Next Frontier Is Deep, Deep Under the Sea - Wired

VIEWS EXPRESSED IN "CONTENT" ON THIS WEBSITE OR POSTED IN SOCIAL MEDIA AND OTHER PLATFORMS (COLLECTIVELY, "CONTENT DISTRIBUTION OUTLETS") ARE MY OWN. THE POSTS ARE NOT DIRECTED TO ANY INVESTORS OR POTENTIAL INVESTORS, AND DO NOT CONSTITUTE AN OFFER TO SELL -- OR A SOLICITATION OF AN OFFER TO BUY -- ANY SECURITIES, AND MAY NOT BE USED OR RELIED UPON IN EVALUATING THE MERITS OF ANY INVESTMENT.
THE CONTENT SHOULD NOT BE CONSTRUED AS OR RELIED UPON IN ANY MANNER AS INVESTMENT, LEGAL, TAX, OR OTHER ADVICE. YOU SHOULD CONSULT YOUR OWN ADVISERS AS TO LEGAL, BUSINESS, TAX, AND OTHER RELATED MATTERS CONCERNING ANY INVESTMENT. ANY PROJECTIONS, ESTIMATES, FORECASTS, TARGETS, PROSPECTS AND/OR OPINIONS EXPRESSED IN THESE MATERIALS ARE SUBJECT TO CHANGE WITHOUT NOTICE AND MAY DIFFER OR BE CONTRARY TO OPINIONS EXPRESSED BY OTHERS. ANY CHARTS PROVIDED HERE ARE FOR INFORMATIONAL PURPOSES ONLY, AND SHOULD NOT BE RELIED UPON WHEN MAKING ANY INVESTMENT DECISION. CERTAIN INFORMATION CONTAINED IN HERE HAS BEEN OBTAINED FROM THIRD-PARTY SOURCES. WHILE TAKEN FROM SOURCES BELIEVED TO BE RELIABLE, I HAVE NOT INDEPENDENTLY VERIFIED SUCH INFORMATION AND MAKES NO REPRESENTATIONS ABOUT THE ENDURING ACCURACY OF THE INFORMATION