


Is the Greatly Expected Slowdown Finally Here? And Will Markets Continue to Look Through It? – Midday Macro - 5/12/2023
Color on Markets, Economy, Policy, and Geopolitics

Is the Greatly Expected Slowdown Finally Here? And Will Markets Continue to Look Through It? – Midday Macro - 5/12/2023
Daily/Weekly Price Action and Headlines:
Equities are lower on the day and week, with today’s weaker-than-expected consumer confidence reading moving the S&P back to the middle of its April-May range as mixed inflation data and Fed rhetoric kept alive the possibility of a June rate hike
Treasuries are lower on the day and week, as weaker consumer confidence came with higher inflation expectations, and when coupled with hawkish Fed posturing, negated the more risk-off tone, moving two-year Treasury yields back to 4%
Oil is lower on the day and week, with Wednesday’s EIA data showing crude inventories rising by about 3 million barrels in the latest week, duplicating a similar increase in Tuesday’s API data, while OPEC raised its forecast for Chinese oil demand growth this year but left its global growth projection unchanged at 2.3%

Market’s Weekly Narrative:
Equities are ending the week on a more negative note, with the S&P near the middle of its post-April range as consumer confidence readings out of the University of Michigan showed a sharp deterioration likely due to the ongoing debt ceiling saga while longer-term inflation expectation rose. The inflationary data on the week, which included CPI, PPI, Import/Export prices, and a few tertiary private reports, gave a mixed message and when coupled with the stronger-than-expected jobs report last Friday, albeit with negative revisions to prior months, left the possibility of a June rate hike alive and well. This was made clearer by the large number of Fed speakers who delivered an increasingly varied take on our current situation, although generally coming across as hawkish, indicating a lively debate was coming at the June FOMC meeting if the data does not materially weaken by then. Large-Cap growth again outperformed on the week, with more cyclical sectors and financials underperforming due to growth worries regarding China and renewed pressure on regional bank equities. Treasuries ended the week little changed despite rallying post-CPI due to the more hawkish rhetoric from Fed officials towards the end of the week, with the ten-year yield now at 3.5%. WTI oil saw its recent relief rally bounce back to the mid-70s fade into the week’s end due to higher inventory levels and renewed growth concerns, while it seems Russia is producing/selling more oil than ever. Copper also took a notable leg lower in price over concerns regarding China as lending/credit and inflation data there came in much weaker than expected. The agg complex saw the core grains and beans unchanged to slightly weaker while peripheral things like sugar and cocoa are surging in price. Finally, the dollar was higher on the week, with the $DXY closer to 103 again, helped by the more hawkish Fed messaging and backup in yields towards the end of the week.
Deeper Dive:
Is the greatly awaited economic slowdown finally here? It’s increasingly looking like the economy is entering the next stage of the cycle, a period of below trend, if not outright contractionary growth, despite the strong level of private domestic sales in Q1 and still generally tight labor market readings. This week’s initial claims data again increased (although it looks like the outsized increase in Massachusetts was due to fraud), and when combined with other labor market data, such as revisions lower to the prior month’s NFPs totals, falling job openings, continued layoff announcements, and more neutral to negative employment intention readings in various business surveys, it is clear firms are becoming more cautious/defensive regarding headcount. Coupling this with broadly weakening capex intentions, the needed loss of momentum in the economy to move supply and demand (of goods, services, and labor) to a more price-stable level is occurring.

*Higher trending weekly claims are signaling labor markets are finally materially loosening

“Bank of America’s spending data suggests some deterioration at the higher end of the income distribution. Unemployment is rising fastest amongst higher-income households, while their pay growth is weakest.”
Unfortunately, we live in a world of lags. There are lags in how quickly the data picks up changes in economic activity and lags in how quickly policymakers understand these changes occurring and adjust policy accordingly. Of course, the biggest lag is how long the changes to policy affect the real economy, a period of time that varies for every economic actor/unit depending on their policy change/level of sensitivity. Unfortunately, the majority of Fed officials did not see enough “loss of momentum” in last week’s labor data, especially regarding wage growth and this week’s inflationary readings, to allow them to change their message this week. This comes at the same time that credit conditions continue to tighten, a trend that started last summer but has become increasingly in focus due to recent bank failures, adding to the economy's headwinds and increasing the general uncertainty regarding overall growth and where Fed policy is going. As a result, we remain very much in the same place we have been in for some time now. The economy is cooling, not crashing, but uncertainty remains high, which in itself is creating a negative feedback loop that is increasingly spreading. Inflation continues to be too high, and although some progress was made in April at the supercore level, too sticky. This is due to a resilient consumer, supported by a still solid balance sheet and tight labor market.

*This week’s NFIB Small Business Survey showed firms continue to expect to reduce compensation despite still having historically high openings that are hard to fill

*Small businesses also reduced their price increase plans as weaker demand and falling input costs reduce the ability/need to do so
This consumer strength looks set to change quickly, especially if you think labor markets will loosen quickly over the summer just as excess savings finally run down, but Fed officials worried about the loss of credibility due to their initial policy errors in tightening too slowly are still primarily focused on price stability, although they now see policy in restrictive territory and, due to recent financial instability, are more two-sided in their risk assessment of any further tightening, likely indicating we are at or near the terminal rate. We recap this all because there is a high risk of further policy errors. Mistakes beget mistakes, and the over-stimulative fiscal and monetary policy response to the pandemic is now inducing an overtightening of policy counter-reaction from Fed policymakers that still grapple with understanding the true effects of the exogenous shock that occurred to the system and the resulting supply-side cost-push driven inflationary pulse.

*Median and Trimmed-Mean CPI readings show that monthly increases in those indexes are falling, albeit still at historically high levels of gains

“The Fed has keyed on services ex rent as their core indicator of inflation. Here the news is good: 0.8% 3M %CH SAAR .. decelerating since mid-2022 from its 11.6% peak and now puts the funds rate firmly into ‘restrictive’ territory” - @TS_Lombard

“The breadth of inflation is narrowing. This series can bounce around from month to month, but on a trend basis, the worst seems to be past.”
The uncertainty over the lag effects of the cumulative amount of policy tightening, reaching the real economy through the combination of tighter traditional bank credit conditions, tighter market-derived financial conditions, and higher real rates, all of which began moving well before actual rate hikes due to forward guidance, means that a greater level of caution is warranted. Yet most of this week’s Fed speaker still seems to be reading the tea leaves incorrectly. This skews our outlook for growth more negatively as we continue to see enough progress on the inflation front to allow for a more neutral posture by the Fed. Instead, we see the continued focus on backward-looking analysis using problematic data instead of trying to “skate to where the puck is going.” As a result, we are also reducing risk by taking profit on our Nasdaq long at today’s open. We benefited from the recent outperformance in growth and want to lock in the gains, sticking with our stay-tactical mantra. We continue to believe that the value that small caps offer is fair even with a coming below-trend period of growth and expect a tactical short-covering rally. This has yet to occur due to continued regional banking concerns, but we don’t see a systemic financial instability issue there despite growing worries regarding commercial real estate holdings. Instead, we see a notable discount in small caps to large caps that need to return to more normal levels.
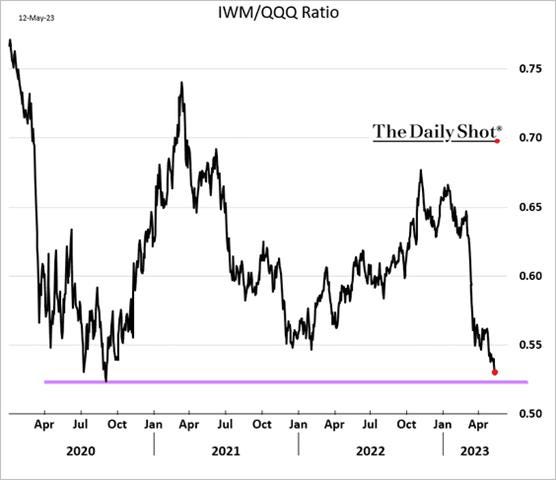
*Our small-cap long is predicated on a belief that the discount they are experiencing to large-caps will normalize

*Price-to-Book ratios show financials are generally cheap. Of course, book values are generally not discounted enough for most
Finally, regarding the rest of our portfolio holdings, recent weakness in copper and oil is attributable to worries that China’s strong Q1 growth rate is fading. We are less worried about Chinese growth and don’t see falling inflationary reading there this week or weaker exports as problematic. Instead, China’s growth engine is being driven by domestic consumers, who are flush with savings and whose confidence is growing due to an improving labor market outlook. Chinese consumers have historically used high levels of savings to purchase big-ticket items such as homes or automobiles. We expect this time to be no different. As a result, we believe industrial metals and energy markets are oversold on Chinese growth concerns, and property markets will improve in the second half of this year. Further, global inventories will need to be restocked at some point later this year as pandemic-driven excesses have been drawn down to more normal levels, likely supporting China's manufacturing sector moving forward. There is significantly more to say regarding China, but for now, we maintain our longs in oil, copper, and EM equities as a play on China’s growth level, maintaining a more positive than expected momentum level for some time, helped further by incremental policy adjustments and an improving credit pulse, despite recent loan growth weakness.

*Improvements seen in Chinese hiring surveys in Q1 point to accelerating household income growth later this year, which could support greater consumption, according to Gavekal

*But if labor markets recover, real disposable income will grow further, supporting the property sector due to better affordability
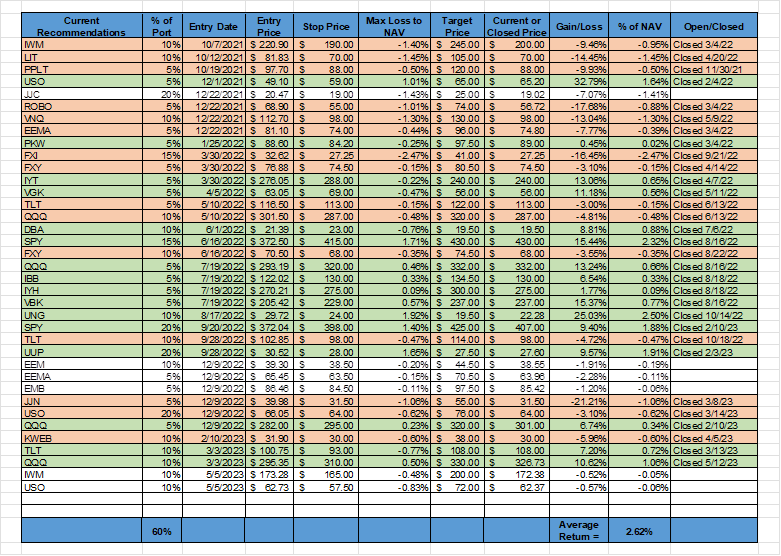
*Due to weakness in copper and other holdings, our average return moved lower to 2.62%
In addition to our usual “Deeper Dive” section writing, we wanted to highlight some quotes from recent earnings calls that focus on commercial real estate, something we see as a growing problem for financial markets and the economy, as well as selective consumer strength and general inflation comments from Q1 earnings calls. We want to show the current two-sided nature of the economy and business performance, with clear winners and losers developing. We subscribe to The Transcript on Substack and highly recommend them. Although it is essential to read earnings calls, there is only so much time in the day, and these guys do a good job highlighting key takeaways throughout the earnings release season from all industries.
The problems in commercial real estate are just beginning as a maturity wall and refinancing needs begin to hit while buying interest is still weak:
"The combination of rising interest rates and the recent banking sector challenges has impacted debt availability across the commercial real estate industry and, in particular, the office sector. We anticipate that these challenging conditions will continue for smaller and regional banks that have been important capital providers to the commercial real estate industry." - City Office REIT ($CIO) CEO James Farrar
"The federal government makes no mistake is leaning across all the banks, big and small, and saying reduce your exposure to the Office segment. I don’t know what they think is going to happen to a $3 trillion asset class, but it will take down the banks... When you look at the regional mix, we’re marking their securities to market and seeing that they are virtually insolvent… So it is a serious situation that I hope will improve as the Fed realizes what it’s doing." - Starwood Property Trust ($STWD) CEO Barry Sternlicht
"Office, obviously, is getting a lot of attention in the world, and we've been focused on it for quite some time. When we go through it and we look at what we think the loss content is, it's a little bit tricky to estimate right now only because there haven't been a lot of asset sales. I think in talking to our team prior to the call. They suggested that there were four properties that sold nationwide outside of Manhattan and three in Manhattan in the first quarter. So that's not a lot of activity to get a market price." - M&T Bank ($MTB ) CFO Darren King

The consumer prioritized leisure and hospitality as well as luxury goods despite reduced demand and greater price sensitivity elsewhere:
"After a very strong wave season, our cumulative book position for the balance of 2023 remains ahead of 2019's record performance and at higher prices. Demand and pricing continue to be strong, not only for 2023 but also as we look further out the sailings in 2024 and beyond." - Norwegian Cruise Line ($NCLH) CEO Harry Sommer
"Our order book already extends into 2025 on the back of continued strong demand. We have just opened the order collection for the newly launched Ferrari Roma Spider. And today, we are also pleased to announce the long-awaited reopening for the Purosangue with deliveries due in 2026" - Ferrari NV ($RACE) CEO Benedetto Vigna
"They may be pulling back in other areas ... but I don’t see it in our credit card data, I don’t see it in our bookings." - Delta Air Lines ($DAL ) CEO Ed Bastian

Firms generally indicated they believed the worst of inflation was over and were becoming more sensitive to price increases as well as more cautious when it comes to price increases to end consumers:
“Pricing growth in the first quarter was above our expected annual rate, and we expect the rate of increase to slow as we hurdle our 2022 price increases later this year" - Coca-Cola Bottling ($COKE) CEO Dave Katz
"Certainly, it's moderated some Brian. But it's certainly not back to where it was before the inflationary trend started...certainly, inflation is one of those characteristics that's been a bit stubborn." - Constellation Brands ($STZ ) CEO Bill Newlands
"So in terms of overall price increases, we believe we're through most of the significant price increases." - WD-40 ($WDFC ) COO Steven Brass

Policy Talk:
There were a lot of Fed officials giving prepared remarks or interviews with financial media this week. To keep things somewhat concise, we only highlighted speeches by Williams, Waller, and Bowman as we felt they gave a good spread of where various dovish and hawkish members are today.
NY Fed President Williams gave prepared remarks titled “This is the Way” at the Economic Club of New York, playing on the popularity of the recent Mandalorian show. He immediately highlighted that he believed overall demand still exceeded supply, maintaining the “too high” level of inflation. He went on to discuss labor markets, saying there had been some improvement in the supply and demand balance there. However, he noted it was still historically tight and facing demographic headwinds as “baby boomers” retired, and net immigration was not fully filling that gap. Moving on to inflation, Williams highlighted that inflation expectations still remained well-anchored and that supply-side improvements and price drops in more interest-rate-sensitive areas were positive developments. He also noted that shelter costs were beginning to come down, an important development given its weight in overall inflation readings. He ended his speech by recapping the recent Fed policy decision and reaffirming his view that inflation would fall towards 3.25% by year-end while growth would weaken and then pick up next year.
“Supply chains, which were severely constrained after the pandemic's onset, have improved considerably. This is something I hear from business leaders from across the Federal Reserve's Second District. And the New York Fed's Global Supply Chain Pressure Index has declined to a level that indicates supply chain pressures are now actually somewhat lower than normal.”
“Because of the lag between policy actions and their effects, it will take time for the FOMC's actions to restore balance to the economy and return inflation to our 2 percent target. I expect inflation to decline to around 3-1/4 percent this year before returning to our longer-run goal of 2 percent over the next two years.”

Governor Waller gave prepared remarks titled “Climate Change and Financial Stability” at the IE University in Madrid as part of St. Louis Fed’s Conference on Current Challenges in Economics and Finance, where he declared climate change was real but did not pose a serious risk to financial stability. He highlighted that the risks to financial stability have a couple of features; they have relatively near-term effects and must be material enough to create losses large enough to affect the real economy. He highlighted that the Fed monitors “broad groups of vulnerabilities, such as overvalued assets, liquidity risk in the financial system, and the amount of debt held by households and businesses, including banks.” This means that they are agnostic to the particular sources of shocks that may hit the economy at any point in time and instead focused on building a resilient financial system to the range of risks out there. He went on to identify the type of financial risks climate change brings, separating them into two groups; physical risks and transition risks. Waller noted that physical risks include higher frequency and severity of acute weather events, such as fires, heatwaves, and hurricanes, as well as slower-moving events like rising sea levels. Transition risks are associated with an economy and society transitioning to one that produces fewer greenhouse gases. Regulators need to look at whether these risks could result in losses for individuals or companies and whether these risks are unique enough to merit special treatment in our financial stability framework. Under the two-risk framework, he again reaffirmed he does not see climate change as warranting a unique regulatory approach by the Fed.
“My job is to make sure that the financial system is resilient to a range of risks. And I believe risks posed by climate change are not sufficiently unique or material to merit special treatment relative to others.”
“We identify risks and prioritize resources around those that are most threatening to the U.S. financial system. We distinguish between shocks, which are inherently difficult to predict, and vulnerabilities of the financial system, which can be monitored through the ebb and flow of the economic cycle.”

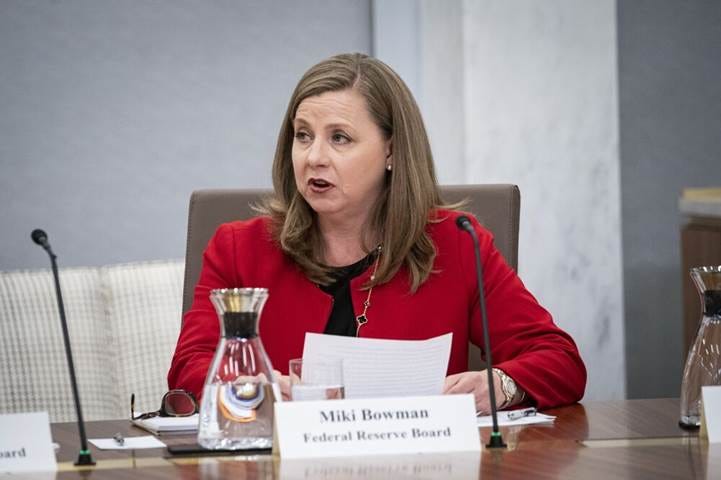
Governor Bowman gave prepared remarks titled “The Evolving Nature of Banking, Bank Culture, and Bank Runs” at the 21st Annual Symposium on Building the Financial System of the 21st Century in Frankfurt, Germany. Although the speech was focused on how banking has evolved and how risks have changed, Bowman did give some thoughts on the current stance of monetary policy. She noted that policy was now restrictive, but whether it was restrictive enough to bring inflation back to target remained uncertain. She expects the recent turmoil in the banking sector to further credit tightening, something she noted started last summer. She indicated she might favor further tightening and certainly believed the restrictive policy stance would be warranted for some time, given that the most recent CPI and employment report did not reassure her that inflation is on a downward path. She then focused on the recent bank failures and discussed how changes to supervision, regulation, bank management culture, and technology will force the Fed to take new approaches to “building a stronger and more resilient financial system.” After reviewing changes to the various parts of the industry, Bowman suggested three things to improve the system. First, the Fed should use an independent third party to prepare a report on the failure of SVB to hold itself responsible fully. She then called for a quicker response and a more focused mission by examiners, saying, “we have the tools to address these issues (concentration risk, liquidity risk, and interest rate risk), but we need to ensure that examiners focus on these core risks and are not distracted by novel activity or concepts.” Finally, she thinks the Fed should consider whether there are needed adjustments to regulation, such as taking a close look at deposit insurance reform, the treatment of uninsured deposits, and a reconsideration of current deposit insurance limits. She did not endorse sweeping regulatory changes, seeing the recent bank failures as more isolated incidents versus a systemic problem needing a major regulatory overhaul.
“In my view, our policy stance is now restrictive, but whether it is sufficiently restrictive to bring inflation down remains uncertain. Some signs of slowing in aggregate demand, lower numbers of job openings, and more modest gross domestic product (GDP) growth indicate that we have moved into restrictive territory. But inflation remains much too high, and measures of core inflation have remained persistently elevated, with declining unemployment and ongoing wage growth.”
“In my view, the most recent CPI and employment reports have not provided consistent evidence that inflation is on a downward path, and I will continue to closely monitor the incoming data as I consider the appropriate stance of monetary policy going into our June meeting.”
“The unique nature and business models of the banks that recently failed, in my view, do not justify imposing new, overly complex regulatory and supervisory expectations on a broad range of banks. If we allow this to occur, we will end up with a system of significantly fewer banks serving significantly fewer customers. Those who will likely bear the burden of this new banking system are those at the lower end of the economic spectrum, both individuals and businesses.”
The April Senior Loan Officer Opinion Survey (SLOOS) showed, on balance, tighter standards and weaker demand for loans across all categories accepted credit cards, which saw no change in demand. The net percentage of U.S. banks tightening loan standards for large- and medium-sized businesses advanced to 46% in Q1 from 44.8% in the prior quarter, while the proportion of banks tightening loan standards for small businesses rose to 46.7% from 43.8% in Q4 2022. Banks reported tighter standards and weaker demand for all commercial and industrial (C&I) and commercial real estate (CRE) loan categories. Demand for these types of loans was much weaker as the proportion of banks reporting stronger demand for C&I loans from large- and medium-sized firms plummeted by 55.6%, marking the biggest slump since 2009, and compared with a 31.3% decline in Q4 2022. Banks reported that lending standards tightened across all categories of residential real estate (RRE) loans to households other than government-sponsored enterprise (GSE)-eligible and government residential mortgages, which remained basically unchanged. Demand weakened for all RRE loan categories. In addition, banks reported tighter standards and weaker demand for home equity lines of credit (HELOCs). Standards tightened for all consumer loan categories; demand weakened for auto and other consumer loans, while it remained basically unchanged for credit cards.
Why it Matters: As expected, the trend of tighter lending standards continued in Q1. Demand is also falling for credit in all categories except for credit cards. The April SLOOS included three special questions, which inquired about banks' changes in lending policies for CRE loans over the past year, why banks changed standards for all loan categories over the first quarter, and about banks' expectations for changes in lending standards over the remainder of 2023 and reasons for these changes. Banks, on balance, reported tightening lending policies for all categories of CRE loans over the past year, with the most frequently reported changes pertaining to wider spreads of loan rates over banks' cost of funds and lower loan-to-value ratios. Regarding the second special question, banks cited a less favorable or more uncertain economic outlook, reduced tolerance for risk, deterioration in collateral values, and concerns about banks' funding costs and liquidity positions. Finally, regarding the last special questions, banks reported expecting to tighten standards across all loan categories to continue throughout the year. Banks most frequently cited an expected deterioration in the credit quality of their loan portfolios and in customers' collateral values, a reduction in risk tolerance, and concerns about bank funding costs, bank liquidity position, and deposit outflows as reasons for expecting to tighten lending standards over the rest of 2023.

*Firms of all sizes are increasingly seeing a tightening in credit standards by banks

*Consumer lending standards are becoming increasingly tighter for auto, credit card, and other consumer loans

*Demand weakened for auto and other consumer loans, while it remained basically unchanged for credit cards in April
The Atlanta Fed’s Business Inflation Expectation Index remained relatively unchanged at 2.9% in May. Firms reported that sales levels "compared to normal" decreased on the month; however, firms' profit margins "compared to normal" increased. Year-over-year unit cost growth remained relatively unchanged at 3.5%. The quarterly question showed that approximately 75% of firms expect both labor and nonlabor cost increases to place upward pressure on prices. About 53% of firms expect sales levels to exert little or no influence on prices, while 50% expect margin adjustment to have little or no influence on prices over the next 12 months.

*One-year-ahead business inflation expectations are still slowly trending lower, despite a slight uptick in May back to 2.9%

*Sales activity dropped again after rebounding in April
The San Francisco Fed’s Blog, the FRBSF Economic Letter, released a post titled “The Rise and Fall of Pandemic Excess Savings” by Hamza Abdelrahman and Luiz E. Oliveira. It examines household saving patterns since the onset of the pandemic and how they compare with previous recessions. They show that households rapidly accumulated unprecedented levels of excess savings (defined as the difference between actual savings and the pre-recession trend) relative to previous recessions. Moreover, despite a rapid drawdown of savings in recent months, there is still a large stock of aggregate excess savings in the economy, some $500 billion. The distribution and allocation of excess savings and wealth across the income distribution suggest that households on average, including those at the lower end of the distribution, continue to have considerably more liquid funds at their disposal compared with the pre-pandemic period. They predict that these excess savings could continue to support consumer spending until the fourth quarter of 2023. However, they state this outlook is uncertain depending on whether households have developed a preference for higher savings, significantly shifted their spending patterns, or substituted other sources of income for the expired pandemic-era cash inflows.

*After August 2021, aggregate personal savings dipped below the pre-pandemic trend, signaling an overall drawdown of pandemic-related excess savings

*The rapid accumulation and subsequent drawdown of excess savings following the onset of the pandemic recession contrasts sharply with the gradual increase in excess savings observed in past recessions
The NY Fed’s Liberty Street Blog recently posted about the importance of understanding the distribution and composition of funding across the banking industry, something of particular importance these days due to recent financial instability. In their post title, “Bank Funding during the Current Monetary Policy Tightening Cycle,” authors Luck, Plosser, and Younger describe changes in bank funding structure since the onset of the monetary policy tightening cycle, with a particular focus on developments through March 2023. In summary, the banking system has seen a considerable decline in deposit funding since the start of the current tightening cycle in March 2022. The speed of deposit outflows increased during March 2023, following the run on SVB, with the most acute outflows concentrated in a relatively narrow segment of the banking system, super-regional banks (those with $50 to $250 billion in total assets). Notably, deposit funding amongst the cohort often referred to as a community or smaller regional banks (that is, institutions with less than $50 billion in assets) were relatively stable by comparison. Large banks (those with more than $250 billion in assets), which had been subject to the largest deposit outflows before March 2023, received deposit inflows throughout March 2023. Throughout, banks were able to replace deposit outflows by making use of alternative funding sources.
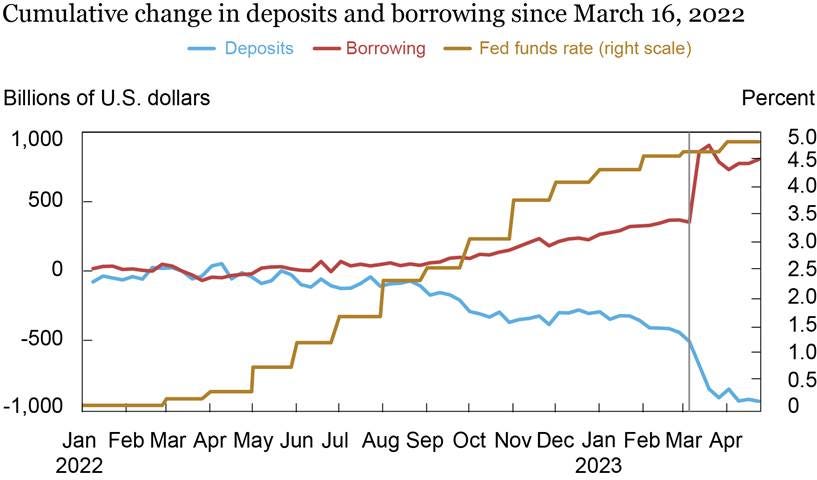
*The chart above reveals that deposit funding gradually declined by around $500 billion over the year ending in early March 2023 as the fed funds target rate rose

*Large banks increased borrowing the most, which is in line with deposit outflows being strongest for larger banks before March 2023.
Econ Data:
The headline Consumer Price Inflation Index rose by 0.4% MoM in April after rising by 0.1% in March and matching market expectations. This moved the annual headline rate to 4.9%, the lowest since April 2021, and below market forecasts of 5%. The core CPI rate rose by 0.4% MoM in April, unchanged from the previous month and in line with market expectations. The annual core CPI rate ticked down to 5.5%, as expected, from 5.6% in the prior month. The most significant upward contribution (by weight) came from the cost of shelter (0.4% MoM), used cars and trucks (4.4% MoM), and gasoline (3% MoM). Meanwhile, food prices were flat, while costs fell for natural gas (-4.9% MoM), airline fares (-2.6% MoM), and new vehicles (-0.2% MoM).
Why it Matters: April’s inflation report can be interpreted positively or negatively, depending on your bias. Used cars and gasoline were responsible for over half of the m/m increase in CPI. However, new cars declined for the first time since Apr 2021, while airfare fell for the first time since January. Core service inflation, excluding shelter, rose by only 0.1% MoM in April, an initial sign that the stickiness there may be slowly coming undone. However, the stickiest part of that, which is also highly tied to wages, core services less shelter, health insurance, and airfares, actually had its strongest monthly gain of the year at 0.5% MoM, indicating a further entrenchment of inflation in the “core of the core.” However, 40% of the CPI basket (by weight) is in outright deflation. And while housing and food are not ‘deflating’ in the official data yet, real-time measures show this is occurring, adding another 50% or so when their real-to-official lag further fades, which will increasingly occur moving forward. The Cleveland Fed’s Median and Trimmed Mean rose 0.4% MoM and 0.3% MoM, unchanged and slightly higher than last month, resulting in a topping annual rate but no notable deceleration to give policymakers comfort. It is our view that progress is being made, and when thinking about where the puck is going, future months should see a broadening of deflationary components. We expect transportation and shelter price declines to occur increasingly, weighing on core CPI. At the same time, weaker commodity prices, lower logistical costs, as well as drops in big-ticket item demand should weigh on the headline CPI as well as the cost of goods. Finally, the rise in used cars, which drove the cost of goods higher in April, has already reversed in May; however, there looks to be a two-month lag between the Manheim Index and official CPI readings, again making the official data a lagged indicator of the real on the ground price changes.

*Headline CPI saw a large monthly increase due to the rise in gasoline and used car prices, while the monthly core CPI rate increases, although still historically high, looks to be trending lower slowly

*Transportation costs fell due to drops in airline fares, helping the “supercore” measure of CPI fall further

*Shelter costs rose slightly in April from March but are expected to trend lower over the summer

*There is some slow progress occurring with CPI components over 4% trending lower, but clearly, too high a percentage of components are elevated on an annual basis

*Consumer stress looks to be easing with an average of utility, gasoline, food at home, and electricity costs falling to a near 0% annual change

*There has been little progress in Median and Trimmed-Mean CPI Indexes falling, although a growing percentage of CPI components are seeing price declines
Producer prices increased by 0.2% MoM in April, following a downwardly revised -0.4% drop in March and compared to market forecasts of a 0.3% rise. The annual PPI rate moved to 2.3%, the lowest since January 2021, and below forecasts of 2.4%. Food prices fell by -0.5% MoM, while energy prices increased by 0.8% MoM. Core PPI increased by 0.2% in April, matching market estimates, after a revised flat reading in the prior month. This moved the Core PPI annual rate to 3.2%, the lowest since March 2021 and below market expectations of 3.3%. Overall finished goods PPI prices rose by 0.5% MoM in April, while the core finished goods PPI rose 0.1% MoM, putting the annual core finished goods PPI inflation rate at 5.4% versus 6.4% in March. Intermediate processed goods prices fell by -0.4% MoM in April but were up 0.3% MoM, excluding food and energy. Unprocessed goods prices rose 1.7% MoM and were up 1.8% MoM, excluding food and energy. Over the last year, core intermediate processed goods prices are down by -1.1%, while core unprocessed goods prices have declined by -14.0% on the same basis.
Why it Matters: Despite the continued trend lower in annual headline readings, which are now lower for ten months, three-month PPI inflation rates for pipeline prices have picked up. April saw broad increases in final and intermediate demand costs, with both final demand measures for goods and services moving back into positive monthly gains after lower to flat gains in the prior two months. At the same time, unprocessed goods moved higher after significant declines in March and February, while processed fell at a slower monthly rate than the prior two months. The bottom line is, despite April’s headline monthly and annual rate coming in lower than expected, underlying readings showed some firming of cost pressures. Monthly increases a year ago were still ramping up into the summer at a high rate, so the comparison will continue to drive the annual rate lower for a few months more, keeping the trend lower in the annual reading intact, but deflationary momentum has stalled following the declines seen in the last two months.

*Headline PPI came in slightly weaker than expected, although there were broad increases in April following a particularly weak March and February period

*Again, the majority of components increased in April, with increases in final demand for energy and services the most significant contributors to headline gains

*We believe that PPI deflationary pressures will continue to pressure CPI lower
Import prices increased 0.4% MoM in April, the first rise in four months and the biggest since May, compared to forecasts of a 0.3% MoM gain. Year-on-year, import prices are down -4.8%, the same as in March. Prices for imported fuel rose by 4.5% MoM, the first monthly increase since June 2022, with higher petroleum cost (5.7% MoM) more than offsetting lower prices for natural gas (-17.4% MoM). Meanwhile, the cost for nonfuel imports was unchanged after a -0.5% MoM fall in March. Higher prices for consumer goods (0.2% MoM) and foods, feeds, and beverages (0.2% MoM) offset price decreases for nonfuel industrial supplies and materials (-0.2% MoM) and capital goods (-0.1% MoM). Automotive vehicle import prices were unchanged for the month. Export prices rose by 0.2% MoM in April, in line with market expectations and rebounding from the upwardly revised -0.6% MoM decrease in March. Export prices are now -5.9% lower annually, the largest decline since a -6.7% drop in May 2020. Agricultural exports rose by 0.4% MoM, bouncing back from a -1.9% MoM drop in the previous month amid higher costs of corn, nuts, meat, and vegetables. Meanwhile, those of non-agricultural exports rose by a softer 0.2% MoM, as higher prices of non-agricultural materials, capital goods, and consumer goods outweighed lower prices for automotive vehicles.
Why it Matters: After multiple months of outright declining prices, both import and export rose in April, although gains were driven primarily by energy imports and agricultural export price increases. Excluding petroleum, import prices fell in April for the 10th time in 12 months. Price gains were also notably softer for exports outside agricultural products, and auto prices were also flat to lower for imports and exports, respectively. Imported services sowed airline fares declined by -5.4%, supporting decreases seen in the April CPI report. However, freight prices rose, bucking the slowdown in logistic demand seen elsewhere.

*Annual import prices stabilized in April due to increases in fuel costs

*Harder comparables from a year ago saw the annual level of export prices continue to decline, even with a monthly gain in April
The NFIB Small Business Optimism Index fell to 89 in April, the lowest since January of 2013, from 90.1 in March, and compared to forecasts of 89.6. Labor quality was the top business problem at 24%, with inflation in second place by one point at 23%.
The share of owners expecting better business conditions over the next six months fell two points to a net negative 49%, with a net negative 23% of firms reporting positive profit trends, five points worse than in March. Further, the percentage of owners expecting real sales to increase deteriorated by four points to a net negative 19%. Among the owners reporting lower profits, 29% blamed weaker sales, 20% blamed the rise in the cost of materials, 13% cited the usual seasonal change, and 10% cited labor costs. For owners reporting higher profits, 51% credited sales volumes, 16% cited higher prices, and 4% cited lower labor costs.
The net percent of owners raising average selling prices decreased four points to a net 33%, the lowest since March 2021. Price hikes were the most frequent in construction (59% higher, 7% lower), retail (59% higher, 8% lower), wholesale (54% higher, 14% lower), and finance (52% higher, 5% lower). Seasonally adjusted, a net 21% plan price hikes.
Turning to labor needs, a net 45% of owners reported job openings that they could not fill, up 2 points from March, and a net 40% reported raising compensation. A net 17% plan to create new jobs in the next three months, while a net 21% plan to raise compensation over that same time period.
A net negative 5% of owners viewed current inventory stocks as “too low” in April, down six points from March, suggesting inventory stocks are too large relative to expected sales. As a result, the net percent of owners reporting inventory increases declined six points to a net negative 7%. Eighteen percent of owners recently reported that supply chain disruptions still have a significant impact on their business. By industry, material/inventory shortages are the most frequent in manufacturing (10%), agriculture (9%), retail (9%), and wholesale (8%). Shortages in construction (6%) have been reduced because home sales have slowed dramatically due to higher interest rates.
Fifty-six percent of owners reported capital outlays in the last six months, down one point from March. Of those making expenditures, 40% reported spending on new equipment, 23% acquired vehicles, and 11% spent money on new fixtures and furniture. Nineteen percent of owners plan capital outlays in the next few months, down one point from March and historically very weak.
Why it Matters: April’s decline marks the 16th consecutive month below the survey’s 49-year historical average of 98 and remains in an area indicating a recession. “Optimism is not improving on Main Street as more owners struggle with finding qualified workers for their open positions,” said NFIB Chief Economist Bill Dunkelberg. “Inflation remains a top concern for small businesses but is showing signs of easing.” Interestingly there was no increase in owner’s reporting problems with borrowing needs, likely due to still low demand, with measures of credit availability improving. In summary, regarding what Fed officials would be looking at, the report pointed to continued labor market tightness, while the share of firms raising average selling prices fell in April.

*The headline NFIB Small Business Optimism Index is at new recent lows

*Sales expectations fell again after a recent rebound, while pricing plans continue to fall, now back in a more historically normal level

*Job openings are still being reported as hard to fill. However, compensation plans continue to fall, showing less urgency in hiring intentions
The University of Michigan Consumer Sentiment Index fell to 57.7 in May from 63.5 in April, well below expectations of 63. The Expectations Sub-Index declined to 53.4 from 60.5, and the Current Economic Conditions Sub-Index fell to 64.5 from 68.2. Year-ahead inflation expectations receded slightly to 4.5% from 4.6% in April. On the other hand, the five-year outlook increased to 3.2%, the highest since 2011, compared to 3% last month.
Why it Matters: The overall index fell -9% in May to a six-month low, erasing over half of the gains achieved after the all-time historical low from last June. Year-ahead expectations for the economy plummeted 23% from last month. Long-run expectations slid by 16% as well, indicating that consumers are worried that any economic downturn will not be brief. "While current incoming macroeconomic data show no sign of recession, consumers’ worries about the economy escalated in May alongside the proliferation of negative news about the economy, including the debt crisis standoff," said Joanne Hsu, Surveys of Consumers Director. Further, history has shown that debt ceiling standoffs have weighed heavily on consumer confidence, something increasingly happening now, so expect the final reading to likely not reverse losses if there is no resolution. We also continue to see a notable difference between Republicans, whose views are more negative and inflation expectations higher, and Democrats and Independents. We wonder if the loss of Tucker from Fox News weighed heavily on Republican respondents' hearts and minds, causing a more negative response this month.
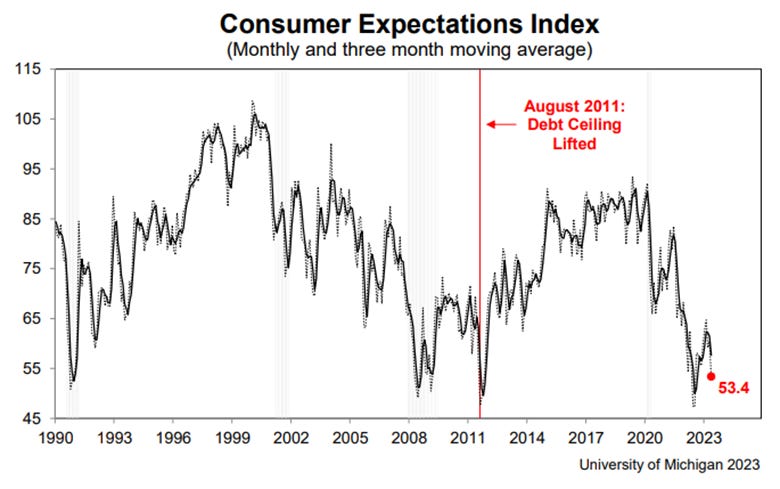
*The last debt ceiling standoff drove expectations to lows only seen during the GFC, this time will likely be similar

*Inflation expectations have picked up recently, likely due to increased prices at the pump and persistent stickiness elsewhere

*Sentiment from Republicans has been on a steady downward trajectory since the Pandemic started

*Republican respondents also have materially higher inflation expectations than Democrats, but Independent voters seem to have the stickiest expectations
The Federal Reserve Bank of New York’s April Survey of Consumer Expectations showed inflation expectations declined for the one-year horizon to 4.4% from the previous month's 4.7%. The decrease was attributed to a softer perceived increase in costs for both college education (7.8% vs. 8.9% in March) and food (5.8% vs. 5.9%). However, expected price changes for gas increased (5.1% vs. 4.6%) but remained unchanged for the cost of medical care (9.3%) and rent (9.2%). Meanwhile, inflation expectations for the three- and five-year horizons increased by 0.1 percentage points to 2.9% and 2.6%, respectively. Labor market expectations deteriorated slightly, with unemployment expectations and perceived job loss risk increasing and job finding expectations decreasing. Perceptions and expectations of credit conditions were mixed.
Why it Matters: April’s survey indicated consumers expect inflation to fall further but remained still historically highly uncertain about that. They were also less optimistic about their job and financial situation moving forward, although only slightly. Although expected earnings growth remained unchanged, expected growth in household incomes decreased despite perceptions about households’ current financial situations improving in April, with fewer respondents reporting being worse off than a year ago. Perceptions of credit access compared to a year ago were mixed in April, with both the share of households reporting it is easier and the share reporting it is harder to obtain credit now than one year ago declining. Similarly, respondents’ views about future credit availability were mixed. Finally, in a sign views on the housing market may be stabilizing, the median home price growth expectations increased by 0.7 percentage points to 2.5% in April, the highest reading since July of last year.

*The move lower in the one-year ahead inflation outlook is a welcome sign after increases earlier this year

*Job-finding expectations may be cooling, although they remain well in their longer-term range
Technicals, Positioning, and Charts:
The S&P and Russell are outperforming the Nasdaq with Momentum, Low Volatility, and High Dividend Yield factors, as well as Utilities and Consumer Staples sectors all outperforming on the day. There was a notably more negative tone to sector performance this week despite the index still being in the middle of its recent range. Only the Communication sector was higher on the week, with the more cyclical sectors underperforming. Growth and Low Volatility factors outperformed on the week, with large-cap growth the best-performing size/factor.

@KoyfinCharts
S&P optionality strike levels have the Zero-Gamma Level at 4106 while the Call Wall is 4200 and Put Wall is 4000. Very little has changed in market dynamics over the past several days or even weeks. Volatility (both realized and implied) continues to be low, and any pop in implied vol is met with vol selling which supports equities. The big gamma pillars at 4100 & 4150 have grown in size and contained the S&P price range. The recent low in implied vol coincided with the 4200 Call Wall area, indicating an area of resistance into May’s OPEX. On the other side, a break of 4100 is "risk off," likely invoking a test of 4000 on the S&P. Because of this, Spotgamma anticipates equities may enter a "window of weakness" starting with 5/17 VIX and 5/19 regular May OPEX. Further, they believe if the Call Wall rolls higher, it opens a path to higher S&P prices, but a roll higher is not currently in play.

@spotgamma
S&P technical levels have support at 4110, then 4080, with resistance at 4145, then 4180. The S&P remains in dip-buying regime and is now at the bottom of its megaphone pattern, an area of major support. After last Thurs/Friday’s 100+ point vertical rally, the S&P has spent this entire week in consolidation mode, building out a range with 4165 or so resistance and 4115 or so support (where it is now) as market repetitively traps “bulls” and “bears.” This week has now featured four daily candles, stacked side by side each other to form one of the tightest range weeks of 2023 so far. We have been in a 1.5-month consolidation, and compression leads to expansion, and a big trend move is expected to come out of this with a slight bullish tilt due to the larger uptrend still being intact.

@AdamMancini4
Treasuries are lower, with the 10yr yield at 3.45%, higher by around 6.5 bps on the session, while the 5s30s curve is flatter by 6 bps on the session, moving to 33 bps.

Four Key Macro House Charts:
Growth/Value Ratio: Growth is higher on the day and week, with Large-Cap Growth the best-performing size/factor on the week.

Chinese Iron Ore Future Price: Iron Ore futures are lower on the day and the week.

5yr-30yr Treasury Spread: The curve is flatter on the day and the week.

EUR/JPY FX Cross: The Euro was stronger on the day but weaker on the week.

Other Charts:

Thanks to the outperformance of mega-cap tech/consumer discretionary, U.S. growth stocks have nearly reversed half of last year’s downtrend versus value stocks.

The TD Ameritrade IMX Index is curling higher, suggesting buying is coming in off historically low levels. Going back in time shows that should this continue, stocks could do well as well. - @RyanDetrick

Small caps tend to lead S&P 500 earnings both up and down, and they are signaling further weakness is coming to the S&P

Tighter credit conditions usually weigh on earnings with a one-quarter lag, signaling that for the more positive earnings outlook to occur, credit conditions will have to loosen. - @OxfordEconomics

The corporate credit market has not tightened in the same way that banks’ lending is. The divergence is historically large, and it’s hard to see how it can be sustained, but while it lasts diminishes the pressure on financial conditions.

“.. this week’s jobless claims reading .. hints at potentially more abrupt slowing. If sustained for the month of May, the %3m/3m change will have surged to 17.4% — a jump that would clearly put it in the range only seen in recessions over the past half-century.” – JP Morgan Research

“China’s PPI is a leading indicator for global inflation, and that could push U.S. producer prices towards deflation by as early as June when base effects kick in ..” - @NewEdgeWealth
Articles by Macro Themes:
Medium-term Themes:
China’s Post-Pandemic Life:
Weaker: The annual consumer inflation rate weakened to a two-year low of 0.1% in April, as food and energy costs eased, while producer prices fell to a -3.6% YoY rate, largely due to lower commodity costs. Separately, data from the People’s Bank of China showed credit and new loans were much worse than expected in April as consumers and businesses curbed their borrowing. Growth of M2, the broadest measure of money supply, moderated to 12.4% year-on-year in April, the slowest pace seen this year. The PBOC probably won’t take any immediate action, said Bruce Pang, chief economist for Greater China at Jones Lang LaSalle. There’s “less urgency for large-scale monetary easing” in the short term, he said. “Securing income growth and improving consumer confidence remain key policy priorities for delivering a more sustainable consumption recovery,” he said. - China’s Weak Inflation, Borrowing Show Economic Recovery Waning - Bloomberg


Sputter: Chinese export growth slowed in April, underlining the importance of domestic spending as the main engine for the world’s second-largest economy after three years of strict Covid-19 controls. Exports from China rose 8.5% in April compared with a year earlier, a weaker pace than the 14.8% year-over-year jump recorded in March. The data suggest China’s export engine is beginning to sputter, in line with softness in overseas sales by other key exporting nations in Asia. April exports from South Korea were -14% lower than a year earlier. Exports from Taiwan were down by an annual -13% in April, which marked an improvement from a -19% drop in March. - Chinese Exports Cool in Latest Warning Sign on Global Trade – WSJ

Longer-term Themes:
Cyber Life and Digital Rights:
AI Standard: Key European Union lawmakers agreed on changes to draft rules to rein in generative artificial intelligence, such as ChatGPT, and proposed a ban on facial surveillance, moving the EU closer to setting landmark rules for AI. Following the deal by two European Parliament committees in charge of the issue, the plenary will now vote on the draft next month, after which lawmakers will finalize details with EU countries and the European Commission. Proposed by the EU executive two years before, the AI Act aims to set the standard for AI before China and the United States, while the increasing use of the technology has spawned fears of job losses, disinformation, and copyright infringements. - EU lawmakers' committees agree tougher draft AI rules - Reuters

Energy’s Midlife Crisis:
Exceeding Expectations: NextEra Energy became a clean-energy powerhouse by investing early in wind and solar farms. Now, it is staking its growth on hydrogen, saying it sees the potential to invest more than $20 billion in so-called green hydrogen after the passage of the Inflation Reduction Act, which provides significant tax credits for such projects. There is a limited market for green hydrogen currently, and NextEra is hoping the new law, coupled with an increasing push to cut carbon emissions, will simultaneously create supply and demand. NextEra is placing its wager as it becomes increasingly challenging to develop renewable-energy projects. Federal and local permitting for such projects is time-consuming, supply-chain snarls have slowed progress, and opposition is mounting in communities around the country. - The Most Valuable U.S. Power Company Is Making a Huge Bet on Hydrogen - WSJ

Food: Security, Innovations, and Climate Change Implications:
New Norm: Home to the European Union’s only desert, Spain has experienced drought more severely and for longer than the bloc’s other major economies. Its proximity to Africa puts it squarely in the path of hot air currents as they make their way northwards from the Sahara desert. But the heat doesn’t stop in Spain; hotter and drier weather is becoming the norm across Europe. The water battle brewing in Letur is a harbinger of conflicts that will play out elsewhere, and whatever happens to Spain’s farming industry, a major source of groceries for its neighbors, will be felt throughout the region. “Spain is Europe’s breadbasket, and the lack of water there, the lack of agricultural production, is a matter of survival,” said Nathalie Hilmi, an environmental economist at Centre Scientifique de Monaco. “It becomes a financial problem too because more money needs to be spent finding food.” - Europe’s Drought-Riven Future Is Here, Decades Earlier Than Expected – Bloomberg

No Seconds: Thailand, the world’s second-biggest rice exporter, is asking farmers to grow only one crop this year instead of the usual two as a likely El Nino looks set to reduce rainfall. Rice is highly water-intensive and is dependent on irrigation and enough precipitation. It’s an early sign of how the disruptive weather pattern is threatening global food production. The resulting drop in rice output also has the potential to push up prices of a staple food for more than half the world’s population. The emerging El Nino is already contributing to severe heat that’s roasted Southeast Asia in recent weeks. The weather pattern typically results in hotter, drier conditions in many parts of Asia. As well as rice, it’s a risk to the output of crops including palm oil, cocoa, and sugar, of which Thailand is also a major producer. - El Nino May Slash Thai Rice Crop and Spur Inflation Across Asia - Bloomberg

Authoritarianism in Trouble?:
Struggling to Balance: Italian Prime Minister Giorgia Meloni reassured U.S. House Speaker Kevin McCarthy during a meeting in Rome last week that while a final decision hasn’t been taken, her government is favoring an exit from its role in China’s massive Belt and Road Initiative. Italy signed onto the infrastructure initiative in 2019, becoming the only Group of Seven countries to become part of the deal. However, now Italy, like much of Europe, has been caught between escalating tensions between Washington and Beijing, which have compounded in light of Beijing’s continued support for Russia. European countries are struggling to balance a desire to engage with China on trade and investment while pushing back against claims of economic coercion. - Italy Intends to Exit China Belt and Road Pact as Ties Sour - Bloomberg

Continuous Process: Focusing on weapons and aid overlooks the full extent of efforts to support Ukraine, with Europe having played an especially crucial role in training. In 2022, for instance, the United Kingdom trained about 10,000 Ukrainian soldiers, whereas the United States trained only about 3,100. And except for Austria, every country in the EU, and even Switzerland, has provided some form of lethal or nonlethal aid and training to the Ukrainian military since the war started. As a result, efforts to train and advise Ukraine’s military by NATO countries provided before the war helped stop Russian forces on the road to Kyiv as well as halt Russia’s offensive in the eastern part of the country. However, after more than a year of hard fighting, maintaining force quality has become a key challenge for Ukraine. Any military engaged in intense combat over a prolonged period will experience a drop in combat effectiveness as experienced soldiers are lost and replaced with fresh recruits. As a result, a continuous training process will become even more important the longer the war continues. - Ukraine’s Hidden Advantage – Foreign Affairs

Other Articles of Interest:
Rising interest rates, falling prices, and waning demand for office space following the pandemic had strained the commercial property market. But these troubles intensified after this year’s bank failures raised worries about regional banks that account for most commercial real estate loans. Guggenheim Partners CIO Anne Walsh said the pain would be concentrated in certain regions of the U.S., including large urban centers such as San Francisco and New York, as well as in second-class office buildings that are in need of repair. She noted some lenders required personal guarantees from property owners in which borrowers pledge their own assets to secure a mortgage, a signal of the tightening lending standards and the fact that banks were pulling back. A wall of debt is also scheduled for repayment in the coming years. “There’s a maturity cliff for a lot of this real estate in the next few years, a significant portion of which is funded by regional banks,” said the chief executive of a large US bank. - U.S. lenders warned that commercial property is ‘next shoe to drop’ - FT

Negative Online: Prices of goods sold online fell by -1.8% in April from the previous year and declined by -0.7% from March, according to Adobe Digital Price Index. Eleven of the 18 categories tracked saw prices decrease from the previous year. The drop for appliances, at -7.1%, was the largest in data going back to 2014. The declines were even sharper for electronics, computers, and flowers, dropping -11.6%, -15.4%, and -27%, respectively. There was one notable exception: the grocery category, which is seeing persistent inflation with a 9.3% gain from the previous year. The Adobe Digital Price Index was developed with the help of Austan Goolsbee before he became president of the Federal Reserve Bank of Chicago this year. The gauge analyzes one trillion visits to retail sites and more than 100 million items to track price changes. - Online Prices in the US Fall for Eighth Consecutive Month in Adobe Data – Bloomberg

Less Going Out: Chinese outbound foreign direct investment (FDI) fell by 23% year-on-year in 2022, to $117 billion. China’s outbound mergers and acquisitions (M&A) activity also dropped, falling 21% from 2021 levels. A range of external and internal factors, from China’s zero-Covid policies to rising global risks following Russia’s invasion of Ukraine, created strong headwinds for Chinese investors. Specific to Europe, Chinese FDI reached a decade low of just EUR 7.9 billion in 2022, down 22% YoY. The drop takes Chinese investment back to its 2013 level. However, driven by electric vehicle battery factories, “greenfield” investment increased by 53% YoY, exceeding M&A flows for the first time since 2008. 88% of investment flowed to just four countries, the “Big Three” European economies (the UK, France, and Germany) and Hungary. - Chinese FDI in Europe: 2022 Update - Rhodium

VIEWS EXPRESSED IN "CONTENT" ON THIS WEBSITE OR POSTED IN SOCIAL MEDIA AND OTHER PLATFORMS (COLLECTIVELY, "CONTENT DISTRIBUTION OUTLETS") ARE MY OWN. THE POSTS ARE NOT DIRECTED TO ANY INVESTORS OR POTENTIAL INVESTORS, AND DO NOT CONSTITUTE AN OFFER TO SELL -- OR A SOLICITATION OF AN OFFER TO BUY -- ANY SECURITIES, AND MAY NOT BE USED OR RELIED UPON IN EVALUATING THE MERITS OF ANY INVESTMENT.
THE CONTENT SHOULD NOT BE CONSTRUED AS OR RELIED UPON IN ANY MANNER AS INVESTMENT, LEGAL, TAX, OR OTHER ADVICE. YOU SHOULD CONSULT YOUR OWN ADVISERS AS TO LEGAL, BUSINESS, TAX, AND OTHER RELATED MATTERS CONCERNING ANY INVESTMENT. ANY PROJECTIONS, ESTIMATES, FORECASTS, TARGETS, PROSPECTS AND/OR OPINIONS EXPRESSED IN THESE MATERIALS ARE SUBJECT TO CHANGE WITHOUT NOTICE AND MAY DIFFER OR BE CONTRARY TO OPINIONS EXPRESSED BY OTHERS. ANY CHARTS PROVIDED HERE ARE FOR INFORMATIONAL PURPOSES ONLY, AND SHOULD NOT BE RELIED UPON WHEN MAKING ANY INVESTMENT DECISION. CERTAIN INFORMATION CONTAINED IN HERE HAS BEEN OBTAINED FROM THIRD-PARTY SOURCES. WHILE TAKEN FROM SOURCES BELIEVED TO BE RELIABLE, I HAVE NOT INDEPENDENTLY VERIFIED SUCH INFORMATION AND MAKES NO REPRESENTATIONS ABOUT THE ENDURING ACCURACY OF THE INFORMATION