


Higher Rate Volatility Weighs on Risk Appetite Despite the U.S. Economy Remaining Resilient – Midday Macro – 8/4/2023
Color on Markets, Economy, Policy, and Geopolitics

Higher Rate Volatility Weighs on Risk Appetite Despite the U.S. Economy Remaining Resilient – Midday Macro – 8/4/2023
Market’s Weekly Narrative and Headlines:
Stocks are ending the week at recent lows, with the S&P down by over 100 points on the week, as inline earnings, stable economic data, and more dovish Fed rhetoric failed to reverse the de-risking that higher yields and a steeper treasury curve started earlier in the week. With the majority of the companies now having reported earnings, the picture is clearer, and although results were better than expected, ensuing price action indicated that the bar was indeed set too high going into the Q2 earnings season, something we expressed worries about a few weeks back. As a result, we are getting the expected pullback, and given seasonal worsen over the next two months, it is likely that there is further pain to be felt. Today’s job report showed a continued decline in the level of hiring, but by no means is the labor market overly loosening, even with the JOLTs report showing a continued decline in the quits rate earlier in the week. ISM surveys continued to paint a picture of a cooling economy, with little change in the level of contraction occurring in the manufacturing sector while the service side grew at a slower pace. Factory orders also showed a cooling in core activity, with transportation equipment being the driver, but new orders for electronics and computers rose. Construction activity showed an improvement in residential activity but a cooling elsewhere. The Treasury market had an eventful week, with long-end yields going parabolic at one point due to several catalysts; BoJ changing YCC policy, Fitch downgrade, and increased debt supply due to more significant decreases in fiscal revenues, catching positioning wrong-footed and steepening the curve notably. Elsewhere, oil continued to rally higher, ending the week near recent highs, as the second-half expected supply deficit only grew with Saudi Arabia and Russia announcing further cuts while the U.S. had a massive drawdown in oil stock. Copper reversed recent gains as China failed to produce any bazooka-like stimulus over the week, while new data pointed to a worsening growth and property sector-specific picture there. The agg complex remains bifurcated, with pigs, sugar, rice, and cocoa all rising on idiosyncratic stories while the grains and beans traded heavier despite increased attacks across the Black Sea. Finally, the dollar is lower today following the job’s report but was higher for most of the week, with recent rises in longer-dated real rates helping favor dollar strength, while the BoE gave a more mixed message on the future path of policy than expected and Brazil and Chile were first to cut rates meaningfully.

Deeper Dive:
We will keep this week's deeper dive shorter, given our views remain mainly unchanged on the week. Next week, we plan to elaborate on the reasons for our short transportation position and delve into the conflicting messages we are seeing in consumer confidence surveys. In combination with the gradual cooling of labor markets, as seen in this week's data, we hope to build up a case for why the better-than-expected level of personal consumption will trend lower into year-end as the U.S.consumer moves from resilient to pragmatic, something we have been teasing in our writing for some time. This week's economic data, earnings results, and global policy and geopolitical developments continue our view that the current risk rally is stretched and needs a pause. It also encouraged our view that inflation will fall faster than expected despite the resilient levels of growth, mainly due to supply-side improvements continuing while final demand normalizes and enters a below-trend period. This leaves central banks positioned too hawkishly, especially regarding their forward guidance. Even with a likely uptick in headline inflation in next month’s CPI/PCE reports due to recent rises in energy and food costs, the drag expected from falling shelter costs and stabilization in supercore will force the Fed to change their SEPs before year-end and reduce the duration they project needing to stay in restrictive territory. This may not be reflected as strongly as ultimately needed in September's SEPs adjustments, but by December, to keep credibility, the 2024 year-end median dots should move to reflect a greater disconnect, with higher growth and yet still lower UER and PCE forecasts, even as the Hawks potentially hold out on changing their views. We believe the policymaker community slowly realizes the current disinflationary trend is more detached from labor market tightness and economic growth than previously thought (and what they were taught). We saw this acknowledged by more dovish Fed speakers like Goolsbee, Bostic, and Barkin this week. As we have long believed, the unique nature of the current inflationary pulse, caused by the massive supply-side shock and overcompensating stimulus measures globally due to the uncertainty of the pandemic's effects, means that this is still a transitory story, just not one that is as short as originally thought. Add in the effects of the war in Ukraine and China's zero-Covid policy, and the normalization of supply and demand for goods and services back to non-price accelerating levels was never going to be a short-lived exercise. However, we are nearing the end of this process, as seen by leading inflationary readings becoming deflationary, increasingly pressuring final demand price measures back toward more normal levels. This is driving more dovish rhetoric and a more two-sided risk management approach to future policy actions by central bankers worldwide. Now pauses and reduced hiking intentions by developed nations as well as large cuts in emerging markets, as seen in Chile and Brazil this week, lead us to believe that despite never officially being acknowledged, the transitory view is gaining the upper hand in policy debates around committee tables globally.

*The level of policy tightening has been unprecedented globally, leading us to believe that many nations won’t need to keep rates in restrictive territory for as long as currently thought

*Global financial conditions continue to tighten despite risk-asset performance recovering this year, with Capital Economics model projecting the developed market's collective financial conditions index still near its tightest levels of this cycle

*The big three are all seeing meaningfully lower trends in CPI and PPI readings, with China increasingly likely to be exporting deflation
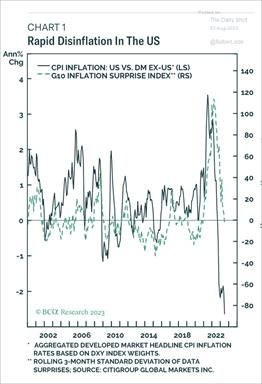
*The U.S. is leading developed markets in disinflationary gains but recent decreases in PPIs elsewhere signal more drops in CPI are coming

*Manufacturing leads Services: PPI leads CPI, Headline leads Core, Goods leads Services…

*Gains in our oil long position countered losses in our $TLT long, which was stopped out with the rapid rise in yields this week. Other positions are flat, with our short equity positions gyrating around current levels, while copper is weaker on the week due to uncertainty regarding further Chinese stimulus, and the dollar reversed recent gains today
As we have done during past earning seasons, we wanted to highlight some earning call excerpts as identified by The Transcript, a substack newsletter we subscribe to. They focus on “interesting and important” quotes from management about the economy and industry, something that is useful given how much ground there is to cover when reviewing earning calls. We chose a few quotes specific to the health of the U.S. consumer:
"If you think about the US consumer, what we see with the 60 plus million consumers we have is the rate of their spending. Not only their debit and credit cards, which is the 3% you mentioned but across all the ways they put money out. Every day is growing at about a 5% rate." - Bank of America CEO Brian Moynihan
"Consumer spending across all spending bands from affluent to low spend remained stable since March. Our data did not indicate any behavior change across consumer segments. Putting all this together, we continue to believe that the primary driver of the step-down in U.S. payments volume growth since March is moderating inflation and that the consumer has remained resilient so far." - Visa CFO Vasant M. Prabhu
"Our brands continue to fire on all cylinders, resulting in record yields and second-quarter earnings significantly exceeding our expectations…Demand for cruising and our brands is exceptionally strong, and we have seen another step change in booking volumes and pricing…as we increase pricing, we're not really seeing that point where the price is impacting our demand." - Royal Caribbean Group CFO Jason Liberty
"As far as the U.S. is concerned, we feel a bit of pressure, particularly on the aspirational customer side, as I explained before on other categories. But all in all, I mean, it's not too bad. So we end up with a slight -- I mean, low single-digit growth in this particular segment of the business, which is not too bad given our pretty high exposure to the U.S. market in some brands. We are experiencing drops in enterprise products with online sales with second-tier cities, which is a clear sign that the aspirational customer is not shopping as much as they used to. A." - LVMH Moët Hennessy CFO Jean-Jacques Guiony
"But from our perspective, if you look at our data, as an industry and as a business, we are already operating in an environment that is indicative of what we would call the garden variety recession level, for now, a number of quarters in the U.S. and more quarters in Europe… you see our industry is coming down to a lower level. You've seen hours worked coming down. You've seen more part-time people looking for full-time work. So the indicators are all there for a slightly worsening labor market” - ManpowerGroup CEO Jonas Prising
Please share our newsletter, and feel free to reach out with any questions or comments.
Thank you for reading! - Mike Ball

*Everything cycles…
Policy Talk:
Minneapolis Fed President Kashkari was interviewed on Face the Nation, where he noted that the economy remains stronger than he expected, with tight labor markets. He focused on the core inflation rate being still well above target despite recent progress and, as a result, the Fed being unable to declare victory yet and the potential need to raise rates further. He reiterated the need to assess the new data between now and the next meeting to determine what policy action should be taken. He stressed how resilient the economy had been in the face of all the post-pandemic shocks that have hit along with tighter monetary policy. His base case scenario is for a slowing economy that would avoid a recession. He noted that fiscal stimulus through the infrastructure bill and IRA contributes to upward inflationary pressure. Still, he believed that the inflation outlook was positive and would slowly diminish back to target, assuming no future shocks. However, he said he would be surprised if there was no cost to labor and still expects a softening in hiring and a move higher in the UER. He ended the interview by discussing the impact of the hotter weather on his district's agricultural sector.
“But so far, the US economy just continues to signal that it is very strong, that there's a lot of demand, workers are coming off the sidelines. And so right now, we know shocks can hit us. But right now, the base case scenario seems to be that we'll have a slowing economy but that we would avoid a recession. And I hope that that's true.”
“I think that the inflation outlook is quite positive, that it should be slowly diminishing from here. But again, we've just continued to be surprised by the dynamics of this reopening economy. And so we can't prejudge it, we have to let the data actually guide us.”

Chicago Fed President Goolsbee was interviewed by Yahoo Finance, where he said the recent declines in inflation were “fabulous news” but hasn’t made up his mind whether further rate hikes were needed. Goolsbee believes the Fed is on a “golden path” in bringing down inflation without causing too much economic hardship. He pushed back on thinking about inflation and employment through a traditional Phillips curve model. He noted that the banking sector has stabilized, with money coming back into deposits, and as a result, this has kept credit tightening in line with expectations. He stressed the dependence on new data to determine the next steps, as every Fed official has been doing. He noted positive progress in goods inflation and believed shelter costs would drop next, reducing service inflation, the stickiest part of inflation. He sees inflation expectations as well anchored, and this is what is needed to ensure policy is working while keeping recession risks low. He ended the interview by advocating for high levels of capital and the importance of strong macroprudential frameworks to keep the financial sector healthy.
“But the new information, of course, is just the monthly reading. And the monthly readings have been coming in quite good. So our goal is to stick on what I call, the golden path, which is let's get inflation down without causing a major recession. And that will be a triumph for the Fed, a historic triumph, it has very seldom happened that way.”
“As I say, all of the above, there's nothing off the table, there's nothing specifically on the table. Let's not tie our hands of what we're going to do before we get the information. So far, we've gotten inflation down without a recession, and, indeed, without even raising the unemployment rate, a thing that many economists said was literally impossible. So let's keep our eye on the new monthly inflations in core, both goods, and services, and housing. Because the goods inflation, we've seen nice progress.”
“I've seen a lot of people trying to emphasize wages, almost treating it like it's a leading indicator for price inflation. And the only thing I will observe is that, historically, it's not at all, wages lag price inflation, they're not a leading indicator of it. So I would caution everybody, don't make too much about inflation prediction when you see what wages are doing, it's more like what's happening to price inflation today is the indicator of what will happen to wages six months from now.”

Richmond Fed President Barkin gave prepared remarks titled “Recession Revisited,” highlighting that recession forecasts continue to be pushed back, but he sees a plausible scenario where inflation normalizes, and the economy dodges any significant slowdown. Barkin attributes the economy's strength to the consumer's resilience, supported by strong-than-expected spending funded by excess savings and higher net wealth effects. He also attributes a change in general demand dynamics due to the pandemic, with businesses still working off the excess demand they experienced due to pandemic-driven consumption trends supported by pro-growth policies and additionally helped by the infrastructure and IRA fiscal initiatives. However, Barkin noted that tighter policy has already pushed several industries into mini-recessions, given different interest rate sensitivity levels. He specifically noted general concerns regarding commercial real estate and the financial sector. He went on to highlight how the coming slowdown could be different. He believes labor will be more sticky, and the labor already laid off to be more resilient consumers, given their higher levels of income and the skills they possess. He sees consumption being held up by “latent demand,” with price decreases drawing in buyers that had been sidelined but still have disposable income and savings to draw on, flooring demand losses. He also sees a business landscape well prepared for a recession, with firms already taking measures in preparation, hence reducing the risk of a deeper protracted slowdown. He concluded that there is still a plausible path for inflation to decline quickly, reducing additional cost hardships for businesses and consumers.
“GDP remains solid, growing 2.4 percent in the second quarter, in no small part thanks to the consumer. Higher-income consumers are still spending, and higher wages are supporting consumption, too. The labor market has also remained remarkably resilient, with the unemployment rate at a historically low 3.6 percent. We have added nearly 1.7 million jobs and 2 million people to the labor force thus far this year.”
“Further slowing is almost surely on the horizon. A number of pandemic-era fiscal support programs are ending. Rate increases work with a lag; many models estimate their impact should start to really hit around now. In addition, as banks preserve liquidity and protect earnings by stepping back from marginal lending, credit conditions have tightened, reducing consumer and business spending capacity.”

The Kansas City Fed announced that Jeffrey Schmid will be the new bank president, ending one of the longest regional Fed presidential searches ever and avoiding any coming Jackson Hole meeting abnormalities. Schmid is coming from a presidential role at the Southwestern Graduate School of Banking Foundation at Southern Methodist University’s Cox School of Business. Prior to this, he has over “40 years of banking and regulatory experience,” working for the FDIC and being the CEO of Mutual of Omaha Bank. At first glance, Schmid looks to be a bank operator at heart and certainly not an economist. This should help diversify the existing FOMC members well, which sometimes suffers from Irving Fischer group think. He also likely has an extensive network in the KC district due to his extensive time working in the region. Schmid will complete the remainder of Esther George’s five-year term as president, which ends in February of 2026. At that time, he will be considered for reappointment under a process established by the Board of Governors. Schmid will participate in FOMC meetings upon his start date and will be a voting member of the committee in 2025. We wish Schmid good luck and look forward to placing him somewhere on the Dove-Hawk range as we learn more about his views and monetary policy leanings.

The Board of Governors' July Senior Loan Officer Opinion Survey reported, on balance, tighter standards and weaker demand for loans. Loans to businesses saw weaker demand and tighter standards for all sizes of firms regarding commercial and industrial lending, while the same was true for commercial real estate-related loan categories. More significant uncertainty on the economic outlook was the most cited reason for tightening standards, followed by a reduced tolerance for risk. Banks reported tighter standards across all categories of residential real estate lending. Demand also weakened across all categories. Further, standards tightened for all consumer loan categories, with demand weakening for auto and “other” consumer loans and remaining stable for credit card loans. The July SLOOS asked two special questions, which inquired about the current level of lending standards relative to the average level since 2005, as well as questions about banks’ expectations for changes in lending standards over the second half of 2023 and reasons for these changes. In response to the first question, banks reported that, on balance, levels of standards are currently on the tighter end of the range for all loan categories. Compared to last year, banks reported tighter levels of standards in every loan category. Regarding banks’ outlook for the second half of 2023, banks reported expecting to tighten standards on all loan categories further. Banks most frequently cited a less favorable and more uncertain economic outlook and expected deterioration in collateral values and the credit quality of existing loans as reasons for expecting to tighten lending standards further over the remainder of the year.
“When asked about reasons for tightening standards or terms during the second quarter, the most frequently cited reason was a less favorable or more uncertain economic outlook. Major net shares of banks also reported a reduced tolerance for risk, deterioration in their liquidity positions, worsening industry-specific problems, increased concerns about the effects of legislative changes, supervisory actions, or changes in accounting standards, and decreased liquidity in the secondary market for loans as important reasons for tightening standards or terms for C&I loans.”
“Over the second quarter, significant net shares of banks reported having tightened standards for credit card loans and other consumer loans, while a moderate net share reported having done so for auto loans. Consistent with tightened standards for credit card loans, banks also reported having tightened almost all queried terms on consumer loans. Regarding terms for credit card loans, significant net shares of banks reported having tightened the extent to which loans are granted to some customers who do not meet credit scoring requirements, increasing the minimum required credit scores, and decreasing credit limits.”

*Standards continue to broadly tightening for all sizes and types of comercia and industrial, as well as CRE loans

*Banks reported tighter standards for all categories of consumer loans, with credit card credit lines looking to see the most tightening

*Demand remained stable for credit cards but fell for auto and other consumer loans
U.S. Economic Data:
The July Jobs Report showed an increase of 187K jobs in the Nonfarm Payrolls survey, following a downward revised 185K June increase and below expectations of around 200K. Revisions for May, in combination with June, saw a decrease of -49K from original estimates. Job gains occurred in health care (63K), social assistance (24K), financial services (19K, with real estate rising 12K), and wholesale trade (18K). Employment in leisure and hospitality increased by 17K, but job gains in recent months have been well below the average monthly gains of 67K in Q1. Employment in manufacturing fell by -2K, following a gain of 6K in June. The unemployment rate decreased to 3.5% in July from 3.6% in June. The number of unemployed people decreased by 116K to 5.8 million, while employment levels rose by 268K to 161.3 million. The U-6 unemployment rate fell to 6.7% from 6.9% in June, on a drop in part-time workers for economic reasons. The labor force participation rate was unchanged at 62.6%, remaining at its highest level since March 2020. Average hourly earnings rose by 0.4% MoM in July, the same pace as in June and slightly above expectations of a 0.3% MoM rise. On an annual basis, AHE increased by 4.4%, the same rate as in June. Finally, the average workweek fell by 0.1 hours to 34.3, with the average workweek unchanged in manufacturing at 40.1 hours and overtime unchanged at 3 hrs. The average workweek for production and nonsupervisory employees on private nonfarm payrolls remained at 33.8 hours.
Why it Matters: July’s job report gave a mixed picture, with hiring levels still high but continuing to cool. The slowing was not enough to raise the UER and coupled with persistent wage gains that now see the annualized three-month average of 4.9% above the actual annual change of 4.4%, both of which paint a picture of a labor market that is too tight for the Fed to be able to achieve its inflationary goals. Further to that point, the ratio of job vacancies to the number of unemployed job seekers moved to 1.64 versus 1.61 in the prior month, off a peak of 2.02 in April 2022 but still well above the average of 1.20 in the already tight labor market of 2019. Contradicting this tighter labor market picture is the deceleration in outright payroll gains. Even though the 187K NFP reading is historically strong, it is well below the average monthly gain of 312K over the prior 12 months. However, it remains twice the 70K-100K needed per month to keep up with growth in the working-age population, a level that could be said to be non-wage accelerating. The Brainard favorite employment to population ratio (EPOP) moved slightly higher to 60.4% from 60.3% in June, but with a stable participation rate for five months now, it looks like we may be maxing out on how many more people are available to enter the workforce. It also looks like reduced capacity needs, as seen in business surveys, continue to translate to shorter workweeks. Total private sector hours worked fell by -0.2% MoM while manufacturing hours worked declined by 0.4% MoM. Finally, as perhaps a leading indicator of further loosening to come, temporary help employment fell -22K, after decreases of -27K for June and May.

*By sector, the strongest payroll increase was again in health care

*A balance of 57.2% of industries in the private sector reported increases in employment in July, down from 58.8% in June

*The UER slipped to 3.5% in July from 3.6% in June with the participation rate unchanged at 62.6 while household employment rose 268K

*Labor force participation was flat, moving slightly lower for prime-age workers, however, it is still above pre-pandemic levels.

*Average hourly earnings at 4.4% YoY is still too high for the Fed's comfort level, with recent gains projecting an even higher level when annualized

*The average workweek is trending lower, now back in a more historically pre-pandemic normal range
The number of job openings fell to 9.6 million in June, a drop of 34K from May and reaching the lowest level since April 2021 and coming in slightly below the market consensus of 9.61 million. Job openings decreased in transportation, warehousing, and utilities (-78K), state and local government education (-29K), and federal government (-21K). In comparison, openings increased in health care and social assistance (+136K) and in state and local government, excluding education (+62K). In terms of regional distribution, job openings declined in the Midwest (-138K) and the South (-76K) but rose in the West (107K) and the Northeast (73K).This level of openings leaves 1.61 vacancies per unemployed job seeker. Gross hiring slowed to 6.23 million in June from 6.45 million, while separations also slowed, falling to 5.64 million from 5.93 million. Much of the decline in separations was due to a drop in the quits rate, which fell back to 2.4% level from 2.6%. The pace of layoffs was virtually unchanged at 1.53 million in June versus 1.55 million in May.
Why it Matters: The official headline JOLT’s picture continues to show a still tight labor market with plenty of jobs available for job seekers. However, as we have highlighted in the past, we have a sneaking suspicion that many of these job openings are not intented to ever be filled, and on top of a notably reduced sample set, this data series is less reliable as an overall gauge of labor market tightness. As a result, we see the quits rate as a better gauge of labor market tightness, and although part of the same data release, it is collected differently and hence more reliably. The gradual grind lower in separations, mainly driven by lower levels of quits, will support the trend lower in wage growth already underway. This will be a welcome sign for the Fed, reducing wage spiral fears and confirming reports of lower turnover seen in regional surveys and the Beige Book. Further, as seen in the Atlanta Fed’s wage tracker, the gap between job changers and stayers has compressed back to more historically normal levels, confirming our views that wage pressures have peaked due to lower turnover, an early indicator of loosening labor markets more generally.

*Overall job openings continue to trend lower, but the vacancies to unemployed job seekers ratio is still historically very high

*The larger drops in the month in openings came from the logistics sector and, more generally, from the Midwest and South regions

*the level of quits continues to trend back to a pre-pandemic level while layoffs are flat
Nonfarm business sector labor productivity increased 3.7% in Q2, rebounding from a downwardly revised -1.2% decline in the previous quarter and compared to forecasts of 2% QoQ, preliminary estimates showed. Output rose by 2.4% while hours worked decreased by -1.3%, the first fall since the second quarter of 2020 due to a -1.3% drop in average weekly hours while employment was unchanged. From the same quarter a year ago, productivity increased 1.3% YoY, the first gain since the fourth quarter of 2021, reflecting a 2.6% YoY rise in output and a 1.2% YoY increase in hours worked.
Why it Matters: This report will be viewed positively by Fed officials who want to see productivity increases coinciding with wage increases. It also reinforces our view that firms have learned to do more with less due to the experiences they had with supply-side shortages over the last two years. A significant amount of automation investment, both on the physical and digital side, should increase capital's share of output while also allowing rising profits to support wage gains as the need to increase headcount into a slowing growth backdrop is reduced, but each existing worker's output improves. Obviously, every firm and industry will be affected differently given the degree of investment and skills needed, but on aggregate, we expect productivity to continue to trend higher in coming months as past capex endeavors increasingly pay dividends.

*Increased output and shorter hours worked led to better productivity results in Q2

*The Q2 increase in labor productivity moved things back to trend
The Challenger Report showed employers announced 23.97K job cuts in July, the least since August 2022, compared to 40.7K in June. The technology sector led in cuts (4.7K), followed by Health Care/Products (2.7K) and Education (2.3K). So far this year, employers announced plans to cut 481.9K jobs, a 203% increase from the first seven months of 2022. The top reason for layoffs on the year continues to be market/economic conditions, although no reason provided was the leading reason given in July. Firms announced the intention to hire 12.7K workers in July, slightly below June’s 13.6K, with healthcare and products, energy, and food industries seeing the largest increases.
Why it Matters: Compared to July last year, cuts actually fell by -8%, the first year-on-year month-verse-month decline in more than a year, as there has been a notable drop in layoffs in the last two months below the first five months' average. While tech has contributed 30% to the total number of job cuts this year and led again in July, the overall numbers for June and July are also considerably lower than in prior months. Interestingly, although driving hiring and still reporting a significant level of openings, the retailers have announced close to 600% more cuts this year so far compared to last. However, its worth noting that there has been a trend lower in hiring announcements over the year. “The job market is remaining resilient in the face of rising interest rates, as consumers continue to spend and inflation falls. Companies, weary of letting go of needed workers, are finding other ways to cut costs. Many have slowed hiring, but wages continue to rise, particularly for the lowest-wage earners, for the moment,” said Andy Challenger, labor expert and Senior Vice President of Challenger, Gray & Christmas, Inc.

*Layoffs earlier in the year, driven by tech firing covid-era excesses, have largely normalized

*July ’23 layoff amount was below July ‘22’s level, a first in over a year, indicating layoff pressures are subsiding

*Hiring plans continue to trend lower, with the monthly average now close to 20K, significantly lower than prior year averages
Construction spending rose by 0.5% in June, after an upwardly revised 1.1% increase in May and slightly below market forecasts of a 0.6% MoM rise. Private construction spending increased by 0.5% MoM, boosted by the residential segment rising by 0.9% MoM, with spending on single-family units increasing by 2.1% MoM and outlays on multi-family housing projects advancing by 1.5% MoM. Conversely, spending on the non-residential segment was flat on the month, rising only 0.1% MoM, with little change in commercial, educational, and highway and streets, while power-related construction fell by -1.3% MoM. Manufacturing-related construction rose by 0.3% MoM, a deceleration from recent monthly increases. Meanwhile, public spending was up by 0.3% MoM, supported by growth in the non-residential segment. On an annual basis, construction spending grew by 3.5% YoY in June.
Why it Matters: Some recent trends changed in June’s report, with private residential construction picking up while highway and street, as well as manufacturing, supported by now well-known fiscal initiatives, cooled. The increased building of shelters (single and multi-unit) last month counters the decline seen in June’s housing start data (-8% MoM). Still, more generally, there is a large pipeline of units under construction. As a result of this increased level of construction and other data points and views on rates, we believe we are currently near the worst of the housing supply shortage story that is well known. Of course, private residential construction is still lower by -10.4% YoY and would be significantly worse if private residential improvements weren’t included, indicating structural impairments reducing construction capacity are still occuring.

*Construction broadly cooled outside of the private residential sector, with a reversal in recent trends occurring in June

*Manufacturing construction has gone parabolic due to a change in incentives set forth by the Infrastructure Bill and Inflation Reduction Act
New factory orders for manufactured goods increased by 2.3% MoM to $592 million in June, the most since January 2021, and extending the upwardly revised 0.4% advance from the previous month. As seen in May and June’s Durable Goods report, transportation equipment orders surged, increasing by 12% MoM and driving headline gains, expanding from the upwardly revised 4.2% increase in the previous month due to strong demand for non-defense aircraft and parts, which rose 69.4% MoM. Excluding transportation equipment, new orders rose by 0.2% MoM verse -0.4% MoM in May. However, despite the lower ex-transport reading, new orders notably rose for computers and electronic products (1.6%), fabricated metal products (1.2%), and electrical equipment, appliances, and components (1.5%). Demand for nondurable goods was flat, only 0.1% higher. Total shipments increased by 0.1% MoM, both with and excluding transports, while Total Unfilled Orders rose by 1.8% MoM. Finally, Inventories were unchanged for the month.
Why it Matters: As seen in the durables good report, headline increases in new factory orders are being driven by the large increase in transportation equipment. However, elsewhere gains were mixed, with machinery lower but electronics-related categories broadly higher. Interestingly there was a decline in construction-related machinery, showing a trend lower in demand for three months despite a strong construction theme this year. Furniture and related products rebounded after three months of declines, indicating a restocking of low inventories is occurring into the holiday season potentially.

*Transportation equipment continues to drive overall manufacturing activity
The ISM Services PMI fell to 52.7 in July from a four-month high of 53.9 in June, compared to forecasts of 53. Demand and activity measures cooled in July but remained broadly expansionary. Business Activity (57.1 vs. 59.2) fell, while New Orders (55 vs. 55.5) and New Export Orders (61.1 vs. 61.5) were little changed. There was a notable increase in the Backlog of Orders (52.1 vs. 43.9) back into expansionary territory. Imports (52.3 vs. 54.6) expanded at a reduced rate, with two industries reporting an outright decrease. Supplier Deliveries (48.1 vs. 47.6) times shortened at a reduced rate. Inventory (50.4 vs. 55.9) readings were more neutral, while Inventory Sentiment (56.6 vs. 54) expanded, indicating firms saw their stocks as too high compared to last month. Employment (50.7 vs. 53.1) readings indicated a neutral hiring picture. Finally, Prices (56.8 vs. 54.1) expanded further with only two industries, mining, and food services, reporting decreases.
Why it Matters: The July ISM Service PMI reading pointed to a slowdown in services growth due to smaller increases in demand and activity, while inflationary pressures were more sticky, given price increases and delivery times shortening at a slower pace. We also see the increase in the backlog of orders back into expansionary territory as putting pressure on capacity needs, something that is inflationary, all else equal. The majority of respondents were cautiously optimistic about business conditions and the overall economy, as seen in the selected comments. “Fourteen industries reported growth in July. The Services PMI, being above 50 percent for the seventh month after a single month of contraction and a prior 30-month period of expansion, continues to indicate sustained growth for the sector. The composite index has indicated expansion for all but three of the previous 161 months,” said Anthony Nieves, ISM Chairman. He further stated that “there has been a slight pullback in the rate of growth for the services sector. This is due mostly to the decrease in the rate of growth for business activity, new orders and employment, as well as ongoing faster delivery times. The majority of respondents are cautiously optimistic about business conditions and the overall economy.”

*The headline ISM Service PMI continues to trend lower but remains expansionary due to overall business activity and new orders

*After a consistent decrease from its peak at the beginning of 2022, prices paid rose in July, while employment continues to move sideways, staying slightly expansionary

*Changes in subindex readings were mixed, while comments skewed more positively
The ISM Manufacturing PMI rose slightly to 46.4 in July from a nearly three-year low of 46 in June but below market expectations of 46.8. Demand and Activity measures improved from the prior month's readings but are still contracting. New Orders (47.3 vs. 45.6) and Backlog of Orders (42.8 vs. 38.7) moved higher, with the second coming off notably low levels but remaining well in contractionary territory. New Export Orders (46.2 vs. 47.3) did contract further. However, Imports (49.6 vs. 49.3) remained near neutral, along with improvements in Inventories (46.1 vs. 44), showing despite falling demand, firms are still buying inputs and keeping stock near neutral, as also seen in Customer Inventories (48.7 vs. 46.2) readings. This coincides with a reduced contraction rate in Production (48.3 vs. 46.7) and Supplier Delivery (46.1 vs. 457) improving. Prices (42.6 vs. 41.8) rose but remained well in contractionary territory. Finally, Employment (44.4 vs. 48.1) fell somewhat notably.
Why it Matters: The reading pointed to a ninth straight month of contraction in factory activity, as demand remains weak, production slowed due to lack of work, and suppliers continue to have capacity. The drop in hiring coincides with firms believing that the lower level of output warrants an adjustment in headcounts, even though demand slowed at a softer rate in July. Comments reinforced this, with firms noting the freezing of hiring, layoff intentions, and the need to readjust to a new lower output level. Timothy Fiore noted that layoffs were stronger than in prior months in June but stabilized in July, with lower levels of workweek hours more prominent instead of cuts, while discussing the report on Bloomberg. Finally, although prices paid rose, they are still contracting at a notable rate. The increases came from steel and plastics, but there were still a number of commodities down in price. “This is the ninth month of contraction and the continuation of a downward trend that began in June 2022. That trend is reflected in the Manufacturing PMI’s 12-month average falling to 48.3 percent. Of the five subindexes that directly factor into PMI calculation, none are in growth territory. Of the six biggest manufacturing industries, only one (Petroleum & Coal Products) registered growth in July. The New Orders Index logged an 11th month in contraction territory. For a second straight month, none of the 10 subindexes were above 50 percent,” Fiore said, summarizing the July report.

*None of the subindex readings were in expansionary territory, with many only one industry expanding in July

*New Orders moved closer to neutral while hiring activity dropped notably

The Federal Reserve Bank of Dallas’ Manufacturing Index rose to -20.0 in July, increasing from -23.2 in June and the highest level in four months. Demand and activity measures all remain in contractionary territory. New Orders (-18.1 vs. -16.6) moved further negative, as did Unfilled Orders (-13.8 vs. -8.5), while the Growth Rate of Orders (-20.6 vs. -23.7) contracted at a slightly slower yet still notable pace. Production (-4.2 vs. -4) was little changed in the month, contracting slightly. Shipments (-2.2 vs. -17) improved substantially on the month, moving close to neutral, while Capacity Utilization (-2.4 vs. -6) also improved. Despite improved shipments, Delivery Times (-11.4 vs. -4.3) shortened, although Inventories (-1.2 vs. -4.7) moved closer to neutral. Inflation readings increased, especially for Prices Paid (10.5 vs. 1.4), while Prices Received (2.3 vs. -1.9) remained near neutral. Labor readings showed Employment (10 vs. 2.2) and Hours Worked (3.9 vs. -4.3) expanding, while Wages (19.1 vs. 25.3) grew at a slower but still elevated pace. Current Capex (-2.4 vs. 0.3) activity contracted on the month. Six-month ahead readings skewed more positively, although production, shipments, and capacity utilization all contracted but remained well in the expansionary area. Demand measures rose further while price readings jumped higher. Hiring intentions weakened, although compensation expectations rose further. Finally, future capex plans rose notably higher.
Why it Matters: Despite the uptick in the headline index reading, it is clear the manufacturing business outlook in Texas is still highly uncertain. Demand measures moved further into contractionary territory, with unfilled and growth rate of orders all signaling reduced capacity needs. Actual activity did improve notably, with shipments jumping higher, near a more neutral reading on the month. This, however, countered a further shortening of current delivery times. Price pressures firmed off more neutral levels in June in both current and six-month ahead readings, indicating firms are still experiencing cost pressures and expect that to continue. This was reinforced by the always negatively skewing selected comments despite the broader improvement in six-month ahead demand expectations.

*The headline index improved thanks to a bounce in shipments while new orders contracted further

*Future readings of demand expanded further, although activity expectations fell

*July brought a more mixed picture at the sub-index level, with six-month ahead readings skewing more positively

*Comments out of Texas are often very colorful but generally skew more negatively despite what the index does
Technicals, Positioning, and Charts:
The Nasdaq is outperforming the Russell and S&P on the day, but all three indexes are lower, with Momentum and Small-Cap factors, as well as Consumer Discretionaries, Energy, and Materials outperforming on the day. Leadership on the week was duration sensitive, given the backup in yields and steepening of the curve that occurred. Energy is the only sector to have a positive performance, mirroring gains seen in oil, while Utilities and Tech were the worst performers on the week. The majority of factors outperformed the S&P, but small-caps, low volatility, and momentum were the best performers on the week, giving a somewhat mixed picture.

@KoyfinCharts
S&P optionality strike levels have the Zero-Gamma Level at 4509 while the Call Wall is 4600 and Put Wall is 4500. Support remains at the put wall while resistance is around 4515. If 4500 is breached, the picture skews more negatively, with implied vol increasing rapidly. 0DTE call buying defended that area yesterday, keeping the dip-buying mentality alive. The Fitch downgrade and increased bond volatility have led to a reduction in short equity volatility positions. The low levels of put skew have been an ongoing story, and one could argue there was so far just a snap-back/mean reversion of those low put IV's. Spotgamma sees any pullback below 4500 as a correction and not an end to the bull market based on current positioning.

@spotgamma
S&P technical levels have support at 4487, then 4575, with resistance at 4535, then 4553. The dip-buying theme and bullish uptrend channels/formations are increasingly being tested. It is important to note that August is not a “bearish month” but rather a seasonally neutral month, +0.1% on avg over the last 20 years, while July is one of the most seasonally bullish months. However, with increased volatility and recent support areas beginning to fall, zone/level trading is more important than in the prior two month’s bull market rally mode. With the green bull horn pattern now broken, bears are in control, and the top of the purple ascending triangle is now an improtant support level or a further sell towards the core uptrend channel is possible.

@AdamMancini4
Treasuries are higher on the day, with the 10yr yield lower by 14 bps to 4.04%, while the 5s30s curve is steeper on the session by 5 bps, moving to 5.6 bps.

Four Key Macro House Charts:

Growth/Value Ratio: Value is higher on the day and the week, with Small-Cap Value the best-performing size/factor on the week.

Chinese Iron Ore Future Price: Iron Ore futures are lower on the day and the week.

5yr-30yr Treasury Spread: The curve is steeper on the day and the week.

EUR/JPY FX Cross: The Euro is stronger on the day and week.
Other Charts:
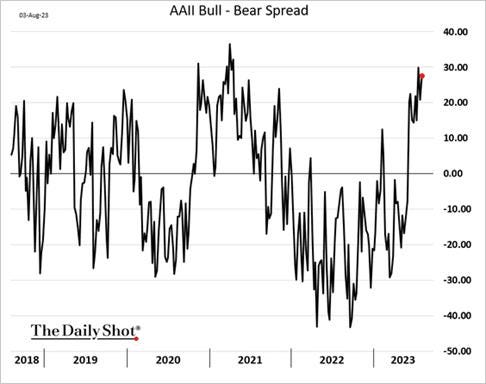
Investors remain highly bullish, with retail investors increasingly chasing this rally, as seen through increased call option buying, especially in tech names.

SPX correlation to 10y yields is now at its most negative level in 18 years." - Goldman Sachs
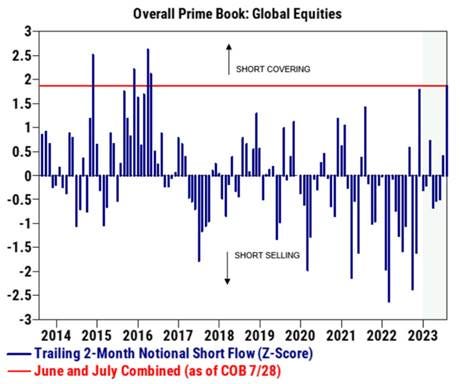
Global equity short covering over the latest 2-month period is on track to be the most since 2016, according to Goldman Sachs.

Valuations are expensive for the S&P verse twenty year averages, but this is due to a smaller group of the largest market cap-weighted stocks pulling up the index average while mid and small caps remain historically cheaper.
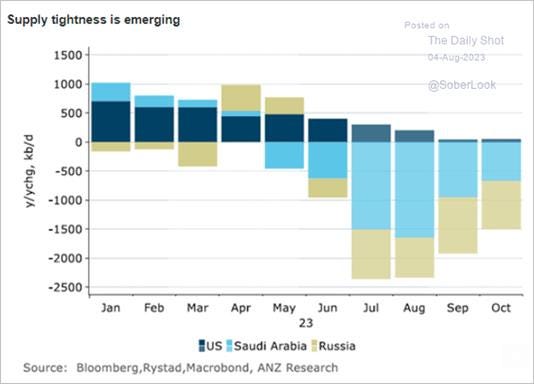
Oil supply deficit expectations are growing for the second half of the year.

According to Bank of America research, private equity firms are sitting on a record $2.2 trillion in dry powder, which could offset tightening credit conditions.

“Even if the Fed skips the next FOMC meeting, its balance sheet drawdown continues unabated. The central bank’s System Open Market Account has shrunk by almost $1 trillion since QT started.” - @TimmerFidelity

Annual changes to the National Rent Index are now negative despite recent increases in monthly changes.

“Another record-high for US manufacturing construction spending, and significant upward revisions to data from prior months! The US is on pace to build $100B of computer manufacturing facilities this year, mostly for semiconductor production in the wake of the CHIPS Act.” - @JosephPolitano

“The global electronics cycle appears to be bottoming out, as indicated by the stabilization in electronics exports from semiconductor manufacturing powerhouses Taiwan and South Korea.” - @Gavekal.
Articles by Macro Themes:
Medium-term Themes:
China’s Post-Pandemic Life:
A Dearth of Visitors: Half a year after China lifted Covid-19 restrictions and reopened its borders, few international travelers are coming to China, with the absence particularly evident in major cities like Beijing and Shanghai, where the numbers of foreigners who visited in the first half of the year totaled less than a quarter of comparable figures in 2019, before the Covid pandemic. Nationwide, just 52K people arrived in mainland China from overseas on trips organized by travel agencies during the first quarter, compared with 3.7 million in the first quarter of 2019. As in past years, nearly half of the visitors came from the self-ruled island of Taiwan and the Chinese territories of Hong Kong and Macau rather than farther-away places like the U.S. or Europe. - China’s Latest Problem: People Don’t Want to Go There – WSJ

Negative Loop: The National Bureau of Statistic’s manufacturing purchasing managers index remained in contraction for a fourth straight month while a similar measure of service sector PMI index fell to its lowest level of the year. Separately, the Caixin manufacturing purchasing managers index fell to 49.2 in July from 50.5 in June, showing smaller factories slipped into contraction for the first time in three months. This coincides with disappointing recent readings on employment, construction, and exports. This slower economic activity results in falling prices and weaker corporate performance, prompting competition and price cutting. That has the potential to pull China’s economy lower still, as companies lose money as customers hold back orders, leading to further reductions in the workforce. And while cheaper products from China would appeal to consumers around the world, deflation would also mean the massive country has less buying power for goods produced abroad. - China’s Economic Recovery Weakens as Growth Concerns Linger – WSJ

Calling All Consumers: China said it would announce new measures to boost consumption following a slew of other new policies unveiled in recent weeks to revive the economy. Earlier this month, the NDRC said it would introduce policies to boost consumption, with new measures aimed at reviving sales of cars, electronic products, and rural consumption. Thirteen government departments outlined plans to boost household spending on everything from electric appliances to furniture. Local authorities would help residents refurbish their homes, and people should get better access to credit to buy household products. NDRC also released a 10-step plan to increase car purchases, particularly for new-energy vehicles, including lower costs for electric-vehicle charging and extending tax breaks. China issued more measures to bolster economic growth on Friday, including a plan to boost consumer industries and steps to grow an exchange dedicated to helping small firms get access to funds. - China to Announce More Measures to Boost Consumption – Bloomberg

Longer-term Themes:
Cyber Life and Digital Rights:
Breaks on Car Data: The California Privacy Protection Agency, created under a ballot initiative in 2020 and the only regulator in the nation solely dedicated to privacy issues, will examine the growing amalgamation of data collected by smart vehicles and whether the business practices of the companies collecting that data comply with state law. “Modern vehicles are effectively connected computers on wheels. They’re able to collect a wealth of information via built-in apps, sensors, and cameras, which can monitor people both inside and near the vehicle,” Ashkan Soltani, the agency’s executive director, said in a statement. U.S. regulators’ scrutiny of the data lags behind such efforts in Europe, which has forced automakers to update software to limit the collection and protect the privacy of consumers. Regulators in Europe also have opened investigations into how the auto industry uses personal information from cars, such as location data. - California Opens Privacy Probe Into Who Controls, Shares the Data Your Car Is Collecting – WSJ

New Online Restrictions: President Putin has signed off on legal amendments that threaten to destroy online anonymity, crush free speech, and stifle innovation further in Russia. Starting this year, internet platforms must verify new users’ identities via state-approved systems before granting access. VPN circumvention advice will constitute a crime, certain Gmail use will be banned, and non-state-approved hosting companies will be rendered illegal. Despite the draconian nature of the above, Russia still isn’t imposing an outright ban on VPN providers and similar services. - Putin Outlaws Anonymity: Identity Verification For Online Services, VPN Bypass Advice a Crime - TorrentFreak

Energy’s Midlife Crisis:
Breaking Water: About 15 miles south of Martha’s Vineyard, Massachusetts, there will soon be a wind farm with the biggest turbines in the world, as tall as the Washington Monument with the Statue of Liberty stacked on top. It’s the first offshore power substation in the U.S. and in October it is expected to start delivering electricity from Vineyard Wind, the nation’s first commercial-scale offshore wind farm. By 2024, the project is expected to generate enough electricity to power 400,000 homes. President Joe Biden has set a goal of 30 gigawatts of turbines in operation in US waters by 2030, and several Northeast and Mid-Atlantic states have established their own targets. But those goals are threatened by increased costs that have hit the industry. - World’s Biggest Offshore Wind Turbine to Rise Next Week in US – Bloomberg

Cold Places (Deep Sea, Artic, and Space Colonization):
“Not Yet”: In an international showdown that is pitting China against dozens of other nations, one company’s quest to strip-mine the seabed for valuable metals has hit a roadblock following the conclusion of three weeks of tense meetings at the International Seabed Authority (ISA), a United Nations-affiliated organization that regulates the nascent deep-sea mining industry. The results of this summit were ‘not yet,” with most delegations saying they wouldn't approve any mining applications until the ISA puts mining regulations in place. The session ended with an agreement to work “with a view” to adopting such regulations in 2025, but didn’t set a binding deadline. The summit’s final days were characterized by a clash between China, which favors seabed mining, and a growing alliance of countries calling for a moratorium or pause due to a lack of scientific knowledge about the deep ocean ecosystems being targeted. - In the Race to Mine the Seabed, China Takes a Hard Line - Bloomberg

Space Junk: The Senate Commerce Committee advanced the Orbital Sustainability, or ORBITS, Act last week, for a second time, moving it to the House now.The core of the bill would direct NASA to establish an active debris removal program. That would include funding research and development activities “with the intent to close commercial capability gaps and enable potential future remediation missions for such orbital debris,” the bill states. “The ORBITS Act is going to empower NASA to research, develop and demonstrate key technologies to remove the debris,” Sen. John Hickenlooper (D-Colo.), lead sponsor of the bill, said in remarks at the session. “This bipartisan bill ensures that the United States remains the leader in responsible and sustainable uses of outer space.” As that bill advances, the agency is also outlining the role it will take in assisting the Commerce Department on a new space traffic coordination system. - Senate committee advances orbital debris removal bill - SpaceNews

Other Articles of Interest:
Dual-Use Restrictions: China has slapped export controls on a wide range of drones and drone components, a move with a potential impact on the Ukraine war and on public security applications in many Western countries. “The risk of some high-specification and high-performance commercial-use drones being converted to military use continues to rise,” the Chinese commerce ministry said on Monday. As a leading drone producer and “responsible great power,” China had decided to broaden restrictions on the export of unmanned aerial vehicles, the ministry said. The controls, which take effect on September 1, follow repeated appeals by EU officials to China to restrict supplies of military or dual-use technology to Russia since Moscow’s invasion of Ukraine. - China widens controls on drone exports - FT

No More Please: The U.S. public debt burden will reach 181% of economic output in 2053, the Congressional Budget Office said on Wednesday, a slight improvement over recent long-term projections due to discretionary spending caps enacted as part of the recent deal to raise the federal debt ceiling. The nonpartisan CBO said that U.S. budget deficits over the next 30 years will far exceed the 1993-2022 average of 3.7% of GDP, reaching 6.4% in 2033 and 10.0% in 2053. CBO said that outlays for net interest, Social Security, and healthcare programs would continue to rise as a share of economic output as the population ages, while revenues remains largely flat, in the 18-19% range. - US public debt burden to rise to 181% of GDP by 2053, CBO projects - Reuters

Podcasts and Videos:
Identified Flying Objects - The Week Ahead – BMO FICC Podcast
Bank of America CEO Brian Moynihan Talks Consumer Spending – BBG Talks
VIEWS EXPRESSED IN "CONTENT" ON THIS WEBSITE OR POSTED IN SOCIAL MEDIA AND OTHER PLATFORMS (COLLECTIVELY, "CONTENT DISTRIBUTION OUTLETS") ARE MY OWN. THE POSTS ARE NOT DIRECTED TO ANY INVESTORS OR POTENTIAL INVESTORS, AND DO NOT CONSTITUTE AN OFFER TO SELL -- OR A SOLICITATION OF AN OFFER TO BUY -- ANY SECURITIES, AND MAY NOT BE USED OR RELIED UPON IN EVALUATING THE MERITS OF ANY INVESTMENT.
THE CONTENT SHOULD NOT BE CONSTRUED AS OR RELIED UPON IN ANY MANNER AS INVESTMENT, LEGAL, TAX, OR OTHER ADVICE. YOU SHOULD CONSULT YOUR OWN ADVISERS AS TO LEGAL, BUSINESS, TAX, AND OTHER RELATED MATTERS CONCERNING ANY INVESTMENT. ANY PROJECTIONS, ESTIMATES, FORECASTS, TARGETS, PROSPECTS AND/OR OPINIONS EXPRESSED IN THESE MATERIALS ARE SUBJECT TO CHANGE WITHOUT NOTICE AND MAY DIFFER OR BE CONTRARY TO OPINIONS EXPRESSED BY OTHERS. ANY CHARTS PROVIDED HERE ARE FOR INFORMATIONAL PURPOSES ONLY, AND SHOULD NOT BE RELIED UPON WHEN MAKING ANY INVESTMENT DECISION. CERTAIN INFORMATION CONTAINED IN HERE HAS BEEN OBTAINED FROM THIRD-PARTY SOURCES. WHILE TAKEN FROM SOURCES BELIEVED TO BE RELIABLE, I HAVE NOT INDEPENDENTLY VERIFIED SUCH INFORMATION AND MAKES NO REPRESENTATIONS ABOUT THE ENDURING ACCURACY OF THE INFORMATION