


Fed Softens Tone As Hard Data Weakens - MIDDAY MACRO WEEKEND READ – 1/20/2023
Color on Markets, Economy, Policy, and Geopolitics

MIDDAY MACRO WEEKEND READ – 1/20/2023
Overnight and Morning Recap / Market Wrap:
Price Action and Headlines:
Equities are higher, with a notable rally led by Tech/Growth to end the week on an OPEX Friday as Fed officials take a more neutral tone, helping the indexes retrace much of the week’s losses
Treasuries are lower, with the curve steeper on the week as the risk-on tone and weakness in rates markets in EZ has the long-end under the most pressure today
WTI is higher, nearing December highs, as China’s reopening continues to support demand while uncertainty over how geopolitics will affect future supply increases

Narrative Analysis:
The week ended on a more positive note despite earlier losses due to weaker data and growing recessionary fears, with recent earnings and more neutral Fed rhetoric helping the S&P move higher toward its 200-DMA and long-term downtrend resistance level (again). Technology and communication, as well as consumer discretionary and energy sections, were the clear winners, as cost-cutting expectations and higher oil prices, along with lower real rates, led to momentum and growth factors outperforming. The Treasury curve steepened on the week, as the short-end was helped by more dovish commentary from Fed officials who have increasingly aligned views towards a 25bps rate hike at the next meeting. This helped yields fall on the week despite a more hawkish tone out of the ECB last night, pressuring rates there (and spilling over here today), following a balk by the BoJ on changing YCC earlier in the week. Oil continued to rise, helped by China’s reopening, which, despite opaque data, seems to be gaining momentum. This also helped industrial metals, with copper near highs not seen since last summer. The agg complex was slightly lower on the week due to improving weather in South America but remains somewhat range bound. Finally, the dollar continued to weaken, with the $DXY at 102 thanks to a stronger Euro and Peso.
The Nasdaq is outperforming the S&P and Russell with Growth, Small-Cap, and Value factors, as well as Communication, Technology, and Cons. Discretionary sectors all outperforming on the day. The week had a mixed feel but favored growth/tech, although energy outperformed.

@KoyfinCharts
S&P optionality strike levels have the Zero-Gamma Level at 3954 while the Call Wall is 4000 and Put Wall is 3900. Today’s OPEX will see 20-25% of total gamma across SPY/SPX/QQQ expire, which should lead to levels shifting for next week. There was large put buying yesterday at the 3900 level, but today’s lack of follow-through lower and move back to 4000 looks to reset momentum. Coming out of OPEX, things remain murky. It seems clear that 4000 will remain an import overhead resistance area due to the current positioning. On the downside, there are fewer areas of prominence.

@spotgamma
S&P technical levels have support at 3960, then 3945, with resistance at 3990, then 4020. The 3900 zone is extremely important, and it's zero coincidence that we bounced there yesterday. From December 18th to January 6th, S&P was stuck under that 3900 level and building a base. On January 6th, it broke out with force, triggering a 135-point rally over the following week. We retraced this entire rally and back-tested 3900 yesterday. What happens over the next couple of days has major implications for the next trend move in S&P, with today’s rally being a positive sign but the need to stay above the 200-DMA and longer-term downtrend resistance for multiple sessions necessary if the rally has any hopes of renewing.

@AdamMancini4
Treasuries are lower, with the 10yr yield at 3.48%, higher by 9 bps on the session, while the 5s30s curve is steeper by 1 bps, moving to 9 bps.

Deeper Dive:
A week of weaker U.S. economic data and the Fed continuing to stick to its hawkish message has the January rally under pressure, although we are ending the week on an up day. In reality, growing recessionary fears, while certainly warranted, are also needed to allow the Fed to conclude its current policy tightening phase, finally reaching its terminal Fed funds rate level and allowing markets to shift focus to when the inevitable cutting of rates will come. We got a real taste of this from Brainard this week, who laid out a strong case for why inflation had peaked (and would trend back to target over the year), and that the risks to policymakers were considerably more two-sided now. She importantly highlighted that the effective Fed funds level would continue to rise due to ongoing balance sheet reduction (QT) no matter where/when the Fed stopped hiking, inferring that overtightening in light of recent weaker inflation and economic data was a growing risk. As a result, two more 25 bps hikes (now the modal case) will be all that is coming and finally lead the conversation to focus fully on the duration in restrictive territory. We believe that by Q3 ‘23, that conversation will increasingly look towards a December rate cut as inflation is falling faster than expected, labor markets have loosened, and policymakers increasingly worry about overshooting to the downside while unnecessarily giving up gains in employment. Market volatility from debt ceiling proceedings may also exacerbate the conversation. This policy outlook does not mean “risk on,” as it is predicated on growing recessionary fears which will cap sentiment/participation for some time. Still, it should allow risk assets to find some support, especially for equities that could benefit from expanding multiples despite weaker earnings growth expectations (over this year) as real rates and financial conditions stabilize/fall.
The only way risk assets, especially stocks, can continue to rally is if the Fed moves to this next phase (holding policy at a restrictive level) and the slowing of the economy is enough to convince policymakers that the supply and demand balance is moving back to levels needed to drive inflation back to target. We believe we are getting there, given how we see the economy and inflation evolving over the first half of this year due to the lagged effects of the past enacted policy increasingly hitting. However, the majority of Fed officials are still not there despite the growing evidence that inflation is falling fast. Their fear of repeating past mistakes (thank you, Arthur Burns) and the uniqueness of the current inflationary pulse (supply-side driven with still well-anchored expectations) have the tail risk leaning towards an over-tightening of policy. As a result, and as seen in this week’s pullback, recessionary fears continue to grow, and “bad is good” is starting to morph into “bad is bad” as harder data continues to show a loss of momentum into the end of last year (despite expectations for a strong Q4 ’22 GDP print next week) and increasingly in Q1 given what survey data is already showing.

*For the first time since the beginning of the pandemic, more respondents to the BofA Fund Manager Survey think Fed policy is too restrictive

*Manufacturing activity is increasingly contracting, something that does not bode well for the service sector, which usually follows

*There are growing signs that the labor market is meaningfully beginning to cool, with temporary job levels falling and layoffs picking up, although all are still in generally healthy shape
Does a soft landing sound too fanciful? It does, given we have yet to see the full effects of implemented policy, but it's also still happening. Inflation is trending back to target and will likely overshoot to the downside in ‘24. Labor markets are cooling from historically tight levels as firms reduce capacity due to falling demand and greater uncertainty but will remain supportive of consumer activity/confidence for some time. Shelter costs are increasingly falling (with Fed officials discounting the official data given what is being seen elsewhere), and core service inflation (outside shelter) will ease as wage and input costs fall/stabilize. This will allow the Fed to declare victory sooner than expected, reducing the time needed to keep policy in restrictive territory and allowing markets to focus on the end of the current cycle and the beginning of a new one (started with easing around year-end/early ‘24).

*PPI is indicating that there will be a coming fall in core PCE

*Business surveys are showing a reduced demand for workers, indicating wages should have peaked
As we are fond of saying, this has always been about inflation. The Fed is increasingly communicating it will be more marked-to-market data sensitive, and as a result, whether the terminal rate is at 4.75-5% or 5%-5.25% is much less important than how long rates stay there in light of QT. With our belief that inflation will be falling fast this summer (due to shelter dropping along with core x-shelter), UER higher and wage pressures reduced, as well as fiscal cliff uncertainties impacting Treasury markets and reducing confidence, it's hard to see how markets won’t get ahead of the Fed and price in a much quicker pace of cuts in ’24. Markets price forward, and as a result, easier financial conditions, along with improving outlooks for growth in ’24, should allow multiples to expand around summertime even as the economic data and earning seasons are being weighed on by the fuller effects of tighter policy.

*Market-derived inflation expectations continue to fall

*Financial conditions are becoming more supportive, entering into positive territory according to Bloomberg's index
We continue to maintain our mock portfolio positions, believing China’s reopening will support commodities and EM while the current earnings season will be better than expected, supporting U.S. equities. Policy tightening expectations will ease further, helped by a growing deflationary pulse, cooling hard economic data (including labor market readings), and less hawkish Fed rhetoric. However, as seen this week, the market remains volatile, capped by technicals (LT downtrend and 200-DMA), and more range-bound due to optionality/positioning and internal/external rotation. We believe this will slowly change as the earnings picture becomes clearer and further data reinforces our inflation/policy outlook. However, as we have said for some time now, this is very much a tactical trading environment that favors risk discipline.

*The mock portfolio is up 7.5% since inception, with all positions but our nickel and Nasdaq longs in the green
Econ Data:
Retail sales declined by -1.1% in December, following an upwardly revised -1% drop in November and worse than forecasts of a 0.8% fall. Sales at gasoline stations recorded the biggest decrease (-4.6%), followed by furniture stores (-2.5%), motor vehicle dealers (-1.2%), electronics and appliances stores (-1.1%), miscellaneous (-1.1%) and nonstore retailers (-1.1%). Excluding sales at gasoline stations, sales were down by -0.8%. In contrast, sales were up 0.3% in building materials and garden equipment stores. Sales at food and beverage stores and sporting goods, musical instruments, and booksellers were flat.
Why it Matters: Retail sales aren’t adjusted for inflation, which is why they rose 9.2% in ‘22, the second-highest reading going back to 1993. This also explains part of the decrease in December, with the prices of goods, especially gasoline, falling during the month, helped by a holiday shopping season that was pulled forward, leading to a more significant level of discounts towards year-end. The weather was also a factor around Christmas, and when excluding sales at gasoline stations, sales were down by -0.8%. Finally, as an indication that service demand might be more materially slowing, spending at restaurants fell for a second month.

*Adjusted for inflation, total retail sales showed a modest increase in December, although core did fall

*Even when adjusted for inflation, there were notable monthly drops in numerous categories, showing a loss of momentum in consumer spending
Producer prices dropped by -0.5% in December, following a revised 0.2% gain in November and compared with market expectations of a -0.1% fall. Goods prices were down by -1.6%, led by a -7.9% slump in energy costs and, to a lesser extent, a -1.2% fall in food prices. On the other hand, service prices rose by 0.1%, with much of the increase due to margins for final demand trade services rising 0.3%. On an unadjusted yearly basis, the headline PPI increased 6.2% in December, the least since March 2021. The core producer price index rose by 0.1% over the month, after a downwardly revised 0.2% increase in November and in line with market expectations. Year-on-year, core producer prices advanced by 5.5%, the least since May 2021 and less than market forecasts of a 5.7% increase.
Why it Matters: It was the largest headline monthly decline since April 2020, but nearly half of the December decrease in the index for final demand goods can be traced to a -13.4% decline in the price of gasoline. The final demand for services was still positive, helped by a 17.6% jump in margins for fuels and lubricants. At the intermediate demand level, there was a divergence between decreases in processed goods (-2.8%) and unprocessed goods (3.4%), with changes in energy (goods vs. materials) again driving both sides. When you take energy out of the picture, both final and intermediate prices still cooled but saw meaningful increases in transportation services (3%) and unprocessed nonfood materials (6%). However, December’s new data and the general trend in PPI bode well for inflation continuing to fall, although it will be unlikely energy can continue to be such a strong driver of declines in the headline number.
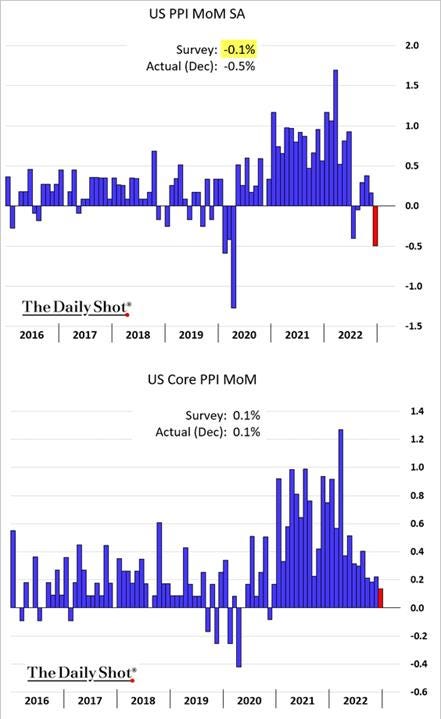
*Big drops in energy and food, to a lesser extent, drove headline PPI much lower while core rose by the least amount since the end of 2020

*Three-month annualized core PPI is now back at 2% as at or below 0.3% monthly gains have continued since June
Industrial production fell by -0.7% in December, following an upwardly revised -0.6% decrease in November and more than market expectations of a -0.1% loss. Manufacturing output dropped by -1.3%, significantly more than expectations for a -0.3% decrease. The indexes for durable and nondurable manufacturing dropped by -1.1% and -1.5%, respectively, while the index for other manufacturing (publishing and logging) fell by -0.9%. Within durables, most major industries posted declines of at least -1%, with machinery and wood products recording the most significant declines, at -3.4% and 2.1%, respectively. Within nondurables, the indexes for all major industries declined, with the indexes for printing and support and petroleum and coal products contracting more than -3%. Mining was down by -0.9%, while utilities rose 3.9%, driven by increases for both electric and natural gas utilities. Capacity utilization dropped by -0.6 percentage points to 78.8%, a rate that is 0.8 percentage points below its long-run (1972–2021) average.
Why it Matters: It was the biggest drop in industrial activity since September 2021, with all major market groups, except defense and space equipment, decreasing for a second consecutive month in December. Business equipment recorded the largest drop (-2.0%), followed by construction supplies (-1.4%) and business supplies (-1.3%). Overall, it was a broad slowdown outside consumer goods, which was little changed on the month, and Utilities, which were helped by the weather.

*There was a broadening slowdown in industrial production in Q4, with a decrease of -1.7% on an annual basis

*Capacity utilization also fell, supporting readings of reduced workweeks and falling backlogs of orders seen in manufacturing surveys
Housing starts fell by -1.4% to 1.382 million SAR in December, the lowest level in five months, but above market forecasts of 1.359 million. Single-family starts rose by 11.3%, while multi-unit starts dropped by -18.9%. Starts were lower in the Midwest (-37.4%), the West (-9.5%), and the South (-4%) but jumped 135.6% in the Northeast. Building permits fell -1.6% to 1.33 million SAR in December, the lowest level since May 2020 and below market expectations of 1.37 million. Single-family declined by -6.5%, while the volatile multi-segment rose by 5.3%. Permits were down in the South (-1.7%), Midwest (-15.6%), and Northeast (-2.5%) but were up in the West (9.3%).
Why it Matters: December marks a fourth consecutive month of falling housing starts, pushing the 2022 drop to -3%, the first yearly decline since 2009. At the same time, building permits also continue to fall, but the amount of overall properties under construction is still at a record high. This means supply is still increasing while demand continues to face headwinds, likely meaning further price drops are coming for some time.

*Single-unit is taking it the hardest due to historically poor affordability and a slowly improving supply/demand imbalance, while multi-unit activity is still benefiting from the still strong rental market activity

*Multi-unit units under construction hit another record high
The NY Fed’s Empire State Manufacturing Index sank to -32.9 in January, the lowest reading since May of 2020, from -11.2 in December, and well below market forecasts of -9. The reading pointed to the fifth worst contraction ever in business activity in the NY region. New Orders (-31.1 vs. -3.6 in December), Shipments (-22.4 vs. 5.3), and Unfilled Orders (-14.3 vs. -11.2) showed measures of demand/activity contracted significantly. Delivery Times (0.9 vs. 1.9) held steady, while Inventories (4.5 vs. 3.7) edged higher. Employment (2.8 vs. 14) moved close to neutral, while the Average Workweek (-10.4 vs. -4.5) fell further. Prices Paid (33 vs. 50.5) fell notably, and Prices Received (18.8 vs. 25.2) also continued to fall. Looking ahead, firms saw a slight improvement in their General Business Conditions as New Orders and Shipments rose while Prices and Employment fell. Capex and IT spending were little changed and higher, respectively.
Why it Matters: Despite a historically massive drop in the headline current index, all hope is not lost, given the mildly better six-month ahead outlook. This was best seen in improving expectations for demand, and still expansionary Capex/IT plans. The current supply-side pressure measures, seen in delivery times, price, and employment sub-index measures, all improved regarding future inflationary pressures falling further on top of the clear declines in current demand measures. The Empire State survey has been volatile in the past, and it is our belief that the outsized drop was an anomaly, but it certainly is eye-opening and likely forebodes a further drop in the ISM manufacturing PMI.

*The headline index is back below recent lows due to large drops in demand measures, but all subindexes outside inventories fell

*Employment measures cooled notably in December as firms are more neutral with hiring intention and are reducing their average workweek

*Although still historically elevated, both prices paid and received continue to drop, falling again after a rebound in November
The Philadelphia Fed Manufacturing Index rose to -8.9 in January from a revised reading of -13.7 in December, compared to market expectations of -11. More than 33% of the firms reported declines in activity, exceeding the 24% that reported increases. The sub-index measures for New Orders (-10.9 vs. -22.3 in Dec) and Shipments (-0.9 vs. 11.1) rose from last month but remained negative/contractionary. Unfilled Orders (-19.2 vs. -14.1) showed backlogs continued to contract along with Delivery Times (-5.6 vs. -7.2). Employment measures expanded with the Number of Employees (10.9 vs. -0.9) and Average Workweek (4 vs. -6.6), rebounding from contractionary territory last month. Prices Received (29.9 vs. 28.1) rose slightly, while the Prices Paid (24.5 vs. 36.3) fell notably. Future indicators mainly remained positive but broadly moved closer to neutral, with the future general activity index rising to 4.9 from -0.9 in December. Almost 38% of the firms expect increases in future activity, 33% expect decreases, and 26% expect no change.
Why it Matters: Despite the slight improvement in the headline reading, it was still the fifth consecutive negative reading and the seventh negative reading in the past eight months. There was a notable increase in shipments and employment measures back into positive territory. Further contractions in unfilled orders, delivery times, and prices paid bode well for continued downward pressure on inflation despite a stabilization in prices paid. Future readings were mixed but, in general, moved to more neutral readings, with demand remaining positive and supply-side measures contracting further. In the month’s special questions, the firms were asked about changes in their various input and labor costs over the past year and their expectations for changes in costs for the coming year. For all categories, the average percent change in costs expected for 2023 was smaller than the average percent change in costs reported for 2022. The respondents were also asked to rank the importance of various factors in setting prices. Demand for their own goods/services was the most important factor, followed by maintaining steady profit, wage and labor costs, and nonlabor costs.

*There was an uptick in both current and future general activity indexes, with the future back in expansionary territory

*…however, it was a mixed bag between changes in current and future expectations…

*Prices paid dropped while received slightly increased. Future expectations fell notably for both
Policy Talk:
Again, numerous Fed officials were speaking this week (Williams, Bostic, Bullard, Logan, Brainard, George, Waller, Harker, and Collins), and the message continued to be generally the same. However, an increasing number of officials seem satisfied with the effects of already implemented policy and are taking a more cautious tone, highlighting the need to move slower and be more two-sided in risk management thinking. This means a still greater emphasis on incoming data. Brainard gave the most dovish speech but surprisingly got less attention than expected, while Bullard, Waller, and George continued to indicate a much higher than market-derived terminal rate was still in the cards. Brainard effectively laid out a number of “mission accomplished” points, highlighting FCI was not too loose, shelter costs had clearly peaked, and core services x-shelter followed core goods historically. As a result, it wasn’t necessary to tighten above 5%, something every other speaker said was still in the cards, nor did labor markets have to ease much, something she saw already occurring and has other Fed officials more split on.
Vice Chair Brainard gave prepared remarks titled “Staying the Course to Bring Inflation Down” at the University of Chicago. Brainard’s speech should have been titled “job basically done,” as she concluded by saying prices were trending lower, wage growth was decelerating, and margins were likely to compress further, removing any possibility of a 1970’s style inflationary situation given that the full effects of tighter policy have yet to even fully hit. She broadly covered all the various reasons why it is now appropriate to slow the size of rate hikes and take a more two-sided approach to risk management regarding the Fed’s dual mandate. More importantly, she indicated she does not believe labor markets need to meaningfully weaken to get inflation back to target. This dovish speech made a strong case for why the Fed is close to stopping its rate hikes.
“…the drag on U.S. growth and employment from monetary policy is likely to increase in 2023 because of transmission lags from the rapid, large swing from accommodation to restraint in 2022... there is uncertainty about the timing and magnitude.”
“Recent declines in average weekly hours, temporary-help services, and monthly payrolls growth suggest tentative signs that labor demand is cooling. Employment at temporary-help services firms—a good leading indicator—peaked in July 2022 and has been declining since then, ending the year only slightly above its December 2019 level.”
“Despite constrained supply, wages do not appear to be driving inflation in a 1970s-style wage–price spiral… in the aggregate, the gains among lower-wage workers were more than offset by real wage declines among middle- and higher-wage workers in the context of a broader compression in the real wage distribution.”
“…rents based on new leases are decelerating sharply. Although it is currently offset by a catch-up in renewing leases, the decline in rent on new leases will show through to average rent over time, and declines in housing services inflation are expected by the third quarter of this year.”
There is some recent evidence that the persistent components of inflation in core goods and nonhousing services, particularly transportation, recreation, food services, and accommodation, have behaved similarly, peaking around early 2022 and steadily declining since then.
“the evidence from market- and survey-based measures suggests that longer-term inflation expectations are well anchored, while year-ahead measures have recently declined but remain elevated.”
“the price trends in core goods and nonhousing services, the tentative indications of some deceleration in wages, the evidence of anchored expectations, and the scope for margin compression may provide some reassurance that we are not currently experiencing a 1970s‑style wage–price spiral. For these reasons, it remains possible that a continued moderation in aggregate demand could facilitate continued easing in the labor market and reduction in inflation without a significant loss of employment.”

NY Fed President Williams gave a speech titled “Shifting Gears: Rebalance and Realignment in the Economy” at the Fixed Income Analysts Society in New York, where he discussed inflation, the continued imbalances between supply and demand, and the effects that monetary policy is having on the economy. Apparently, Williams needs to talk in metaphors, moving from peeling onions to turning gears this time. He indicated that tighter monetary policy is increasingly having the intended effects. However, it would still take time for service inflation to trend back to target convincingly, although he highlighted that was now well underway in goods inflation and likely coming for shelter costs. He ended by saying the Fed must keep going, indicating he favored more rate hikes but eluded that there remained great uncertainty, and in the context of the rest of the speech, this meant he favored moving slower.
“…effects of monetary policy are showing up in prices at different speeds. For example, the prices of globally traded commodities have already declined and are now well below the levels we saw earlier last year. This reflects in part the effects of lower demand resulting from tighter monetary policy here and abroad.”
“One of the biggest drivers of the rise in inflation for services has been shelter costs, which soared as demand for housing increased during the pandemic. Recent data for newly-signed leases indicate that the tide is turning on rents, and we should see shelter cost inflation start to slow later this year. That said, inflation for other services besides shelter has remained high, and this gear is only starting to turn.”
“Bringing inflation down is likely to require a period of below-trend growth and some softening of labor market conditions.”

Boston Fed President Collins spoke at a Boston Fed-hosted “Housing, Place, and Flexible Work: The Future of the New England Economy” conference this week giving prepared remarks in a speech titled “The National and Regional Economy: Navigating Near-term Changes and Long-term Challenges.” Collins gave an overview of her views on inflation and policy, highlighting the progress that has been made and the need to slow down future rate hikes, becoming more data-dependent to properly weigh the risks of doing too little or too much. The bulk of her speech focused on the New England economy, particularly its workforce, and what can be done to strengthen it further. This conference would fall under the S regarding the Fed’s ESG-flavored events but did confirm that Collins was firmly in the 25 bp camp heading into the next FOMC meeting.
“We are starting to see some effects of the cumulative policy actions the FOMC has taken so far. Less demand (from higher interest rates), combined with lower input costs (from easing supply bottlenecks), are contributing to noticeably slower inflation for goods – with the prices for some goods actually declining.”
“monetary policy tightening has slowed new rent growth considerably, which should lead to a moderation in shelter inflation starting in the spring of this year. For services outside of shelter, labor tends to be the most important input – so developments in this component of services inflation are ultimately tied to the behavior of wages.”
“Now that rates are in restrictive territory and we may (based on current indicators) be nearing the peak, I believe it is appropriate to have shifted from the initial expeditious pace of tightening to a slower pace – though the appropriate policy will, of course, depend on a holistic review of available data.”

Technicals and Charts:
Four Key Macro House Charts:
Growth/Value Ratio: Growth is higher on the day and the week, and Large-Cap Growth is the best-performing size/factor on the day.

Chinese Iron Ore Future Price: Iron Ore futures are higher on the day and the week.

5yr-30yr Treasury Spread: The curve is steeper on the day and the week.

EUR/JPY FX Cross: The Euro is stronger on the day and the week.

Other Charts:

“.. the S&P 500 has not managed to close above the 200D for more than two consecutive business days. And until equities move and close decisively higher, investors remain cautious on equities -- a ‘show me’ situation.” - @fundstrat

The percent of stocks above 200-day MAs looks structurally bullish, according to BofA Analyst Suttmeier.

Expected real rates seem to lead the dollar by about 3m, while this hasn't been a perfect indicator, based on this, we could see a slight reversal to the upside for the dollar relative to other currencies broad nominal dollar index shows similar. - @deerpointmacro

Investors are the most underweight on U.S. equities since 2005 as improving market sentiment sends them flocking toward cheaper regions, according to Bank of America’s global fund manager survey.

Participants in the January poll were “a lot less bearish” than in the fourth quarter, sparking a rotation to emerging markets, Europe, and cyclical stocks, away from pharmaceuticals, technology, and the U.S.

The fiscal and financial conditions drag on growth will ease this year.
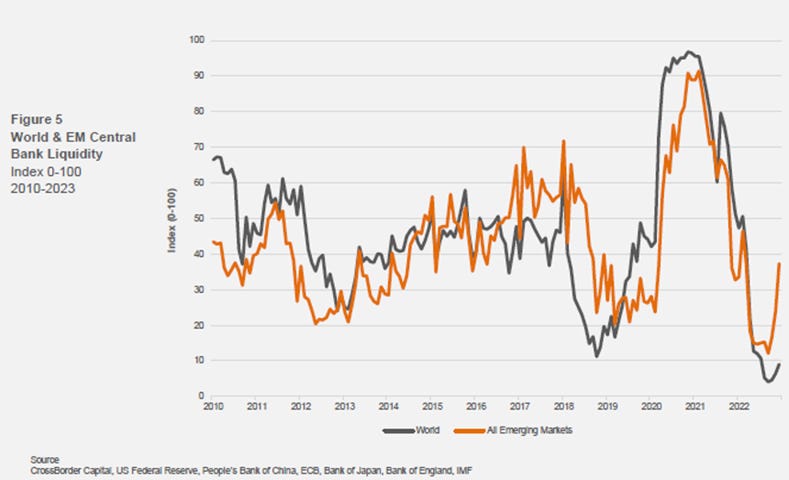
Despite the Fed now being well into QT mode, global liquidity has risen recently. That’s in part because the BOJ has felt obliged to buy bonds in massive quantities, while the PBOC has also contributed. CrossBorder Capital’s index appeared historically tight only weeks ago. Now it looks like the expansion is on again, prompting CrossBorder’s Mike Howell, previously bearish about markets’ prospects on the basis that liquidity was draining away, to head his latest note: “When the facts change...” - @crossbordercap

TS Lombard nicely illustrates that steady credit easing throughout the year did nothing to stop the fall in the price of Chinese stocks and in the price of copper, but both turned upward once Covid reopening commenced. - @TS_Lombard

First up, First down, as the lower-wage workers who received the highest bumps in pay mainly due to shortages in the service sector are now first to see a slowing in wage growth.

Homebuilders are increasingly cutting costs, existing home prices continue to fall, and mortgage rates are well off highs…

…but affordability is nowhere near where it was before the pandemic

With the picture in China still very opaque, some indications that normality is beginning to return are beginning to emerge in various measures of transit/mobility data
Article by Macro Themes:
Medium-term Themes:
Labor Markets Loosening:
Labor’s Leverage: The tight labor market has given workers more leverage over their employers and led to renewed interest in labor unions. However, the share of U.S. workers who are members of unions fell to a record low last year even though unions added more members than in any year since 2008 following union elections at workplaces including Starbucks., Amazon, and Apple. About 10.1% of wage and salary workers were union members last year, down from 10.3% in 2021, according to the Labor Dept. Workers engaged in more strikes and work stoppages, launching 22 strikes last year involving more than 1,000 workers, the most since 2019. - Union Membership Rate Hits Record Low Despite Votes at Apple, Amazon, Starbucks – WSJ

China’s Pandemic:
Abysmal Growth: China’s economy expanded by 3% in 2022, a sharp slowdown from the 8.1% pace recorded in 2021. Aside from 2020, when the economy grew only 2.2%, last year marked the worst year for gross domestic product growth in China since 1976. Demand for Chinese exports is sinking as the global economy slows. Consumer confidence is on the floor after three years of sporadic lockdowns. Many economists worry that scarring from the pandemic, in the form of vanished jobs and closed businesses, may take time to heal. - China’s Economic Growth Fell to Near-Historic Lows as Covid Took a Bite – WSJ

Half-On Bailout: Chinese financial regulators and the nation’s biggest bad-debt management companies plan to offer as much as 160 billion yuan ($24 billion) of refinancing support to “high-quality” developers in the first quarter. The loans add to a number of other measures issued since November to arrest the slump in China’s property market. Regulators are ramping up financial support to systemically important developers while lowering mortgage rates and down payment requirements to boost demand. - China Bad-Debt Firms Plan Property Aid of Up to $24 Billion - Bloomberg

Longer-term Themes:
Energy’s Midlife Crisis:
Demand > Supply: China’s rapid shift to reopen its economy following lengthy Covid-19 lockdowns should help oil demand rise to a record level this year, the International Energy Agency recently said. In its report, the IEA also pointed to a “somewhat improved economic outlook,” mainly in the U.S. and Europe, as well as lower oil prices, as driving the upward revisions to its oil demand forecasts. The energy watchdog lifted its forecast for oil demand growth this year by nearly 200K barrels a day to 1.9 million barrels a day. The extra demand means that the IEA now expects total oil demand this year to average 101.7 million barrels a day, well above pre-Covid levels and a record amount. -
Oil Demand to Hit Record Level This Year as China Reopens, IEA Says – WSJ

OPEC Green.0: China refines 95% of the world’s supply of cobalt, a metal used in lithium-ion batteries. It manufactures over 70% of sicilia-based solar photovoltaic modules and is home to three-quarters of global electric-vehicle battery production capacity. China dominates the manufacturing of renewable-energy technologies today due to years of generous subsidies and access to cheap power, labor, and land. The Chinese government first identified clean energy as strategically important more than a decade ago. Between 2018 and 2022, Beijing’s share of global investment in new factories for clean-energy products such as solar panels and wind turbine components held steady at 80%. - OPEC Cartel Has Nothing on China’s Clean-Energy Monopoly – WSJ

Cyber Life and Digital Rights:
The National Security Agency and U.S. Cyber Command want Congress to renew Section 702 of the Foreign Intelligence Surveillance Act (FISA), which is set to expire this year. Section 702 allows the NSA to warrantlessly eavesdrop on foreign targets, albeit in a way that sometimes sweeps up communications from Americans the targets are talking to (known as “incidental collection”). Broad examples of why this is necessary include the discovery of attempts to steal sensitive U.S. technology, stopping the transfer of weapons components, preventing cyberattacks, and “understanding the strategic intentions” of China and Russia. Civil liberties advocates appearing alongside Nakosone argued that Section 702 amounts to an immense violation of U.S. citizens’ privacy. - NSA director pushes Congress to renew surveillance powers - CBS
The Coming Crisis: A catastrophic cyberattack could occur within two years, given rising global instability, the World Economic Forum and consulting firm Accenture said in a new report. Researchers surveyed and interviewed 151 organizational leaders. Among business leaders, 86% said such an event is moderately or very likely by 2025. Among cybersecurity leaders, 93%. Nonetheless, cyber leaders still struggle to articulate clearly the risk that cyber issues pose to their organizations in a language that their business counterparts fully understand and can act upon. The report presents the results of a study on how cybersecurity and business leaders’ perspectives on leading cyber issues and examines how they affect organizations around the world. - Global Cybersecurity Outlook 2023 from World Economic Forum

Food: Security, Innovations, and Climate Change Implications:
CRISPR Fish: Millions of fish are farmed every year, but many of them die from infections. In theory, genetically engineering fish with genes that protect them from disease could help to address the issue. A team of scientists has attempted to do just that, inserting an alligator gene into the genomes of catfish. The alligator gene contains an antimicrobial component, which could make animals that have the gene artificially inserted into their genomes more resistant to diseases. Did it work? The resulting fish do seem to be more resistant to infections. But while the scientists hope to eventually get their transgenic catfish approved so that it can be sold and eaten, they’re facing a long and complicated process. - These scientists used CRISPR to put an alligator gene into catfish – MIT Tech Review
 and a genetically modified catfish next to a natural catfish and a ruler (right)")
Authoritarianism in Trouble?:
No Energy: New Zealand Prime Minister Jacinda Ardern announced she is stepping down in a shock resignation ahead of a general election later this year. The unexpected announcement brings the curtain down on a stunning political career that saw Ardern navigate unprecedented crises and become a torch-bearer for liberal values on the world stage. She was facing an uphill battle to win a third term in office, with Labour trailing the opposition National Party in opinion polls. Her resignation also highlights how taxing it is to be a leader and the importance of turnover. - New Zealand Prime Minister Ardern Announces Shock Resignation - Bloomberg

Xi Who?: The last thing anyone expected from a strongman president entering his 11th year in power was a sudden about-face. Yet within weeks, Xi’s government has reversed its efforts to control Covid-19, Big Tech companies, the property market, and more. It has shown signs of reduced support for Russia’s war in Ukraine while easing tensions with the U.S. and in its territorial disputes in the South China Sea. This softening seemed so uncharacteristic of Xi, but recent weakness in growth and high levels of unrest due to zero-Covid seems to have forced his hand. - The Xi nobody saw coming – FT

Rinse and Repeat Tactics: It is hard to avoid a sense of déjà vu when supporters of Jair Bolsonaro stormed major federal institutions in the capital Brasília insisting that Brazil’s 2022 presidential election was “stolen,” driving demonstrators to ransack Congress, the presidential palace, and other key government buildings. There was nothing accidental about the similarities between these two attacks on democracy. Right-wing populists in multiple countries, including Brazil, have drawn inspiration from Trump’s brazen political manner. But the transnational connections among right-wing populist movements extend beyond the circulation of styles and ideas, with these groups now taking cues from and providing support for one another. - The Vexing Rise of the Transnational Right – Foreign Affairs

ESG versus the World:
Damned if You Do: BlackRock’s CEO Larry Fink said the narrative around ESG investing has become ugly and is creating “huge polarization.” Fink has been outspoken about investing with environmental, social, and governance goals, making it a focal point in his annual letters to the industry. The firm has become a political punching bag from forces on both ends of the spectrum, with some on the right alleging its policies harm the fossil-fuel industry and others on the left arguing it’s not doing enough to respond to climate change. - Larry Fink Says ESG Narrative Has Become Ugly, Personal – Bloomberg

Asian Tigers 2.0:
FDI Battleground: Corporate Japan has poured so much money into Thailand that it has created a leading regional motor manufacturing center. For example, Toyota employs 275K people in Thailand. By some estimates, it accounts for 4% of the country's gross domestic product. Altogether, Japan accounted for 32% of FDI into Thailand as of March 2022, by far the largest slice. But structural changes in the car industry, and in the global economy generally, are posing tough questions about Japan's relationship with Thailand. In particular, the rise of China and its increasingly ambitious electric vehicle makers have presented Japan with its first serious rival in a country that calls itself the Detroit of Southeast Asia. - Thailand's auto industry becomes a Japan-China battleground - NikkeiAsia

Cold Places (Deep Sea, Artic, and Space Colonization):
Framework Agreement: The United States and Japan signed an agreement to enable further cooperation between the two countries in space exploration, but without announcing any new initiatives. “The U.S.-Japan space cooperation has entered a new era with the Artemis project, and many projects, including lunar activities, are already in the works by Japanese and U.S. astronauts,” Japanese PM Kishida said at the ceremony. “I strongly hope that this agreement will robustly promote our space cooperation even further and also further expand the field of cooperation under the Japan-U.S. alliance.” - United States and Japan sign space cooperation framework agreement - SpaceNews

VIEWS EXPRESSED IN "CONTENT" ON THIS WEBSITE OR POSTED IN SOCIAL MEDIA AND OTHER PLATFORMS (COLLECTIVELY, "CONTENT DISTRIBUTION OUTLETS") ARE MY OWN. THE POSTS ARE NOT DIRECTED TO ANY INVESTORS OR POTENTIAL INVESTORS, AND DO NOT CONSTITUTE AN OFFER TO SELL -- OR A SOLICITATION OF AN OFFER TO BUY -- ANY SECURITIES, AND MAY NOT BE USED OR RELIED UPON IN EVALUATING THE MERITS OF ANY INVESTMENT.
THE CONTENT SHOULD NOT BE CONSTRUED AS OR RELIED UPON IN ANY MANNER AS INVESTMENT, LEGAL, TAX, OR OTHER ADVICE. YOU SHOULD CONSULT YOUR OWN ADVISERS AS TO LEGAL, BUSINESS, TAX, AND OTHER RELATED MATTERS CONCERNING ANY INVESTMENT. ANY PROJECTIONS, ESTIMATES, FORECASTS, TARGETS, PROSPECTS AND/OR OPINIONS EXPRESSED IN THESE MATERIALS ARE SUBJECT TO CHANGE WITHOUT NOTICE AND MAY DIFFER OR BE CONTRARY TO OPINIONS EXPRESSED BY OTHERS. ANY CHARTS PROVIDED HERE ARE FOR INFORMATIONAL PURPOSES ONLY, AND SHOULD NOT BE RELIED UPON WHEN MAKING ANY INVESTMENT DECISION. CERTAIN INFORMATION CONTAINED IN HERE HAS BEEN OBTAINED FROM THIRD-PARTY SOURCES. WHILE TAKEN FROM SOURCES BELIEVED TO BE RELIABLE, I HAVE NOT INDEPENDENTLY VERIFIED SUCH INFORMATION AND MAKES NO REPRESENTATIONS ABOUT THE ENDURING ACCURACY OF THE INFORMATION