

Fed Likely Maintains Three Cuts Forecast in 2024 Due to Softer "Supercore" PCE and Looser Labor Market Readings - Midday Macro – 3/15/2024
Fed Likely Maintains Three Cuts Forecast in 2024 Due to Softer "Supercore" PCE and Looser Labor Market Readings - Midday Macro – 3/15/2024
Color on Markets, Economy, Policy, and Geopolitics

Fed Likely Maintains Three Cuts Forecast in 2024 Due to Softer "Supercore" PCE and Looser Labor Market Readings
Midday Macro – 3/15/2024
Market’s Weekly Narrative:
Although ending on a weaker note, the S&P is still slightly higher on the week, outperforming the Nasdaq and Russell, with large-cap growth the best-performing size/factor. Energy, materials, and financials were the best-performing sectors, with real estate notably lower on the week. Today’s OPEX is rather large, possibly the largest for single-name calls, and with the gamma neutral corridor very tight, trading ranges should open up further into next week’s March FOMC meeting. Markets and the Fed finally seem to be in sync after this week’s hotter headline inflation data, both forecasting 75 bps of cuts this year. Of course, the debate on whether this is correct and when it will start has only intensified after CPI and PPI ran hotter than expected. However, supercore measures fell from January highs, while PPI “other” service and trade margin price moves indicated disinflationary progress hadn’t stalled too much. Further, core import prices were flat despite rising at the headline level due to energy costs increasing. Despite this, Treasuries had a tough week, with 10-year yields higher by more than 20bps on the week as auction supply and hotter inflation data, as well as buy-side liquidations, caused a notable sell-off that didn’t material move the curve too much. Turning to the economic data outside of the three inflation reports, the NFIB small business survey continued to worsen, with hiring and pricing power worsening. Industrial production rebounded in February as business equipment and capital goods overcame weakness in consumer goods demand. The Empire State Manufacturing Survey dropped violently again, retracing February gains with weaker demand and activity readings but no material improvement in inflation measures. Today’s consumer confidence out of the University of Michigan was little changed as consumers look to pause recent optimism, while the NY Fed’s consumer survey showed similar results.

Oil is higher on the week due to declining U.S. stockpiles for the first time in seven weeks and Ukrainian drone strikes on Russian energy infrastructure. The IEA slightly raised its demand outlook while also cutting its supply forecast. With crack spreads rising again, refinery utilization is also increasing, but gasoline was still higher on the week. Chinese top copper smelters came to a rare agreement to jointly embark on production cuts after copper output increased by 9% in the first two months of the year. It’s a little unclear what to make of this and how true it is, but it helped copper continue to trend higher despite iron ore again falling during the week as worries continue over property developers in China. The agg index was higher on the week, although corn, wheat, and bean futures trended more sideways. Finally, the dollar was higher, supported by the rise in nominal yields and real rates, moving the $DXY to 103.4. weakness in currency pairs was broad-based, although the Euro was relatively unchanged on the week.

Headlines:

Deeper Dive:
There is a growing level of uncertainty in markets heading into the Fed’s March FOMC meeting. On the one hand, last week’s labor market data showed a better balance in demand and supply, increasing policymaker's confidence that wage growth was slowing to a non-inflation accelerating level. Lower job openings and quits and higher levels of layoffs are indicating weaker labor bargaining power moving forward. Add in the continual barrage of regional PMI surveys, two ISM PMI reports, the Beige Book, and the NFIB Small-Business survey all pointing to reduced employment demand, more available skilled workers, and decreasing compensation plans, and it is clear that labor markets are cooling. On the other hand, this week’s inflation data came in stronger than expected at the headline level, reinforcing the idea that the final disinflation mile will be the hardest. As a result, although the majority of market participants still expect next week’s new SEPs to forecast 75bps of rate cuts this year, there is certainly a greater chance that a cut will be removed. More likely, the number of rate cuts in 2025 will be reduced, leading to a hawkish interpretation of the March FOMC results despite what the official statement or Powell says. We are less confident that the Fed will yet tilt more hawkishly, given what we saw in the belly of this week’s inflation data and the general slowing in economic activity. With energy and shelter driving the majority of the increase in CPI and core-services ex-shelter falling from unusually high January readings, the headline beats are less alarming. The breadth of items increasing in price also reversed. If you subscribe to labor markets further loosening, then disinflationary progress should resume in the coming months, increasingly driven by core services ex-shelter. Further, PPI elicited an outsized move in rates, but trade margins cooled while final and intermediate demand service costs both rose at reduced rates. The move higher in yields instead looked to be exacerbated by the unwinding of longs from a buy-side shop reducing PM headcount. Instead, the headline beat came from energy and, to a lesser extent, core goods. Finally, today’s February core import price data was flat, with energy again contributing to the overall headline gains while non-fuel imports barely increased. In summary, the “totality” of the jobs and inflation data over the last two weeks do not signal that the disinflationary progress experienced in the second half of last year will not continue, in our opinion, after a bumpy start to a seasonally messy period that also had detrimental weather effects.

*The market is finally aligned with the Fed on 75bps of cuts this year

*CPI and PPI point to a weaker supercore PCE reading

*CPI rent and OER measures have increasingly diverged from Zillow’s observed rent index
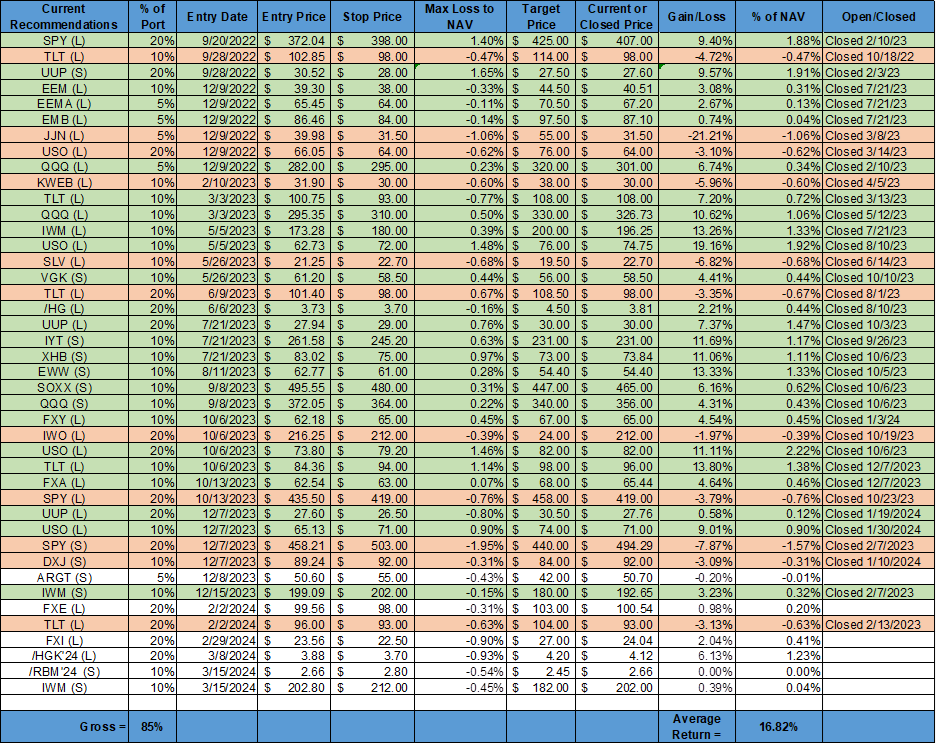
Stepping back, the Fed does need to make a decision next week on how it wants to telegraph its intentions for policy over the rest of the year. Although the Fed will never admit it, it does have political considerations weighing on it this election year. Not going over the summer with cuts would mean waiting until after the election or risk looking political. As Powell made clear during his testimony on the Hill, the FOMC is not fully convinced that inflation will return to target in a timely manner yet, but “is getting close.” The resilience of the consumer, significantly less rate-sensitive than thought at the beginning of the cycle, is allowing for a level of purchasing power that means costs can continue to be passed on. Data indicates that consumers are becoming more price-sensitive, but discretionary spending has yet to materially weaken enough to give the Fed the confidence it needs to commence its rate-cutting cycle. Even with retail sales trending lower, higher frequency credit card data continues to show robust spending. Furthermore, household balance sheets remain historically strong, and although excess savings have normalized for lower-income cohorts, upper-middle-class consumers, who drive the bulk of spending, are still in healthier shape than before the pandemic. A loosening of labor markets will weigh on this more positive sentiment, and the stalling of consumer confidence/sentiment readings lately certainly reinforces the idea that a more cautious approach to spending is already occurring. We believe this continues moving forward, and in conjunction with a slowdown in the more rate-sensitive business investment side, overall growth begins to move to a below-trend period in the next three quarters. As a result of these views (which are not new and have been wrong), we are adding two new positions to our mock portfolio this week. We want to short gasoline through the June RBOB futures contract. We will cover the reasons in further detail next week, but at the highest level, the frigid weather and maintenance period that reduced supply has now ended, and wider crack spreads are enticing greater production. Although geopolitical risk remains high, we see a supply surplus in the coming months and the potential for a weaker driving period this summer, which will reduce implied demand. Finally, we want to re-enter our short small-cap position through the iShares Russell ETF, $IWM. We see growth slowing, cost pressures not meaningfully falling, and pricing power weakening. This week, the NFIB small business owner survey continued a trend of weaker readings, and the outlook for small-sized core American businesses moving forward seems more challenging every day. Both of these positions also reflect a view that a weaker consumer is coming due to a looser labor market, increasing uncertainty and reducing discretionary spending. Again, we will expand more on both of these positions next week, so tune in at the same macro time, same macro channel.

*Despite bullish comments on the consumer from Mastercard and Visa CEOs recently, core retail sales indicate slowing consumer activity

*Weaker data in the last few weeks have begun to move the Atlanta Fed GDPNow tracker for Q1 more notably lower
As always, thank you for reading, and please share our newsletter if you like it and know others who may enjoy it. Please feel free to reach out with any questions or comments. – Michael Ball, CFA, FRM
Policy Talk:
The New York Fed’s February Survey of Consumer Expectations showed inflation expectations for the year ahead remained steady at 3%, the same as in the previous two months, and holding at three-year lows. Consumers anticipate a slight increase in gas prices, while inflation expectations remained unchanged for food at 4.9% and homes at 3%. Inflation is expected to decline notably for medical care (-1.8 percentage points to 6.8%, the lowest reading since September 2020), and slightly for college education (-0.1 percentage point to 5.8%), and rent (-0.3 percentage point to 6.1%, the lowest since December 2020). Meanwhile, inflation expectations for the next three years rose to 2.7% from 2.4% and for the five-year to 2.9% from 2.5%. Inflation uncertainty declined at the one and three-year ahead horizons and increased at the five-year ahead horizon. Expected earnings growth was unchanged at 2.8%, while unemployment expectations decreased to the lowest reading since February 2022. The perceived probability of losing one’s job and voluntarily leaving one's job increased, while the perceived probability of finding a job declined. Expected growth in household income remained unchanged at 3.1%, remaining in a tight range, while spending growth over the next year increased slightly to 5.2%. Perceptions of credit access deteriorated, with more respondents reporting tighter credit conditions currently and expecting it to worsen. Perceptions about households’ current financial situations deteriorated slightly, while year-ahead expectations also deteriorated marginally, with a smaller share of respondents expecting to be better off and a slightly larger share of respondents expecting to be worse off a year from now.
Key Takeaways: Inflation expectations were mixed, with one year ahead remaining at cycle lows despite an uptick in gas. However, expectations for longer-term inflation levels were higher, even as uncertainty fell. Lower income was more worried about their jobs but indicated a greater likelihood of quitting. This group also increased spending plans, showing the data does not clearly show an improving or worsening sentiment among that income bracket. Views on credit access worsened. Finally, more respondents thought interest rates and stock markets would be higher.

*Changes in inflation expectations were mixed
The Atlanta Fed's Wage Growth Tracker was 5.0% in February, the same as for January. For people who changed jobs, the Tracker in February was 5.3%, down from 5.6% in January. For those not changing jobs, the Tracker was 4.7%, unchanged from January.

*Atlanta Fed Wage Tracker contineus to trend lower
U.S. Economic Data:
The Consumer Price Index increased by 0.4% in February, compared to 0.3% in January and matching forecasts. The annual rate increased to 3.2% from 3.1% in January and above forecasts of 3.1%. Core CPI also increased by 0.4% MoM, the same as in January, above market expectations of 0.3% MoM. The annual core CPI rate declined to 3.8% in February from 3.9% in January, above market forecasts of 3.7%. Food prices were flat (vs. 0.4% MoM in Jan), with food at home unchanged (vs. 0.4% MoM) and food away from home increasing slightly by 0.1% MoM (vs. 0.5% MoM). Energy prices increased by 2.3% MoM (vs. -0.9% MoM), with gasoline rising by 3.7% MoM (-3.3% MoM), while energy services increased by 0.8% MoM (vs. 1.4% MoM). Core goods increased by 0.1% MoM (vs. -0.3% MoM), driven higher by increases in used vehicles (0.5% MoM vs. -3.4% MoM), apparel (0.6% MoM vs. -0.7% MoM), and medical care goods (0.1% MoM vs. -0.6% MoM). New vehicles declined slightly by -0.1% MoM (vs. 0% MoM). Core services increased by 0.5% MoM (vs. 0.7% MoM). Shelter increased by 0.4% MoM (vs. 0.6% MoM). Transportation services increased at a greater pace, rising 1.4% MoM (vs. 1% MoM), while medical services declined by -0.1% MoM (vs. 0.7% MoM). “Supercore” CPI increased by 0.47% MoM.
Key Takeaways: Headline CPI increased by the highest monthly rate in five months, with shelter and gasoline contributing over 60% of the monthly increase. The shelter index, accounting for roughly two-thirds of the total 12-month increase in core CPI, decreased to a 5.7% increase in February on an annualized basis, slowing from a 6% rise in the prior month. Prices softened for recreation (+2.1% vs. .+2.8%) and personal care (+4.2% vs. +5.3%), more discretionary items, but continued to rise significantly for motor vehicle insurance (+20.6%, as in January) and to a lesser degree medical care (+1.4% vs. +1.1%). Despite cooling in February, on a 3-month annualized basis, “supercore” CPI still increased by 6.9%, well above any Fed acceptable level. Turning to other Fed measures, the Atlanta Fed Sticky-Price CPI increased by 4% (on an annualized basis) in February versus a 6.7% rate in January, moving the year-over-year lower to 4.4% (vs. 4.6% YoY). On a core basis, the sticky-price index increased 4.3% (annualized) in February, and its 12-month percent change was 4.4% (vs. 4.6% YoY). The Cleveland Fed’s Median CPI increased by 0.4% MoM (vs. 0.5% MoM), moving the annual rate lower to 4.6 % (vs. 4.9% YoY). The trimmed-mean CPI index increased by 0.3% MoM (vs. 0.5% MoM), moving the annual rate lower to 3.5% (vs. 3.7% YoY). All in all, the report was a mixed bag but not as bad as the core monthly reading beat would suggest. The declines in sticky-price, median, and trimmed mean, along with the majority of the increase coming from insurance cost increases and shelter cost readings that still look off to other measures, means the Fed may not be as concerned with a second month of hotter-than-expected headline CPI data (in isolation).

*Higher gasoline costs drove headline CPI higher, while core was still driven by sticky shelter and insurance costs

*Core goods ticked higher on apparel and used vehicles picking up, while services saw a further increase in car insurance costs

*Supercore inflation receded from January’s peak due to declines in healthcare costs yet remains elevated

*Sticky price CPI continues to trend lower on an annual basis

*Median and trimmed-mean CPI measures also continue to trend lower
The Producer Price Index increased by 0.6% in February, following a 0.3% MoM increase in January and surpassing market expectations of a 0.3% MoM increase. The headline annual PPI rate increased to 1.6% from 1.1% in January. Core PPI increased by 0.3% in February, decreasing from the 0.5% MoM in January and keeping the annual rate at 2%. PPI, excluding food, energy, and trade, increased by 0.4% MoM, increasing the annual rate to 2.8% from 2.6% in January. Final demand goods prices increased by 1.2% MoM (vs. -0.1 MoM in Jan), the most in six months, primarily driven by a 4.4% (-1.1% MoM) increase in energy costs and a 1.0% (-0.3% MoM) rise in food prices. Final demand services increased by 0.3% MoM (0.5% MoM), with prices for transportation and warehousing services increasing by 0.9% MoM (-0.2% MoM), while “other” final demand services increased by 0.5% MoM (vs. 0.8% MoM) and trade services declined by -0.3% MoM (0.1% MoM). Intermediate processed goods increased by 1.6% MoM (-0.1% MoM), driven higher by large increases in energy goods (6.2% MoM vs. -0.9% MoM), while food and feeds (0.3% MoM vs. -1.6% MoM) and core processed goods (0.5% MoM vs. 0.3% MoM) contributed less to the increase. Unprocessed goods increased by 1.2% MoM (vs. 1.4% MoM). Services for intermediate demand increased by a subdued 0.1% MoM (vs. 0.7% MoM), with trade (-0.5% MoM vs. 0.8% MoM) decreasing, other intermediate services (0.1% MoM vs. 0.8% MoM) little changed and transportation and warehousing (1.1% MoM vs. 0.1% MoM) higher.
Key Takeaways: Despite the greater-than-expected monthly increase, largely due to higher energy costs, which contributed 70% of the increase, the overall PPI report was less worrying than the initial market reactions indicate, in our opinion. Overall service costs cooled to a more reasonable 0.3% MoM after a 0.5% MoM gain in January. The weaker increases in final demand for services, especially the decline in trade, and near flat reading for intermediate service demand indicate that the core services ex-shelter inflation pipeline cooled in February. Given reduced inventory accumulation and logistical evolution to counter the effects of the Red Sea and Panama Canal troubles, we would expect the increases in transporting and warehousing costs to cool moving forward. Finally, the parts of the PPI report that feed into the personal consumption expenditures price gauge cooled. Prices paid for portfolio management, a key element of the PCE price index, climbed 0.2% MoM, a sizable softening from the prior month, while the cost of hospital outpatient care increased by 0.5% MoM.

*Headline PPI came in higher-than-expected due to energy costs rising

*Service PPI inflation cooled from January
Import prices increased by 0.3% in February, following a 0.8% increase in January and matching market expectations. It was the second consecutive month of rising import prices, driven by a 1.8% (vs. 1.2% MoM in Jan) increase in fuel costs. Imported petroleum prices increased by 1.7% MoM, and natural gas prices rose notably by 6.8% MoM. Nonfuel imports increased by 0.2% in February, following a 0.7% increase in January. Price increases broadly decelerated, with consumer goods (0.3% MoM vs. 1.2% MoM in Jan), foods, feeds, and beverages (1.1% MoM vs. 1.7% MoM), capital goods (0.2% MoM vs. 0.4% MoM), industrial supplies and materials (0.3% MoM vs. 0.5% MoM) and automotive vehicles (0.1% MoM vs. 0.7% MoM) all showing disinflationary progress on the month. On a yearly basis, import prices declined by -0.8%, marking the 13th consecutive month of negative annual growth. Export prices increased by 0.8% in February, following a 0.9% increase in January and beating market expectations of a 0.2% MoM increase. Excluding food and fuels, export prices increased by 0.3% MoM, following a 0.1% MoM increase in January. Prices for nonagricultural commodity exports increased by 0.8% MoM, due to higher prices for for industrial supplies and materials (1.6% MoM vs. 2.1% MoM), capital goods (0.4% MoM vs. 0.8% MoM). However, these readings both cooled from January, while increases in nonagricultural foods (0.8% MoM vs. 0.6% MoM) accelerated. The price of exported autos and parts (vs. 0.4% MoM) and consumer goods (vs. -1.2% MoM) were flat on the month. Finally, prices for agricultural exports increased by 0.8% MoM as higher prices for nuts, fruit, vegetables, and wheat in February more than offset lower soybean prices. On an annual basis, export prices declined by -1.8%, the least in one year.
Key Takeaways: Similar to CPI and PPI, February’s import/export price data was driven by rising fuel and, to a lesser degree, food costs, although non-food exports did rise (mainly due to industrial supplies and materials) at a notable level, too. Core imports only increased by 0.1% MoM, and this is the most important takeaway from the report, in our opinion. Broad declines in the level of increases in various sub-categories showed that disinflationary progress resumed in February through the import channel. Monthly comparables for the next few months will be challenging, so increases in the annual rate optics will likely continue to push back on the disinflationary progress narrative. However, import prices are stable at their core level, excluding January.

*Import prices rose at a reduced rate in February, with core barely higher

*Export prices were again higher at a notable level, with increases in the price of food and industrial supplies mainly responsible for that
Retail sales increased by 0.6% in February, following an upwardly revised -1.1% fall in January and below market forecasts of a 0.8% gain. The biggest increases were seen in sales at building materials and garden equipment (2.2% MoM vs. -4.3% MoM in Jan), motor vehicles and part dealers (1.6% MoM vs. -2.1% MoM), and electronics appliance stores (1.5% MoM vs. 2.8% MoM). On the other hand, declines were largest in sales at furniture stores (-1.1% vs. 0.2% MoM), clothing (-0.5% MoM vs. -0.8% MoM), health (-0.3% MoM vs. -1.4% MoM) and nonstore retailers (-0.1% MoM vs. -0.3% MoM). Excluding food services, auto dealers, building materials stores and gasoline stations, the so-called core retail sales which are used to calculate GDP, were flat.
Key Takeaways: Despite the weaker-than-expected growth on the month, which came with a flat “core” reading, consumer spending is still tracking a 2.25% gain in the first quarter. This is consistent with a level that is above trend growth, something the Fed may see as increasingly problematic given the higher inflation readings for February. However, retail sales look to be decelerating, with the three-month moving average YoY change trending notably lower. With job markets loosening, credit access still tight and expensive, and prices not yet declining meaningfully, the consumer is becoming more cautionary and price-sensitive.

*The retail figures largely reflect purchases of merchandise, which comprise a relatively narrow share of overall consumer outlay

*There was payback from a weaker January (due to weather) reading in several sub-categories in February, including building materials and motor vehicles

* The control group for retail sales (which feeds into GDP) was unchanged on the month after a decline last month, keeping the three-month moving average lower
Industrial production increased by 0.1% in February, following a decline of -0.5% in January and surpassing market expectations of no growth. Manufacturing output increased by 0.8% MoM, recovering from a -1.1% drop in January and exceeding forecasts of 0.3% MoM rise. Final product production declined by -0.6% MoM (vs. -0.1% MoM in Jan), with consumer goods (-1.4% MoM vs. 0.3% MoM) declining and business equipment (1.7% MoM vs. -1.3%) rebounding from January's weakness. Construction supplies (1.9% MoM vs. -2% MoM) and materials (0.5% MoM vs. -0.6% MoM) also rebounded. Mining output also saw a significant increase of 2.2% (vs. -2.9% MoM), partially due to recovery from weather-related setbacks in January. However, utility output decreased by -7.5% (vs. -7.5% MoM) due to warmer temperatures, retracing January gains. Capacity utilization for the industrial sector remained at 78.3% in February, 1.3 percentage points below the long-term average of 78.5%.
Key Takeaways: The headline beat in manufacturing, which recovered most of the January decline, was concentrated in business equipment and construction supplies, with consumer goods notably weaker on the month. There were also downward revisions to January’s total IP decrease. Further, as seen elsewhere, the highest inventory-sales ratio at retailers since May 2020 risks further limiting factory production for consumer goods. Finally, although there was a pick up in investment plans on aggregate in Q4 earnings calls, recent business surveys have shown reduced appetite to expand capex, with what is being done likely more IT and AI-related, potentially reducing future demand for business equipment.

*Manufacturing activity rebounded from January, with mining activity also higher

*Consumer goods cooled while business equipment rebounded from January’s weakness

*Capacity utilization for manufacturing increased 0.6 percentage points to 77.0% in February
The University of Michigan Consumer Sentiment Index declined to 76.5 in March, the lowest in three months, from 76.9 in February, and below forecasts of 76.9.. The Consumer Expectations subindex fell to 74.6 from 75.2, while the Current Conditions subindex was unchanged at 79.4. Meanwhile, inflation expectations for the year ahead were unchanged at 3%, and five years ahead were steady at 2.9%.
Key Takeaways: There was little change in the initial reading of sentiment, with only expectations falling. Meanwhile, there was no change in inflation expectations. “Small improvements in personal finances were offset by modest declines in expectations for business conditions,” estimates showed. Consumers perceived few signals that the economy is currently improving or deteriorating and many are withholding judgment about the trajectory of the economy, particularly in the long term, pending the results of this November’s election. In fact, inflation expectations fell, and overall sentiment improved for Republican-leaning respondents notably.

*Despite the cooling in recent readings, the three-month average remains in an upward trend

*Republican-leaning respondents seemed much happier now that Trump has secured the nomination
The New York Fed’s Empire State Manufacturing Index declined to -20.9 in March from -2.4 in February, much worse than forecasts of -7. Demand and activity measures broadly weakened. Shipments (-6.9 vs. 2.8 in Feb), New Orders (-17.2 vs. -6.3), and Unfilled Orders (-10.9 vs. -9.6) all contracted. Delivery Times (-1 vs. -3.2) moved closer to unchanged, while Inventories (-12.9 vs. -9.6) contracted at a faster pace. Labor measures weakened, with the Number of Employees (-7.1 vs. -0.2) and Average Workweek (-10.4 vs. -4.7) both moving into contractionary territory. Inflation pressures were little changed, with Prices Received (17.8 vs. 17) slightly higher and Prices Paid (28.7 vs. 33) marginally lower. Forward-looking measures were more upbeat, with little change in the general business conditions index, and still notably expansionary. Hiring intentions improved while expected prices received also moved notably higher. Expected new orders were little changed, while shipments expanded at a faster pace. Finally, capex intentions were unchanged, while anticipated technology spending declined.
Key Takeaways: The NY Fed’s regional manufacturing survey is proving to be a very volatile series with questionable real signaling power at the current reading level. Further, the future reading level continues to remain what seems too optimistic overall. With that said, this report showed increased inflationary pressures and reduced hiring demand, splitting the key areas the Fed is watching. The lack of expansion in capex and decline in technology spending also reinforces what other regional surveys have increasingly been showing on aggregate and counters what Q4 earnings calls told us.

*There is a widening divergence between current and forward readings

*Price measures firmed in February
The NFIB Small Business Optimism Index declined to 89.4 in February, the lowest in nine months, from 89.9 in January, and below forecasts of 90.7. 23% of owners reported that inflation was their single most important business problem, up three points from last month, and replacing labor quality, which decreased five points to 16%, the lowest reading since April 2020. The Uncertainty Index increased to 76 in February from 73, the highest reading since October.
Labor Markets and Compensation: Owners’ hiring plans slowed, with 12% (-2% points from Jan) planning to create new jobs in the next three months, the lowest level since May 2020. Overall, 56% (+1) reported hiring or trying to hire in February. 37% (-2) of owners reported having openings they could not fill, the lowest reading since January 2021. The difficulty in filling open positions is particularly acute in the construction, transportation, and wholesale sectors. 35% (-4) of owners reported increasing compensation in February, while 19% (-7) plan to raise compensation in the next three months. 11% (+1) of owners cited labor costs as the single most important problem.

Earnings and Sales: -31% (-1) of owners reported positive profit trends. -13% (-2) of owners reported higher nominal sales in the past three months, while expectations for higher sales improved to -10% (+6).

Capex and Inventory: -1% (-1) of owners reported inventory increases. Not seasonally adjusted, 13% (unchanged) reported increases in stocks, and 19% (unchanged) reported reductions. -4% of owners viewed current inventory stocks as “too low” in February, unchanged from January. 54% (-5) of owners reported capital outlays in the last six months. Of those making expenditures, 35% acquired new equipment (-5), 23% (-2) acquired vehicles, 15% (-2) improved or expanded facilities, 12% (unchanged) spent on new fixtures and furniture, and 6% (-1) acquired new buildings. 21% (-2) of owners plan capital outlays in the next few months. 4% (-1) reported financing was their top problem.

Inflation: 21% (-1) of owners reported raising selling prices, the lowest reading since January 2021. Price hikes were most frequent in finance (59% higher, 2% lower), retail (43% higher, 13% lower), construction (42% higher, 8% lower), and services (36% higher, 8% lower). 30% (-3) of owners plan price increases.

Credit Markets: 33% (unchanged) of owners reported borrowing needs unmet, with 7% (+1) reporting the latest loan was harder to get, while 61% (-1) reported no interest in a loan. The average rate paid on short-maturity loans was 8.7%. 25% (-4) of owners reported borrowing on a regular basis, the lowest since June 2022.

Key Takeaways: Small business owner’s outlook for near-term business conditions is at 50-year low levels. In February, 39% expected “worse” conditions in six months, and only 7% expected “better.” A recovery in investment is needed to support a further improvement in productivity, according to NFIB commentary, but this is unlikely to occur while owners remain pessimistic about future business conditions and lending standards tighten with higher interest rates. Further, although labor costs have never been ranked at the top as the “Most Important Business Problem,” it has risen to its highest levels in 50 years (at 12% in Feb. 2023). Thirty-eight percent reported raising compensation in February, a bit below the average for last year (40%) but “inflationary,” well above the historical average of 25%. Even as compensation is raised, owners are reducing final prices at a faster rate, indicating that margins will increasingly be pressured.

*The majority of index components weakened on the month

*There was greater weakness in hard components versus soft

*The uncertainty index picked up again
Technicals, Positioning, and Charts:
The S&P outperformed the Russell and Nasdaq on the week. Energy, Materials, and Financials were the best-performing sectors, while Low Volatility, Growth, and Value were the best-performing factors. Large-Cap Growth was the best-performing size/value combo of the week.

@Koyfin
S&P optionality strike levels have the Zero-Gamma Level at 5120 while the Call Wall is 5200 and the Put Wall is 5150. Today’s OPEX is large, especially in single stocks, which are shorter-dated speculative positions, which we think has drawn larger hedging flows. These call-heavy expirations have been associated with periods of equity consolidation, with SPX still in its more gamma-neutral zone of 5,100 to 5,200. Spotgamma sees a break of the 5,100 level as leading to a swift test of 5,000, at which point rising implied vols will be the signal of further downside risk.

@spotgamma
S&P (/ES Futures) technical levels have support at 5165, then 5145, with resistance at 5200, then 5215.

@AdamMancini4
Treasuries are lower on the day, with the 10yr yield around 4.30%, while the 5s30s curve is slightly flatter on the session, moving to 11 bps.

Four Key Macro House Charts:

Growth/Value Ratio: Growth is higher on the week; with Large-Cap Growth the best-performing size/factor on the week.

Chinese Iron Ore Future Price: Iron Ore futures are lower on the week.

5yr-30yr Treasury Spread: The curve is flatter on the week.

EUR/JPY FX Cross: The Euro is stronger on the week.
Other Charts:

Investment managers continue to be very bullish, with the NAAIM index reaching a new high.

Buyback levels continue to be higher than expected and averages seen in the past.

Equity fund inflows have been exceptionally strong, thanks to a rebound in tech sector flows.

Growth looks to be overbought and extended, with valuations still high compared to global stocks.

Small-cap implied volatility has been falling in comparison to large-cap, as the Russell has outperformed the S&P in recent weeks.

Fed rate hikes have had a limited impact on households’ financial burdens. – BofA

Borrowing costs are rising fast and will increasingly affect real activity as excess savings run down and debt must be refinanced. – MS

U.S. households’ disposable income growth is expected to slow this year but still be higher than other advanced economies. – Oxford Economics

"Labor productivity just jumped to a record high after 15 years of no gains." – BofA

Global PMIs have moved back into expansionary territory. – JPM

The ECB is expected to have the greatest level of cuts, and likely start the earliest. - GS
Articles by Macro Themes:
Medium-term Themes:
China’s Rebalancing Act:
Beijing Backing: China has asked banks to enhance financing support for state-backed China Vanke and called on creditors to consider private debt maturity extension, in a rare intervention from central government to help an embattled property firm. The State Council - China's cabinet - is coordinating support effort for China Vanke, said the sources with direct knowledge of the matter, adding financial institutions have been requested to make swift progress. Authorities are scrambling to stabilise a real estate sector in the throes of a debt crisis characterised by default among the country's biggest property firms, with support including boosting financing for developers of certain projects. - Chinese regulators ask large banks to step up support for Vanke - Reuters

New Philosophy: The Chinese legislature voted to change a four-decade-old law so it tightens the Communist Party’s grip on the cabinet, underscoring President Xi Jinping’s drive to give the party control over all the main levers of government. The changes would emphasize the party’s leadership over the cabinet and encourage it to follow certain ideologies including Xi Jinping Thought. They would also subject the body to greater oversight from the legislature, which is packed with party members. “The new law could help entrench Xi’s vision for party-led governance into the future by also making it easier for future leaders to keep the State Council in check,” said Neil Thomas, a fellow on Chinese politics at the Asia Society Policy Institute’s Center for China Analysis. - China Cements Ruling Party’s Grip on Cabinet With Law Change - Bloomberg
Longer-term Themes:
The Singularity is Near (AI Developments) and Cyber Life (More Generally):
AI Rules: European lawmakers approved the world’s most comprehensive legislation yet on artificial intelligence, setting out sweeping rules for developers of AI systems and new restrictions on how the technology can be used. The new legislation applies to AI products in the EU market, regardless of where they were developed. It is backed by fines of up to 7% of a company’s worldwide revenue. The AI Act is “the first regulation in the world that is putting a clear path towards a safe and human-centric development of AI,” said Brando Benifei, an EU lawmaker from Italy who helped lead negotiations on the law. The law still needs final approval from EU member states, but that process is expected to be a formality since they already gave the legislation their political endorsement. - European Lawmakers Pass AI Act, World’s First Comprehensive AI Law – WSJ

The Demise of Unipolarity: A World of Rising Regional Sphere:
China-Built: If the government of newly installed Cambodian Prime Minister Hun Manet follows through on plans, future shipments could travel along a $1.7 billion, Chinese-funded canal. The Funan Techo canal would directly connect Phnom Penh with Cambodian ports on the Gulf of Thailand, bypassing Vietnam's traditional hold on the mouth of one of Asia's biggest waterways. Vietnam has formally raised alarm over the canal's potential effect on the Mekong Delta in the absence of a publicly available environmental impact assessment for the canal, which is part of China's ambitious yet financially stretched investments in infrastructure projects across Asia. - Cambodia to divert Mekong trade via China-built canal, vexing Vietnam - NikkeiAsia

Hacking Biology (Medical Innovations):
Design Risks: Over 90 biologists and other scientists who specialize in A.I. technologies used to design new proteins (the microscopic mechanisms that drive all creations in biology) have signed an agreement that seeks to ensure that their A.I.-aided research will move forward without exposing the world to serious harm. The biologists, who include the Nobel laureate Frances Arnold and represent labs in the United States and other countries, also argued that the latest technologies would have far more benefits than negatives, including new vaccines and medicines. The agreement does not seek to suppress the development or distribution of A.I. technologies. Instead, the biologists aim to regulate the use of equipment needed to manufacture new genetic material. - Dozens of Top Scientists Sign Effort to Prevent A.I. Bioweapons - NYT

Chewable Cure: If you have a dog or cat, chances are you’ve given your pet a flavored chewable tablet for tick prevention at some point. What if you could take a similar pill to protect yourself from getting Lyme disease? Tarsus Pharmaceuticals is developing such a pill for humans that could provide protection against the tick-borne disease for several weeks at a time. In February, the Irvine, California–based biotech company announced results from a small, early-stage trial showing that 24 hours after taking the drug, it can kill ticks on people, with the effects lasting for up to 30 days. Lyme disease is a fast-growing problem in the United States, where approximately 476K people are diagnosed and treated for it each year, according to the most recent data from the Centers for Disease Control and Prevention. - A Pill That Kills Ticks Is a Promising New Weapon Against Lyme Disease - Wired

Other Articles of Interest:
Deficit Claims: Some 11 million people live in California’s high-risk wildfire zones, areas that include Los Angeles county, San Diego and the vineyards of Napa and Sonoma. Not long ago, they and homeowners in natural disaster regions around the US would have almost certainly had insurance through a big, national company. But a growing number of insurers are cutting their business in those areas, deterred by more intense and frequent natural disasters, plus state-imposed limits on how much they can charge. Homeowners in the most risky places are now more likely to be covered by state-created, “last resort” insurance programs that provide protection where the private market won’t. Those plans have more than doubled their market share since 2018, and their liabilities crossed the $1 trillion threshold for the first time in 2022. The most climate-vulnerable states are the most exposed: As of now, Florida’s plan could suffer $525 billion in losses; In California, it’s at least $290 billion, up sixfold from 2018. - A Hidden Crisis in U.S. Housing - Bloomberg

Globalization is Fine: Set aside Russia’s sudden decoupling from European trading partners and the slow unraveling of the US-China relationship over the past few years, globalization is holding up just fine. That’s among the conclusions in the 2024 edition of the DHL Global Connectedness Report released on Wednesday, based on research from NYU’s Stern School of Business. While commerce between the two largest economies is diminishing, the report found “there are no dramatic recent shifts by close allies of either the U.S. or China away from flows with the rival superpower and its allies.” - DHL Global Connectedness Report 2024

Restrictive Cooperation: When a landmark science and technology agreement between the U.S. and China reached its expiration in late February without an extension, it plunged the academic community in both countries into uncertainty. Neither country confirmed an extension for nine days. Had it lapsed? Not really, it turns out. But the extension was made so quietly as to be imperceptible without an official statement published online. And for the second time in a row, it would only keep the agreement alive for another six months while Washington and Beijing continue negotiations. The stealthiness of the latest move, and the prolonged nature of the deeper discussions, highlight the complex state of U.S.-China relations, as both countries try to work out new parameters of engagement and rivalry while vying for global technological and military supremacy. - U.S. and China Extend Landmark Bilateral Deal, Very Quietly – WSJ

New Framework: The European Central Bank unveiled a rare makeover to the inner workings of monetary policy, in a change that is technical but consequential for the economy and investors. The keenly awaited plan, over a year in the making, aims to gradually reduce the size of the ECB’s footprint in the region’s financial system, in part by transforming how banks interact with the central bank—and with each other. One of the goals is to revive short-term lending between banks and other financial institutions. This would restore normality after such transactions dried up (and never fully recovered) when trust between institutions collapsed during the global financial crisis. The changes don’t mean the ECB will recede into the background. It will maintain sizable bond holdings, and its presence in financial markets will still loom bigger than it did before the financial crisis broke out some 15 years ago. - In Rare Makeover, ECB Tries to Get Banks Lending to One Another Again – WSJ

VIEWS EXPRESSED IN “CONTENT” ON THIS WEBSITE OR POSTED IN SOCIAL MEDIA AND OTHER PLATFORMS (COLLECTIVELY, “CONTENT DISTRIBUTION OUTLETS”) ARE MY OWN. THE POSTS ARE NOT DIRECTED TO ANY INVESTORS OR POTENTIAL INVESTORS AND DO NOT CONSTITUTE AN OFFER TO SELL -- OR A SOLICITATION OF AN OFFER TO BUY -- ANY SECURITIES AND MAY NOT BE USED OR RELIED UPON IN EVALUATING THE MERITS OF ANY INVESTMENT.THE CONTENT SHOULD NOT BE CONSTRUED AS OR RELIED UPON IN ANY MANNER AS INVESTMENT, LEGAL, TAX, OR OTHER ADVICE. YOU SHOULD CONSULT YOUR OWN ADVISERS AS TO LEGAL, BUSINESS, TAX, AND OTHER RELATED MATTERS CONCERNING ANY INVESTMENT. ANY PROJECTIONS, ESTIMATES, FORECASTS, TARGETS, PROSPECTS AND/OR OPINIONS EXPRESSED IN THESE MATERIALS ARE SUBJECT TO CHANGE WITHOUT NOTICE AND MAY DIFFER OR BE CONTRARY TO OPINIONS EXPRESSED BY OTHERS. ANY CHARTS PROVIDED HERE ARE FOR INFORMATIONAL PURPOSES ONLY, AND SHOULD NOT BE RELIED UPON WHEN MAKING ANY INVESTMENT DECISION. CERTAIN INFORMATION CONTAINED IN HERE HAS BEEN OBTAINED FROM THIRD-PARTY SOURCES. WHILE TAKEN FROM SOURCES BELIEVED TO BE RELIABLE, I HAVE NOT INDEPENDENTLY VERIFIED SUCH INFORMATION AND MAKE NO REPRESENTATIONS ABOUT THE ENDURING ACCURACY OF THE INFORMATION. I MAY OR MAY NOT HAVE POSITIONS IN ANY STOCKS OR ASSET CLASSES MENTIONED. I HAVE NO AFFILIATION WITH ANY OF THE COMPANIES OTHER THAN EXPLICITLY MENTIONED.